Baojun Xu (Correspondence)
[email protected]
+86 756 3620636; fax: +86 756 3620882
1Food Science and Technology Program, Beijing Normal University-Hong Kong Baptist University United
International College, Zhuhai, Guangdong 519085, China
+Running title: Food quality of ready-to-eat ginseng chips
Abstract: As a kind of herbal medicine, different processing methods have been studied to improve ginseng qualities. However, as a food material, ginseng processing has not been fully studied. The objective of this study was to develop novel food products for ready-to-eat (RTE) ginseng chips with specific flavors through food processing (soaking with different media, pre-heating, steaming, freezing and freeze drying). Changes in chroma, texture, total phenolic contents (TPC), and DPPH radical scavenging activities (DPPH) of novel ginseng product were investigated. Results showed that ginseng treated with most of soaking media obtained significant differences (p < 0.05) in food properties. Typically, significant (p < 0.05) color changes in ginseng chips was found in ginseng treated with black soybean soaking water. An obvious enhancement of total phenolic contents (TPC) and DPPH were found in green tea water. RTE ginseng chips with value–added and specific flavor were successfully obtained by food processing technology.
Keywords: Ready-to-eat, flavored ginseng chips, Chroma, Texture, Phenolics, Antioxidants
Practical applications
This research would have practical applications in providing value-added novel food products derived ginseng. Presented information will provide useful information for food industry to develop new ready-to-eat ginseng food products with specific flavors. and textures.
1. Introduction
Ginseng (Panax ginseng Meyer) is a kind of nourishing and pervasive herbal medicine in Northeast Asia. As a kind of herbal medicine, different processing methods have been studied to improve ginseng qualities which meet the requirement of market. However, as a food material, ginseng processing has not been fully studied. In
2012, China Ministry of Health approved cultivated ginseng (root and rhizome of Panax ginseng C. A. meyer) as a “New Food Material”. Five-year-old or younger ginseng was permitted to enter into food market by state approval on August 29 of 2012 and could be used as a food material in China. So ginseng root is no longer only used as therapeutic agents but also marketed as dietary supplements or raw materials of health food. Since then, ginseng started to enter China food field. However, in China historical manufacturing, ginsengs were processed by rough machining which lead to plenty of beneficial compounds wastage.
http://www.ijSciences.com Volume 3 – October 2014 (10)
17
conversion have been applied to the preparation of ginsengs products (Liu et al., 2010; Oh et al., 2010). Red ginseng (obtained through a process of steaming and drying from white ginseng) and black ginseng (nine times steaming, nine times drying) were two typical examples which can create or enhance the physiological ingredients of ginseng by a series of processing method (Ban et al., 2010). In addition, compared to raw ginseng, ginsenosides content could be improved by food processing technology, such as activate bioactive components by thermal processing or acid impregnation (Ban et al., 2010; Kim et al.,
2000; Kim et al., 2011). As an effective method, food
processing could improve the content of ginsenosides and obtain a significant difference for developing the valid values of processed ginseng products.
Read-to-eat ginseng chips marketed in China is not very popular so far, it may be caused by their original flavor, which is more close to herbal flavor of ginseng. Thus, it is necessary to modify the flavor and texture in order to make the end-product as a food through food formulation and food processing techniques.
Therefore, this study aimed to develop a novel ginseng product based on food processing technology include soaking with flavored soaking media, steaming and vacuum freeze-drying, and to develop value added novel ginseng product with specific flavors. Food quality attributes in terms of texture, color, as well as phenolic contents and antioxidant activities of novel ginseng products were evaluated in this study.
2. Materials and Methods
2.1. Ginseng Materials
Dried white ginseng commercial products were purchased from DaQin Specialty Supermarket in DunHua City, Jilin Province, China. The white ginseng products were made from fresh ginseng (five-year ginseng, harvested in 2008) which were cultivated in Fusong County, Baishan City, Jilin
Province of China. Ginsengs without obvious defects or injuries were used for further processing. The average moisture content and the average weight of the dried white ginseng was 7.4±0.5% and 21.5±2.3 g, respectively.
2.2. Food Media for Soaking Use
The following soaking media were selected due to their popular application in food processing or popularity as a food. Coca-cola (600 mL, bottled), milk (Yili pure milk, 250 mL), Chinese liquor (Jiujiang Shuangzheng, 29.5% alcoholic content), 9 ° vinegar (Donggu, white vinegar, total acid ≥ 9.0 g/100 mL), 5 ° vinegar (Haitian Jinbiao, rice vinegar, total acid ≥ 5.0 g/100 mL), local beer (Haizhu, ≥ 4.1% alcoholic content), tap water, green tea (Chezi, teabags, 2 g × 25), black tea (Lipton, teabags, 2 g × 25), black soybean, adzuki bean, glucose, sucrose, perilla seed (purchased in herbal medicine store), Schisandra chinensis (purchased in herbal medicine
store), soy milk (Vitasoy, original flavor, 1L), red wine (Great Wall dry red wine, 12% alcoholic content) were used in this study.
2.3. Chemicals and Reagents
Trolox was supplied from Sigma-Aldrich Co. (St. Louis, MO, U.S.A.). Folin- Ciocalteu reagent was obtained from Shanghai Sanjie Biotechnology Co., Ltd (Shanghai, China). The other chemicals were purchased from Tianjin Damao Chemical Reagent Co, Ltd (Tianjin, China) or Guangzhou Chemical Reagent Company (Guangzhou, China). All other chemicals were of analytical grade.
2.4. Ginseng processing
http://www.ijSciences.com Volume 3 – October 2014 (10)
18
solution (1 : 1 w/w), sucrose solution (sucrose in water, 1 : 1 w/w), perilla seed soaking water (5 g/100 g), schisandra chinensis soaking water (5 g/100 g), soy milk, and red wine. The detailed information was listed in Table 1.
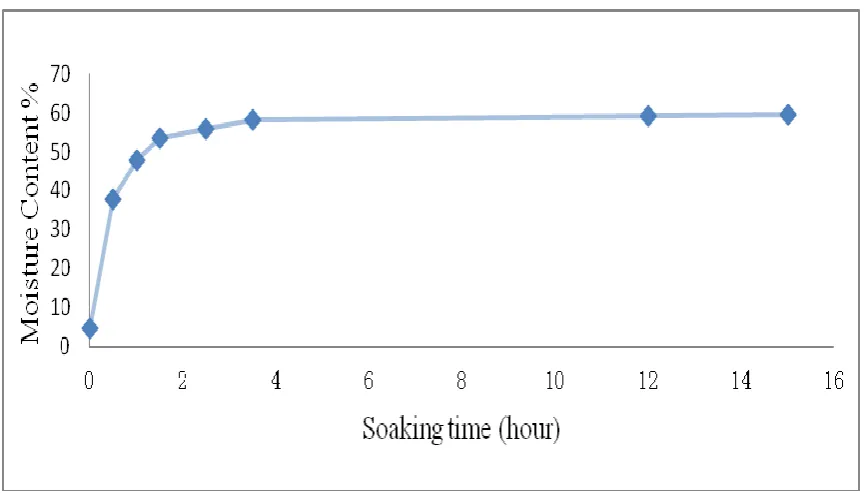
2.4.2. Soaking - Selection of Soaking Time
The relationship between soaking time and moisture content of white ginseng was shown in Fig. 1. It indicated that moisture content trend to achieve saturation stage when white ginseng slices soaked in water for 3.5 hr. In order to avoid loss nutritional contents, soaking time at 3.5 hr were selected as the optimal time for white ginseng soaking treatment.
2.4.3. Soaking Processing
Sliced ginseng (14 - 15 g) was soaked for 3.5 hr at 4℃ in refrigerator after adding 50 mL different soaking media.
2.4.4. Thermal Processing (pre-heating, steaming,
freezing, and freeze drying)
Soaked ginseng were placed in a flat container and then pre-heating in drying oven at 60℃ for 0.5 hr (kept relative humidity between 50 - 98 %), and then steamed for 1 hr at 120℃, followed by freezing at -80℃ refrigerator and freeze dried by vacuum freeze drier (FreeZone 1 liter benchtop, Labconco company). The final products (ready-to-eat (RTE) flavored ginseng chips) were sealed through vacuum packaging and stored in refrigerator for further analysis. The whole processing procedures were shown in Fig. 2.
2.5. Determination of Color Values
Chromatism of different samples was determined by following the method of Xu, Yuan and Chang (2007). Color values of the processed RTE flavored chips were measured with a Konica Minolta Chroma Meter (Model CR-410, Minolta Camera Co., Osaka, Japan) using the Hunter scale for L, a, and b. Calibration was conducted on a standard white plate (Y = 86.4, x = 0.3156, y = 0.3231). Results were expressed as
tri-stimulus values (L: lightness (0 = black, 100 = white), a (-a = greenness, +a = redness), and b (-b = blueness, +b = yellowness)). These values were then used to calculate chromatism by commonly formula ΔE = [ΔL2+Δa2+Δb2]1/2, and hue degree (ho = arc
tangent [b/a]), chroma (C = [a2+b2]1/2), which was the
intensity or color saturation.
2.6. Texture Analysis
Textures of processed RTE flavored ginseng chips were analyzed by CT3 texture analyzer (Brookfield, Massachusetts, U.S.A.). TA 7 detector and TA-JTPB fixer were combined to detect the frangibility at room temperature under testing condition with pre-test speed of 2 mm/s, test speed of 0.5 mm/s, post test speed of 0.5 mm/s and target value 2 mm. All machine setting were followed the instruction of operational manual and the results were expressed as g force/processed ginseng chip.
2.7. Determination of Total Phenolic Contents
(TPC)
Phenolic compounds were extracted from processed RTE flavored ginseng chips powders follow the description of Singleton and Rossi (1965) with slight modifications by Xu, Yuan and Chang (2007). Total phenolic contents (TPC) was analyzed using Folin-Ciocalteu method followed the instruction of Xu and Chang (2007).
2.8. Determination of DPPH Free Radical
Scavenging Activities
The method of extracting DPPH was referred to TPC extraction method as above description which was followed the instruction of Xu and Chang (2007). DPPH was determined based on the method of Chen and Ho (1995) with some modification by Xu and Chang (2007).
2.9. Statistical Analysis
http://www.ijSciences.com Volume 3 – October 2014 (10)
19
2010 package and SPSS package (SPSS 17.0, SPSS Inc, Chicago, IL, U.S.A.). Analysis of variance (ANOVA) was conducted by Excel, and Duncan’s multiple range tests were used to determine the significant (p < 0.05) differences.
3. Results and Discussions
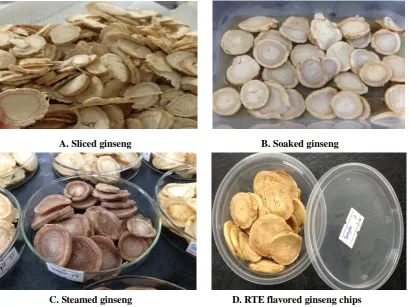
3.1. Morphological Properties of RTE Flavored Ginseng Chips
Morphological properties of processed ginseng products were shown in Fig. 3. Typically, it appeared purple color in black tea and obtained dark yellow color in sucrose-vinegar solution soaking medium, and coca-cola soaked ginseng chips appeared a dark browning color.
3.2. Flavor Properties of RTE Flavored Ginseng Chips
Most kinds of ginseng chips were with various specific flavors. Especially, sucrose -vinegar solution soaking medium treated ginseng presented with favorable sour and sweet flavor. Sucrose and glucose solutions contributed sweet flavor to RTE flavored ginseng chips. Ginseng chips soaked with coca-cola created slight coca-cola flavor.
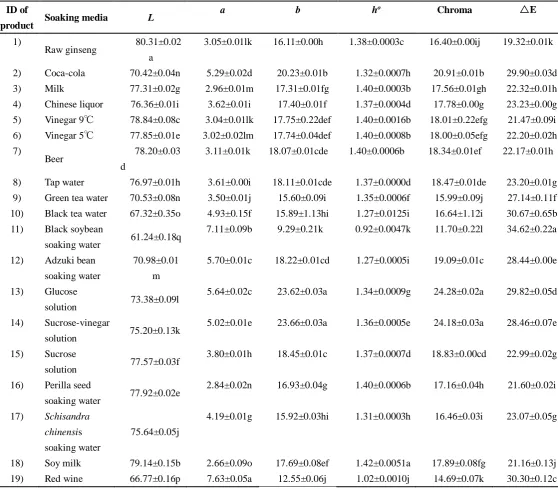
3.3. Color Values of RTE Flavored Ginseng Chips Chromatism is a kind of problem relates to sensory and subjective explanation. Many factors can change the color of a substance and lead to the chromatism. Thus chromatism will be a good indicator to describe the sensory properties of different novel ginseng products. Also color is an index for grading Asian red ginseng. It has been studied surface color formation of Asian ginseng will be effected by drying time and temperature (Ren et al., 2000). In addition, brightness, chroma, and hue are the properties of color consist of three-dimensional which can describe chromatism concisely and clearly.
Brightness, chroma and hue value of novel ginseng products with soaking media, such as coca-cola, milk, Chinese liquor, vinegar, etc., were shown in Table 2.
Within expectation, some of the processed ginseng chips presented big color change with significant (p < 0.05) differences compared to original ginseng. For L value, significant (p < 0.05) differences were found among most soaking treatments, but no significant difference was found between perilla seed and 5oC
vinegar, and between coca-cola and green tea water. The highest L value (80.3) was obtained from raw ginseng, the lowest L value (61.2) from black soybean soaking water which obtained anthocyanin from soaking media, lead to low brightness value. For indicator a value, most soaking treatments caused significant (p < 0.05) differences and the maximum one processed by red wine which contributed the red pigment increase from 3.1 to 7.6. For indicator b value, it ranged from 9.3 in black soybean soaking water to 23.7 in sucrose - vinegar solution ginseng chips with significant (p < 0.05) differences.
Significant (p < 0.05) differences were found in hue degree, chroma and △E among most of soaking treatments. The highest value of hue degree was contributed from soy milk (1.4) and lowest from black soybean soaking water (0.9). The highest chroma value was obtained from ginseng treated with glucose solution (24.3) and sucrose – vinegar solution (24.2) with no significant differences, the lowest from black soybean soaking water (11.7) due to the anthocyanin. △E is the common indicator for chromatism (color different) based on L, a, b. All soaking treatments exhibited color changes compared to raw ginseng (without processing) with significant (p < 0.05) differences. Surprisingly, the lowest △E value (19.3) was found in raw ginseng, the highest value (34.6) was found in black soybean soaking water.
http://www.ijSciences.com Volume 3 – October 2014 (10)
20
that Maillard products of amino acids and reducing sugar will form different degrees browning color after heating.
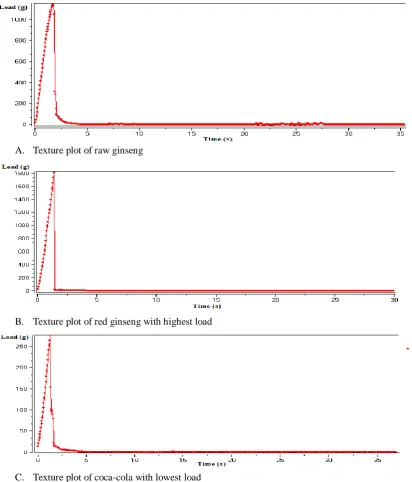
3.4. Texture of RTE Flavored Ginseng Chips Crispness is a kind of texture indicator for food quality that relate to hardness, fracture stress and breaking energy. It plays an important role in food structure for consumers to assess the food quality. Nowadays, there is still without a clear evaluation method for analysis crispness, but texture analyzer is widely applied in food area. It has been studied that the maximum force (Fmax) can be reflected as the
characteristic of crispness. Also crispness holds a high positive correlation with hardness (Hu et al.,
2010; Yu and Ishiuchi, 1996).
The texture plots of ginseng samples were presented in Fig. 4. Hardness of ginseng products made with different soaking medium ranged from 282.5 g in coca-cola treated ginseng to 1829.5 g in red wine treated ginseng, crispness ranged from 280.3 g to 1814.8 g, and hardness deformation (HD) was ranged from 2.15% in adzuki bean soaking water treated ginseng to 10% in sucrose solution treated ginseng (Table 3). Significant (p < 0.05) differences of hardness and crispness were found among most of soaking media treated ginseng. But no significant differences between ginseng products treated with glucose solution and milk, between raw ginseng and Schisandra chinensis treated ginseng, between Chinese liquor and sucrose- vinegar solution, between 9oC vinegar and black soybean soaking
water treated ginseng, between 5oC vinegar and
soybean milk treated ginseng and among tap water, green tea water and adzuki bean soaking water treated ginseng. The biggest crispness and hardness of soaking medium were shown in red wine treated ginseng. The changes in hardness and crispness among different soaking media treated ginseng, predominantly depended on the process of freeze drying. The differences may attribute partly to the thickness differences of ginseng slices caused by
mechanical error of slicer.
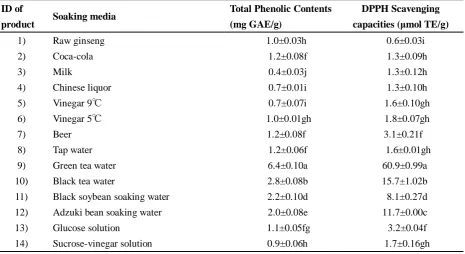
3.5. Total Phenolic Content of RTE Flavored Ginseng Chips
Total phenolic content (TPC), an important indicator for antioxidant activity, consists of substantial amount of flavonoids which contain many beneficial effects on human’s health (Fraga et al., 2010). It has been studied that TPC values of adlay can be increased by different thermal studied (Xu and Chen, 2013).Therefore, TPC was hopefully to have a big enhancement by the food processing method in this research.
Significant differences (p < 0.05) were shown (Table 4) among most soaking treatments. The highest TPC value was found in green tea water soaked ginseng, which increased from 1 mg GAE/g to 6.4 mg GAE/g, which has a 6.4 times enhancement. Also black tea water, black soybean soaking water, adzuki bean soaking water and red wine treated ginseng products showed significant advancement compared to raw ginseng. TPC was increased 2.8 times in black tea water treated ginseng. 2.2 times enhancement in black soybean soaking water treated ginseng. Advance for 2 times in adzuki bean soaking water treated ginseng and boosted for 2.5 times in red wine treated ginseng. And the lowest concentration with 40% reduction of initial value presented in milk (0.4 mg GAE/g) treated ginseng with significant (p < 0.05) differences.
http://www.ijSciences.com Volume 3 – October 2014 (10)
21
boosted TPC to 110% - 129% of initial value, the food processing method in this research seems to more efficiency in improving TPC. This phenomenon can be attributed to steaming, freeze drying and soaking materials, such as tea and legumes rich in polyphenols.
3.6. DPPH radical scavenging activities of RTE
flavored ginseng chips
As a stable radical, DPPH is widely applied in food for determine antioxidant capacity (Xu and Chang, 2007). Therefore, it can be a good indicator and antioxidant to novel ginseng products. DPPH values of ginseng chips made with various soaking media ranged from 0.6 μmole TE/g in raw ginseng to 60.9 μmole TE/g in green tea water treated ginseng (Table 4). All soakings treatments were obtained improvement as compared to raw ginseng through food processing. Also significant (p < 0.05) differences in DPPH were shown among most of soaking. The highest DPPH value 60.9 μmole TE/g was obtained from green tea water treated ginseng which exhibited 100 times increased as compared to raw ginseng. In addition, DPPH values in ginseng treated with black tea water (15.7 μmole TE/g), adzuki bean soaking water (11.7 μmole TE/g) and red wine (11.3 μmole TE/g) were increased 17-25 times compared to that of raw ginseng. The enhancement in DPPH values could be owed to the soaking materials which has already reported by Satoh et al (2005) that tea high in DPPH with nearly 90% DPPH scavenging rate especially green tea and DPPH in bean was studied that possessed nearly 20 μmole TE/g (Xu and
Chang, 2007). Also radical scavenging rate increased
by steaming process, and Maillard reaction products and phenolic acids have been suggested as active free radical scavengers from previous study (Kim et al.,
2000; Kang et al., 2007). Red wine was the typical
soaking sample high in phenolic acid which has been determined by Rafifa et al (2004). In addition, antioxidant activity was induced by steaming and heated treatments which were attributed to Maillard reaction products (Cho et al., 2008; Wong et al.,
2008).
4. Conclusions
Value added ginseng products with specific flavor were created by food processing technology in this study. Many of them were improved in terms of key attributes of ginseng quality. Ginseng total phenolic content (TPC), DPPH scavenging activity in most ginseng products were obtained significant (p < 0.05) improvement. Also chroma and texture of some novel ginseng products revealed significant (p < 0.05) changes. The ginseng processing technology in this study seems to be an effective way to create value added RTE ginseng chips with specific flavors. Typically, green tea treated ginseng with high total phenolic content and DPPH radical scavenging activity (TPC – 5.4 time increased, DPPH – 101 time increased).
Acknowledgements
This research was jointly supported by Natural Science Foundation of Guangdong Province, China (Project code: S2012010008961), and a research grant (UICRG 201316) from Beijing Normal University-Hong Kong Baptist University United International College, China.
References
1) Ban, Y.J, Yang, B.W., Baik, M.Y., Hahm, Y.T. and Kim, B.Y.
2010. Optimization ofthe manufacturing process for black
ginseng. J. Korean Soc. Apply Biol. Chem. 53, 71-77.
2) Chen, C.W. and Ho, C.T. 1995. Antioxidant properties of
polyphenols extracted from green and black teas. J. Food Lipids2, 35-46.
3) Cho, E.J., Piao, X.L., Jang, M.H., Baek, S.H,. Kim, H.Y.,
Kang, K.S., Kwon, S.W. and Park, J.H. 2008. The effect of
steaming on the free amino acid contents and antioxidant
activity of Panax ginseng. Food Chem. 107, 876-882.
4) Fraga, G.G., Galleano, M., Verstraeten, S.V. and Oteiza, P.I.
2010. Basic biochemical mechanisms behind the health
benefits of polyphenols. Mol. Aspect Med. 31, 435-445.
5) Hu, X., Xia, Y.B. and Deng, H.Q. 2010. Determination of
chopped chili brittleness with texture analyzer. China
Academic Journal Electro Publishing House 3, 39-343.
http://www.ijSciences.com Volume 3 – October 2014 (10)
22
Yokozawa, T. 2007. Study on the hydroxyl radical
scavenging activity changes of ginseng and ginsenoside-Rb2
by heat processing. Biol. Pharm. Bull.30, 724-728.
7) Kim, W.Y., Kim, J.M., Han, S.B., Lee, S.K., Kim, N.D., Park,
M.K., Kim, C.K. and Park, J.H. 2000. Steaming of ginseng at
high temperature enhances biological activity. J. Nat. Prod.
63, 1702-1704.
8) Kim, K.T., Yoo, K.M., Lee, J.W,. Eom, S.H., Hwang, I.K.
and Lee, C.Y. 2007. Protective effect of steamed American
ginseng (Panax quinquefolius L.) on V79-4 cells induced by
oxidative stress.J. Ethnopharm.111, 443-450.
9) Kim, M.H., Lee, Y.C., Choi, S.Y., Cho, C.W., Rho, J.H. and
Lee, K.W. 2011. The changes of ginsenoside patterns in red
ginseng processed by organic acid impregnation pretreatment.
J. Ginseng Res.35, 497-503.
10) Liu, L., Zhu, X.M., Wang, Q.J., Zhang, D.L., Fang, Z.M.,
Wang, C.Y., Wang, Z., Sun, B.S., Wu, H. and Sung, C.K.
2010. Enzymatic preparation of 20(S,R)- protopanaxadiol by
transformation of 20(S,R)-Rg3 from black ginseng.
Phytochem. 71, 1514-1520.
11) Oh, C.H., Kim, G.N., Lee, S.H., Lee, J.S. and Jang, H.D.
2010. Effects of heat processing time on total phenolic
content and antioxidant capacity of ginseng jung kwa. J.
Ginseng Res. 34, 198-204.
12) Rafifa, H., Marek, U., Marie, P. and Miroslav, P. 2004. Assay
of phenolic compounds in red wine by on – line combination
of capillary isotachophoresis with capillary zone
electrophoresis. J. Chromatogr. A 1031, 281-287.
13) Ren, G., Zhang, X.W. and Chen, F. 2000. Predicting color
kinetics during red Asian ginseng (Panax ginseng)
preparation. Die Pharmazie55, 300-302.
14) Satoh, E., Tohyama, N. and Nishimura, M. 2005. Comparison
of the antioxidant activity of roasted tea with green, oolong,
and black teas. Int. J. Food Sci. Nutr. 56, 551-559.
15) Singleton, V.L. and Rossi, J.A. 1965. Colorimetry of total
phenolic with phosphomolybdic phosphotungstic acid
reagents. Am. J. Enol. Viticult. 16, 144-158.
16) Velioglu, Y.S., Mazza, G., Gao, L. and Oomah, B.D. 1998.
Antioxidant activity and total phenolics in selected fruits,
vegetables, and grain products. J. Agric. Food Chem. 46, 4113-4117.
17) Wang, H.L. and Xin, M. 2011. Ginseng entering foodstuff
speeds up industry molding. China Food Newspaper 426.82,
008.
18) Wong, K.H., Aziz, S.A. and Mohamed, S. 2008. Sensory
aroma from Maillard reaction of individual and combination
of amino acids with glucose in acidic conditions. Int. J. Food
Sci. Technol.43, 1512-1519.
19) Xu, B.J. and Chang, S.K.C. 2007. A comparative study on
phenolic profiles and antioxidant activities of legumes as
affected by extraction solvents. J. Food Sci. 72, S159-S166.
20) Xu, B.J., Yuan, S.H. and Chang, S.K.C. 2007. Comparative
analyses of phenolic composition, antioxidant capacity and
color of cool season legumes and other selected food legumes.
J. Food Sci. 72, S167-S177.
21) Xu, B.J. and Chen, X. 2013. Comparative studies on free
radical scavenging capacities and total phenolic contents of
whole and dehulled adlay (Coixlacryma-jobivar. Ma-yuen)
as affected by thermal processing methods. J. Food Proc.
Pres. 37, 630-636.
22) Yu, J.Z. and Ishiuchi, D.J. 1996. A study on the evaluation of
cucumber fruit crispness. China Academic Journal Electro
http://www.ijSciences.com Volume 3 – October 2014 (10)
23
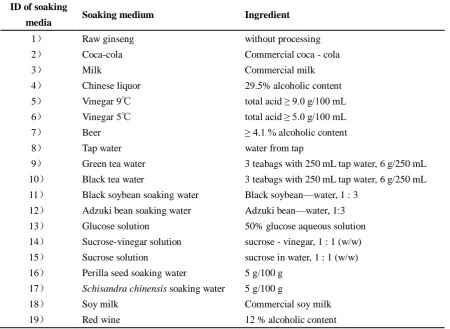
Table 1. Statement of soaking media
ID of soaking
media Soaking medium Ingredient
1) Raw ginseng without processing
2) Coca-cola Commercial coca - cola
3) Milk Commercial milk
4) Chinese liquor 29.5% alcoholic content
5) Vinegar 9℃ total acid ≥ 9.0 g/100 mL
6) Vinegar 5℃ total acid ≥ 5.0 g/100 mL
7) Beer ≥ 4.1 % alcoholic content
8) Tap water water from tap
9) Green tea water 3 teabags with 250 mL tap water, 6 g/250 mL 10) Black tea water 3 teabags with 250 mL tap water, 6 g/250 mL 11) Black soybean soaking water Black soybean—water, 1 : 3
12) Adzuki bean soaking water Adzuki bean—water, 1:3
13) Glucose solution 50% glucose aqueous solution
14) Sucrose-vinegar solution sucrose - vinegar, 1 : 1 (w/w)
15) Sucrose solution sucrose in water, 1 : 1 (w/w)
16) Perilla seed soaking water 5 g/100 g 17) Schisandra chinensis soaking water 5 g/100 g
18) Soy milk Commercial soy milk
http://www.ijSciences.com Volume 3 – October 2014 (10)
24
Results are expressed as means of three replicates. Color values marked by the same letter in same column are no
significantly different (p < 0.05)(Brightness - L, Chroma – a and b and C, Chromatism - △E, Hue - h). ID of
product Soaking media L
a b ho Chroma △E
1)
Raw ginseng 80.31±0.02 a
3.05±0.01lk 16.11±0.00h 1.38±0.0003c 16.40±0.00ij 19.32±0.01k
2) Coca-cola 70.42±0.04n 5.29±0.02d 20.23±0.01b 1.32±0.0007h 20.91±0.01b 29.90±0.03d
3) Milk 77.31±0.02g 2.96±0.01m 17.31±0.01fg 1.40±0.0003b 17.56±0.01gh 22.32±0.01h
4) Chinese liquor 76.36±0.01i 3.62±0.01i 17.40±0.01f 1.37±0.0004d 17.78±0.00g 23.23±0.00g 5) Vinegar 9℃ 78.84±0.08c 3.04±0.01lk 17.75±0.22def 1.40±0.0016b 18.01±0.22efg 21.47±0.09i 6) Vinegar 5℃ 77.85±0.01e 3.02±0.02lm 17.74±0.04def 1.40±0.0008b 18.00±0.05efg 22.20±0.02h 7)
Beer 78.20±0.03
d
3.11±0.01k 18.07±0.01cde 1.40±0.0006b 18.34±0.01ef 22.17±0.01h
8) Tap water 76.97±0.01h 3.61±0.00i 18.11±0.01cde 1.37±0.0000d 18.47±0.01de 23.20±0.01g 9) Green tea water 70.53±0.08n 3.50±0.01j 15.60±0.09i 1.35±0.0006f 15.99±0.09j 27.14±0.11f 10) Black tea water 67.32±0.35o 4.93±0.15f 15.89±1.13hi 1.27±0.0125i 16.64±1.12i 30.67±0.65b 11) Black soybean
soaking water 61.24±0.18q
7.11±0.09b 9.29±0.21k 0.92±0.0047k 11.70±0.22l 34.62±0.22a
12) Adzuki bean soaking water
70.98±0.01 m
5.70±0.01c 18.22±0.01cd 1.27±0.0005i 19.09±0.01c 28.44±0.00e
13) Glucose
solution 73.38±0.09l
5.64±0.02c 23.62±0.03a 1.34±0.0009g 24.28±0.02a 29.82±0.05d
14) Sucrose-vinegar
solution 75.20±0.13k
5.02±0.01e 23.66±0.03a 1.36±0.0005e 24.18±0.03a 28.46±0.07e
15) Sucrose
solution 77.57±0.03f
3.80±0.01h 18.45±0.01c 1.37±0.0007d 18.83±0.00cd 22.99±0.02g
16) Perilla seed
soaking water 77.92±0.02e
2.84±0.02n 16.93±0.04g 1.40±0.0006b 17.16±0.04h 21.60±0.02i
17) Schisandra chinensis
soaking water
75.64±0.05j
4.19±0.01g 15.92±0.03hi 1.31±0.0003h 16.46±0.03i 23.07±0.05g
18) Soy milk 79.14±0.15b 2.66±0.09o 17.69±0.08ef 1.42±0.0051a 17.89±0.08fg 21.16±0.13j 19) Red wine 66.77±0.16p 7.63±0.05a 12.55±0.06j 1.02±0.0010j 14.69±0.07k 30.30±0.12c
http://www.ijSciences.com Volume 3 – October 2014 (10)
25
Table 3. Texture properties of RTE flavored ginseng chips
ID of
product Soaking media Hardness (g) Crispness (g) HD
a (%)
1) Raw ginseng 1157±5.66d 1145.00±9.19d 4.35
2) Coca-cola 282.50±4.95l 280.25±5.30l 2.65
3) Milk 1233.50±30.41c 1223.00±30.41c 3.40
4) Chinese liquor 1057.00±49.50e 1046.25±47.02e 3.55
5) Vinegar 9℃ 756.00±42.43g 750.00±43.13g 4.00
6) Vinegar 5℃ 604.50±34.65i 600.50±33.94i 4.35
7) Beer 531.50±4.95j 527.50±4.95j 3.70
8) Tap water 654.00±8.49h 648.75±8.13h 4.85
9) Green tea water 672.00±12.73h 666.50±13.44h 5.10
10) Black tea water 1490.00±2.83b 1478.25±3.18b 5.25
11) Black soybean soaking water 731.00±1.41g 725.00±1.41g 3.05
12) Adzuki bean soaking water 649.00±0.00h 643.75±0.35h 2.15
13) Glucose solution 1203.50±9.19c 1193.50±9.19c 9.95
14) Sucrose-vinegar solution 1082.00±14.14e 1073.00±14.14e 9.85
15) Sucrose solution 836.00±4.24f 831.00±7.78f 10.00
16) Perilla seed soaking water 399.00±8.49k 395.75±8.13k 5.10
17) Schisandra chinensis soaking water 1142.00±19.80d 1133.00±19.80d 8.25
18) Soy milk 584.50±20.51i 580.00±20.51i 2.90
19) Red wine 1829.50±14.85a 1814.75±15.20a 3.95
Results are expressed as means of two replicates. Texture indicators values marked by the same letter in same column are no significantly different (p < 0.05).
a HD is expressed as hardness deformation.
Table 4. Total phenolic contents (TPC) and antioxidant activities of RTE flavored ginseng chips
ID of
product Soaking media
Total Phenolic Contents (mg GAE/g)
DPPH Scavenging capacities (μmol TE/g)
1) Raw ginseng 1.0±0.03h 0.6±0.03i
2) Coca-cola 1.2±0.08f 1.3±0.09h
3) Milk 0.4±0.03j 1.3±0.12h
4) Chinese liquor 0.7±0.01i 1.3±0.10h
5) Vinegar 9℃ 0.7±0.07i 1.6±0.10gh
6) Vinegar 5℃ 1.0±0.01gh 1.8±0.07gh
7) Beer 1.2±0.08f 3.1±0.21f
8) Tap water 1.2±0.06f 1.6±0.01gh
9) Green tea water 6.4±0.10a 60.9±0.99a
10) Black tea water 2.8±0.08b 15.7±1.02b
11) Black soybean soaking water 2.2±0.10d 8.1±0.27d
12) Adzuki bean soaking water 2.0±0.08e 11.7±0.00c
13) Glucose solution 1.1±0.05fg 3.2±0.04f
http://www.ijSciences.com Volume 3 – October 2014 (10)
26
15) Sucrose solution 0.7±0.02i 1.4±0.11gh
16) Perilla seed soaking water 1.2±0.01f 4.8±0.16e
17) Schisandra chinensis soaking water 0.9±0.05h 2.1±0.08g
18) Soy milk 0.9±0.05h 1.6±0.15gh
19) Red wine 2.5±0.16c 11.3±0.19c
Results are expressed as means of three replicates. Data were marked by the same letter in same column are no significantly (p < 0.05) different.
Fig. 1. Soaking time of white ginseng (results were means of three replicates)
Various food media
coca-cola milk Chinese liquor vinegar 9℃ vinegar 5℃ beer
tap water green tea water black tea water
black soybean soaking water
adzuki bean soaking water
glucose solution
red wine sucrose-vinegar solution
sucrose solution
perilla seed soaking water
Schisandra
chinensis soaking water
soy milk
Soaking and flavoring
Slicing (2-3mm thickness)
http://www.ijSciences.com Volume 3 – October 2014 (10)
27
Fig. 2. Processing technology for ready-to-eat flavored ginseng chips
A. Sliced ginseng B. Soaked ginseng
C. Steamed ginseng D. RTE flavored ginseng chips
Fig. 3. Processed ginseng products (A. Sliced ginseng; B. Soaked ginseng; C. Steamed ginseng; D. RTE flavored ginseng chips).
Pre-heating
Steaming
Freezing
Freeze drying
Vacuum packaging
http://www.ijSciences.com Volume 3 – October 2014 (10)
28
A. Texture plot of raw ginseng
B. Texture plot of red ginseng with highest load
C. Texture plot of coca-cola with lowest load