International Journal of Intelligent Information Systems
2012;1(1):1-6Published online December 30, 2012 (http://www.sciencepublishinggroup.com/j/ijiis) doi: 10.11648/j.ijiis.20120101.11
Crowd anomaly detection using standardized modeled
input
Michael E. Long
1,*, Alexander Glade
2, Kevin J. Bierre
2, Bartholomew L. Moore
31
Chester F. Carlson Center for Imaging Science, Rochester Institute of Technology, Rochester, NY, USA
2
B. Thomas Golisano College of Computing and Information Sciences, Rochester Institute of Technology, Rochester, NY, USA
3
Second Avenue Software, Inc., Pittsford, NY, USA
Email address:
[email protected] (M. E. Long), [email protected] (A. Glade), [email protected] (K. J. Bierre) [email protected] (B. L. Moore)
To cite this article:
Michael E. Long, Alexander Glade, Kevin J. Bierre, Bartholomew L. Moore. Crowd Anomaly Detection Using Standardized Modeled Input. International Journal of Intelligent Information Systems, Vol. 1, No. 1, 2012, pp. 1-6. doi: 10.11648/j.ijiis.20120101.11
Abstract: A variety of techniques exist for tracking and detection of pedestrian traffic.The “proof of concept” or the utility
of these methods is often illustrated by analysis of a video or photographs produced by the researcher as part of the devel-opment process of the algorithms.Although these images are often based on actual human subjects, they lack portability and ground truth or at best require tedious hand mapping to record ground truth.Hence, each algorithm is developed and tested for a unique situation.Consequently, as an alternative process we propose using gaming techniques to generate pedestrian and crowd like movements that readily produce ground truth referenced via data logs.For this initial study, we have used mod-ifications of the Reynolds flocking model to generate crowd like behavior.Using these algorithms and open-source software platforms, we generated reference crowds and then added individual pedestrian behavior within the simulated crowd.Various detection methods were applied to differentcrowd scenarios to explore and assess the utility of detection methods, illustrate the possibilities of this technique, and demonstrate an initial screening for a detection algorithm.Although not a final proof of a detection process, this method allows facile, rapid, and comparative initial evaluation of the methods under consideration.Keywords: Crowd Anomaly Detection, Simulated Crowd, Crowd Scenarios, and Detection Algorithm
1. Introduction
The world is replete with tragedies executed by individ-uals or small groups such as suicide bombings and assassi-nations.These acts of terrorism often result from the action of an individual in a crowd of innocent individuals.For years research in remote sensing, or sophisticated modeling and analysis techniques have attempted to assist security and law enforcement personnel in the identification of in-dividuals with possible malevolent intent [1-5].A related area has been the development of real-time sensing algo-rithms and methodology to predict when a peaceful crowd may become panicked and potentially dangerous both to its members and others [6,7].
Although it would be of interest to develop methods for rapid analysis of video orsequential images of crowds of people to determine anomalies or whena disruption to a peaceful crowd may occur, resulting in a panicked and po-tentially dangerous situation, this objective has been plagued by the complexity and diversity of the problem.There are a
variety of methods reported to address this problem that comprise approaches for crowd and individual modeling, crowd analysis, video analysis, and tracking individuals [8-11].However, what is lacking is a systematic approach and comparative evaluation of the analysis systems.
that can be used for initial, simple evaluation and compar son of analysis techniques.
2. Methodology
There has been a variety of research aimed at
crowds [12-14]. Many of the approaches have been based in on attempts to use ideas from physics, such as particle m tion [15] or the use of potential fields [16]. However, our initial proposed approach is based on the Craig Reynolds “flocking” models [17] used to generate artificial crowd scenes.These models determine the behavior of each me ber of the crowd based on the weights attached to three parameters: separation, or the value each member of the crowd places on maintaining distance from neigh alignment, the value each person places on matching the speed and direction of neighbors; and cohesion, the value the person places on staying roughly within the middle of the pack.
Because of ease of implementation and visualization, much of this work was initially done in
modifications of the ReynoldsFlocking Model included in the NetLogo package.The existing Flocking Model was modified to include a formation of a crowd or concentration of agents with a certain pattern such as a eve
circle or a bell shaped crowd with higher concentration of agents in the middle.This early work was then migrated to C# and XNA for increased programming versatility and text files of the desired scenarios were generated.
The following directional crowd scenarios
narios 1 through 3) were developed in C# for 100 agents and approximately 500 frames:
A moving directional crowd with an anomalous agent moving through the crowd in the opposite direction.
A moving directional crowd with an anomalous agent moving through the crowd in the same direction but with a different speed.
A moving directional crowd with an anomalous agent veering off from the crowd.
A scenario with a milling crowd of 100 agents with an anomalous agent moving steadily throug
also simulated.
MatLab® [19] was used for analysis of the results of the simulations.We considered eleven possible analysis tec niques.Although the exact technique is not important at this point, the different scenarios evaluated clearly demonstrated the possibility of an early, initial evaluation of techniques and the differences, strengths and weaknesses that may become even more evident in actual application.Thus a suggested path forward becomes evident.
Two basic parameters were calculated from the known position of all agents in each frame, distance and dire tion.For any given agent, their distance traveled between frame i and i+1 is given as
x
i+1−
x
i(
)
2+
(
y
i+1−
y
ithat can be used for initial, simple evaluation and
compari-There has been a variety of research aimed at modeling 14]. Many of the approaches have been based in on attempts to use ideas from physics, such as particle mo-tion [15] or the use of potential fields [16]. However, our initial proposed approach is based on the Craig Reynolds els [17] used to generate artificial crowd scenes.These models determine the behavior of each mem-ber of the crowd based on the weights attached to three parameters: separation, or the value each member of the crowd places on maintaining distance from neighbors; alignment, the value each person places on matching the of neighbors; and cohesion, the value the person places on staying roughly within the middle of the
Because of ease of implementation and visualization, inNetLogo [18] with Flocking Model included in the NetLogo package.The existing Flocking Model was modified to include a formation of a crowd or concentration of agents with a certain pattern such as a evenly distributed circle or a bell shaped crowd with higher concentration of agents in the middle.This early work was then migrated to C# and XNA for increased programming versatility and text files of the desired scenarios were generated.
ctional crowd scenarios(labeled Sce-were developed in C# for 100 agents and
A moving directional crowd with an anomalous agent moving through the crowd in the opposite direction.
an anomalous agent moving through the crowd in the same direction but with a
A moving directional crowd with an anomalous agent
A scenario with a milling crowd of 100 agents with an ly through the crowd was
MatLab® [19] was used for analysis of the results of the simulations.We considered eleven possible analysis tech-niques.Although the exact technique is not important at this
clearly demonstrated the possibility of an early, initial evaluation of techniques and the differences, strengths and weaknesses that may become even more evident in actual application.Thus a
d path forward becomes evident.
e calculated from the known position of all agents in each frame, distance and direc-tion.For any given agent, their distance traveled between
.
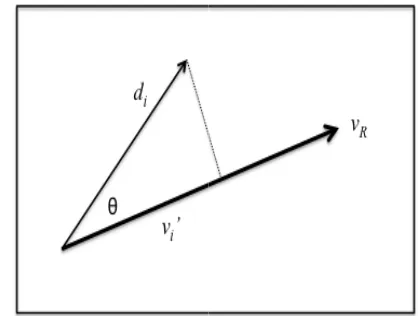
The agent’s direction in radians was determined from a four-quadrant arctangent function.Since the frame rate is the same for all steps, speed is essentially the distance covered per frame.The agent’s relative velocity,
versus the directional reference vectors of neighboring agents or the crowd as a whole using the dis
the cosine of the angle, θ, subtended by the agent’s direction and the reference vector, vR as illustrated in Fig. 1.
Figure 1. Calculated Agent Velocity, v
The analysis techniques used for tion are:
Agent Direction – the direction in radians of each agent
averaged over frames
Agent Speed – the speed
frames
Velocities - the velocity of
frames
k-Nearest Neighbors –for eac
agents within a certain distance averaged over frames
Average k–Neighbor Distance
between each agent and their k over frames
Relative Speed kDistance
ative to all agents within kDistance averaged over frames
Relative Direction kDistance
agent relative to the direction of agents within kDistance averaged over frames
Relative Velocity kDistance
relative to the velocity of agents within kDistance averaged over frames
Relative Speed kNN - the speed of each agent relative to
the average speed of k-Nearest Neighbor agents averaged over frames
Relative Direction kNN
relative to the direction of k raged over frames
Relative Velocity kNN - the velocity of each agent rel
tive to the velocity of k-Nearest Neighbor agents averaged over frames
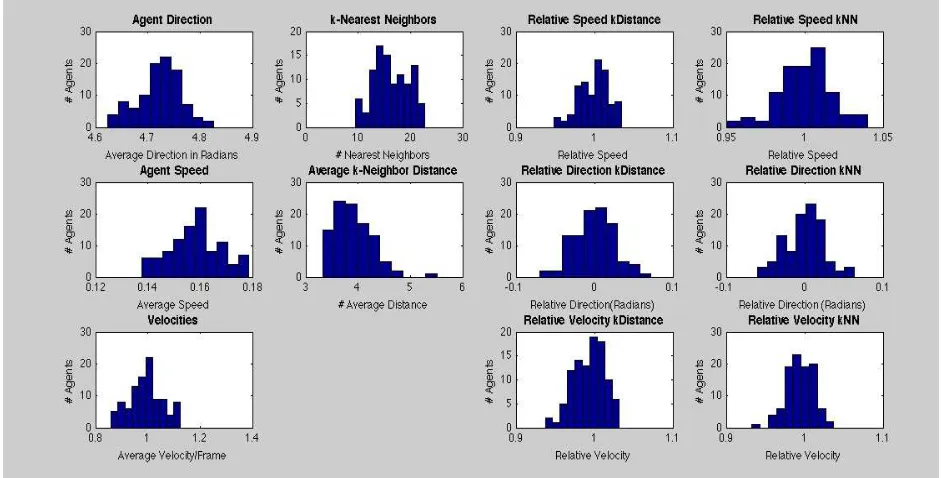
A histogram of the response of all agents for each of the 11 above analysis techniques was then generated.
i
)
2
The agent’s direction in radians was determined from a ction.Since the frame rate is the same for all steps, speed is essentially the distance covered per frame.The agent’s relative velocity, vi’ was calculated versus the directional reference vectors of neighboring agents or the crowd as a whole using the distance, di, times
θ, subtended by the agent’s direction as illustrated in Fig. 1.
Calculated Agent Velocity, vi’, Relative to Reference Velocity vR.
The analysis techniques used for evaluation
demonstra-the direction in radians of each agent
of each agent averaged over
the velocity of each agent averaged over
for each agent, the number of agents within a certain distance averaged over frames
Neighbor Distance – the averaged distance
between each agent and their k–Nearest Neighbors averaged
Relative Speed kDistance – the speed of each agent
rel-ve to all agents within kDistance arel-veraged orel-ver frames
Relative Direction kDistance - the direction of each
agent relative to the direction of agents within kDistance
Relative Velocity kDistance - the velocity of each agent
the velocity of agents within kDistance averaged
the speed of each agent relative to Nearest Neighbor agents averaged
- the direction of each agent direction of k-Nearest Neighbor
agentsave-the velocity of each agent rela-Nearest Neighbor agents averaged
International Journal of Intelligent Information Systems 2012; 1(1): 1-6 3
3. Results
Figures 2 through 5 show the analysis histograms from the simulations of the Directional Crowd Scenario #3 and
the Milling Crowd Scenario.Similar results were achieved for simulations of the directional crowd, Scenarios 1 and 2, but not shown here.All analysis results are summarized in Table 2.
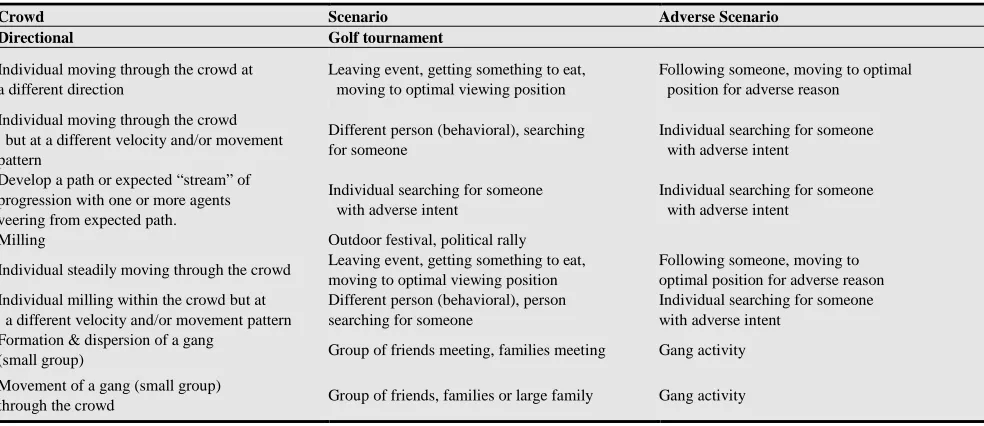
Table 2. Identification of Crowd Anomaly Scenario as a Function of Detection Method.
Directional Crowd Milling Crowd
Detection Algorithm Scenario #1 Scenario #2 Scenario #3
Agent Direction ✔ ✔
Agent Speed ✔ ✔ ✔
Velocities ✔ ✔ ✔ ✔
k-Nearest Neighbors ✔ ✔
Average k– Neighbor Distance ✔
Relative Speed kDistance ✔
Relative Direction kDistance ✔ ✔
Relative Velocity kDistance ✔ ✔ ✔
Relative Speed kNN ✔ ✔ ✔
Relative Direction kNN ✔ ✔ ✔
Relative Velocity kNN ✔ ✔ ✔ ✔
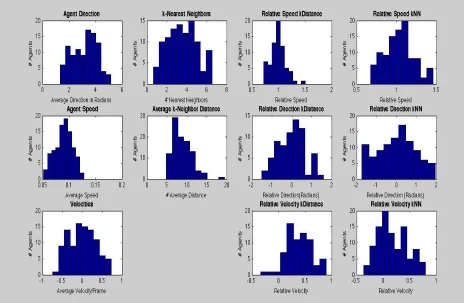
The comparison of Fig. 2 (Directional Crowd, No Ano-maly) with Fig. 3 (Directional Crowd, Veering Anomaly, Scenario 3) demonstrates the promise of this simple, pre-liminary technique.Here, the difference between the histo-grams of Agent Direction, Velocities, k-Nearest Neighbors, Average k-Neighbor Distance, Relative Direction kDistance, Relative Velocity kDistance, Relative Direction kNN, and Relative Velocity kNN is apparent.For instance, the histo-grams in Fig. 2 and Fig. 4 with no anomalies are relatively symmetric with few or no definitive outliers
visi-ble.However, the histograms in Fig. 3 and Fig. 5 for the Directional Crowd and Milling Crowd with anomalies, respectively, demonstratively show the disruption of sym-metry and increased outliers.
Similar analysis can be done for the Milling Crowd sce-nario illustrated in Fig. 4 and Fig. 5.Here the histograms of Agent Speed, Velocities, k-Nearest Neighbors, Relative Speed kNN, Relative Direction kNN, and Relative Velocity kNN show promise.
Figure 3. Directional Crowd, Scenario 3, With Anomaly.
International Journal of Intelligent Information Systems 2012; 1(1): 1-6 5
Figure 5. Milling Crowd, With Anomaly.
Of course, the purpose is not to demonstrate the utility of these anomaly identification routines, but to demonstrate the possibility of using this simple gaming technique to generate data sets for initial evaluationof anomaly detection me-thods.For instance, consider the summary results of Table 2.It is indicated that the three velocity algorithms show promise across all considered scenarios.Hence, these might be the first considered for evaluation on more sophisticated data sets, if these were expected scenarios.Going a step further, each method under evaluation might have particular strengths and weaknesses such as algorithm complexity, hardware requirements and overhead, response time, track-ing requirements, etc. Furthermore, if less demandtrack-ing or universal scenarios are expected, then initial evaluation of simpler algorithms may be warranted. Consequently, through the use of the preliminary evaluation presented here, these issues can be considered and assessed.
4. Summary
It has been shown that the use of historic gaming tech-niques for generating crowds and anomalies therein to pro-vide reference data sets shows promise as an initial evalua-tion and comparison technique for anomalydetecevalua-tion algo-rithms. Furthermore, the preliminary evaluation method proposed here allows simultaneous direct comparison of multiple methods of anomaly detection.
This initial work can be followed by the development of a more sophisticated model simulating the movement of rea-listic humanistic 3D agents.A program such as Unity [20] could be used to develop models depicting objects with human characteristics and body movement [21].Also other scenarios, such as the “gang” scenario depicted in Table 1 can be evaluated.
Table 1. Taxonomy of Crowd Anomalies or Adverse Behavior.
Crowd Scenario Adverse Scenario
Directional Golf tournament
Individual moving through the crowd at a different direction
Leaving event, getting something to eat, moving to optimal viewing position
Following someone, moving to optimal position for adverse reason
Individual moving through the crowd but at a different velocity and/or movement pattern
Different person (behavioral), searching for someone
Individual searching for someone with adverse intent
Develop a path or expected “stream” of progression with one or more agents veering from expected path.
Individual searching for someone with adverse intent
Individual searching for someone with adverse intent
Milling Outdoor festival, political rally
Individual steadily moving through the crowd Leaving event, getting something to eat, moving to optimal viewing position
Following someone, moving to optimal position for adverse reason Individual milling within the crowd but at
a different velocity and/or movement pattern
Different person (behavioral), person searching for someone
Individual searching for someone with adverse intent
Formation & dispersion of a gang
(small group) Group of friends meeting, families meeting Gang activity
Movement of a gang (small group)
Acknowledgements
We wish to thank Captain Steven Siena and Deputy Chief Glenn Hoff for review and suggestions of the crowd ano-maly scenarios depicted in this publication.
References
[1] E. L. Andrade, S. Blunsden, and R. B. Fisher, “Modelling crowd scenes for event detection,” in 18th International Conference on Pattern Recognition, 2006. ICPR 2006, vol. 1, pp. 175–178.
[2] A. B. Chan, Z. S. J. Liang, and N. Vasconcelos, “Privacy preserving crowd monitoring: Counting people without people models or tracking,” in Computer Vision and Pattern Recognition, 2008. CVPR 2008. IEEE Conference on, 2008, pp. 1–7.
[3] D. Y. Chen and P. C. Huang, “Dynamic human crowd mod-eling and its application to anomalous events detection,” in Multimedia and Expo (ICME), 2010 IEEE International Conference on, pp. 1582–1587.
[4] V. Mahadevan, W. Li, V. Bhalodia, and N. Vasconcelos, “Anomaly detection in crowded scenes,” in Computer Vision and Pattern Recognition, IEEE Computer Society Confe-rence on, Los Alamitos, CA, USA, 2010, vol. 0, pp. 1975–1981.
[5] T. Hospedales, J. Li, S. Gong, and T. Xiang, “Identifying Rare and Subtle Behaviours: A Weakly Supervised Joint Topic Model,” Pattern Analysis and Machine Intelligence, IEEE Transactions on, no. 99, pp. 1–1.
[6] D. Helbing, A. Johansson, and H. Z. Al-Abideen, “Dynamics of crowd disasters: An empirical study,” Physical Review E, vol. 75, p. 7), 2007.
[7] M. Moussaïd, D. Helbing, and G. Theraulaz, “How simple rules determine pedestrian behavior and crowd disasters,” Proceedings of the National Academy of Sciences, Apr. 2011.
[8] B. Zhan, D. Monekosso, P. Remagnino, S. Velastin, and L.-Q. Xu, “Crowd analysis: a survey,” Machine Vision and Applications, vol. 19, no. 5, pp. 345–357, 2008.
[9] V. Chandola, A. Banerjee, and V. Kumar, “Anomaly
detec-tion: A survey,” ACM Comput. Surv., vol. 41, no. 3, pp. 15:1–15:58, Jul. 2009.
[10] J. C. S. Jacques Junior, S. R. Musse, and C. R. Jung, “Crowd Analysis Using Computer Vision Techniques,” Signal Processing Magazine, IEEE, vol. 27, no. 5, pp. 66–77, 2010. [11] M. Rodriguez, J. Sivic, I. Laptev, and J.-Y. Audibert, “Da-ta-driven crowd analysis in videos,” in 2011 IEEE Interna-tional Conference on Computer Vision (ICCV), 2011, pp. 1235–1242.
[12] D. Helbing, L. Buzn, A. Johansson, and T. Werner, “Self-Organized Pedestrian Crowd Dynamics: Experiments, Simulations, and Design Solutions,” Transportation Science, vol. 39, no. 1, p. 24, 2005.
[13] R. Mehran, A. Oyama, and M. Shah, “Abnormal crowd behavior detection using social force model,” in IEEE Con-ference on Computer Vision and Pattern Recognition, 2009. CVPR 2009, pp. 935–942.
[14] J. M. Usher and L. Strawderman, “Simulating operational behaviors of pedestrian navigation,” Computers & Industrial Engineering, vol. 59, no. 4, pp. 736–747, Nov. 2010. [15] L. Heïgeas, A. Luciani, J. Thollot, and N. Castagné, “A
physically-based particle model of emergent crowd beha-viors,” arXiv preprint arXiv:1005.4405, 2010.
[16] A. Treuille, S. Cooper, and Z. Popović, “Continuum crowds,” in ACM Transactions on Graphics (TOG), 2006, vol. 25, pp. 1160–1168.
[17] C. W. Reynolds, “Flocks, herds and schools: A distributed behavioral model,” in ACM SIGGRAPH Computer Graph-ics, 1987, vol. 21, pp. 25–34.
[18] U. Wilensky, (1999). Center for Connected Learning and Computer-Based Modeling, Northwestern University
[on-line]. 1999. Available at:
<http://ccl.northwestern.edu/netlogo/.
[19] MATLAB (Version 2010b) [Computer Software]. Natick, MA, USA: The Mathworks.
[20] Unity [Computer Software]. San Francisco, CA, USA: Uni-ty Technologies.