World Maritime University
The Maritime Commons: Digital Repository of the World
Maritime University
World Maritime University Dissertations
Dissertations
2000
Mergers in liner shipping : strategic options
available to Indian shipping
Rajnish Khandelwal
World Maritime UniversityFollow this and additional works at:
http://commons.wmu.se/all_dissertations
Part of the
Strategic Management Policy Commons
This Dissertation is brought to you courtesy of Maritime Commons. Open Access items may be downloaded for non-commercial, fair use academic purposes. No items may be hosted on another server or web site without express written permission from the World Maritime University. For more
Recommended Citation
Khandelwal, Rajnish, "Mergers in liner shipping : strategic options available to Indian shipping" (2000).World Maritime University Dissertations. 306.
WORLD MARITIME UNIVERSITY
Malmö, Sweden
Mergers in Liner Shipping:
Strategic Options Available to Indian Shipping
By
RAJNISH KHANDELWAL
India
A dissertation submitted to the World Maritime University in partial
fulfilment of the requirements for the award of the degree of
MASTER OF SCIENCE
in
SHIPPING MANAGEMENT
2000
Declaration
I certify that all the materials in this dissertation that is not my own work has been identified, and that no material is included for which a degree has previously been conferred on me.
The contents of this dissertation reflect my own personal views, and are not necessarily endorsed by the university.
……….. (Signature)
……….. (Date)
Supervised by: Tor Wergeland Associate Professor Shipping Management World Maritime University.
Assessor: David J Mottram Adjunct Professor
Former Professor Shipping Management World Maritime University.
Co-Assessor:
Christian Gyntelberg
Acknowledgements
I owe gratitude and sincere thanks to all those who have given me encouragement, guidance and support in the completion of this dissertation.
I am grateful to my employer, The Shipping Corporation of India Ltd. for nominating me, and IMO-Norway Technical Co-operation Programme Fellowships, for sponsoring my studies here.
At the World Maritime University, I’m indebted to my supervisor, Prof. Tor Wergeland, for his guidance and support in the completion of this dissertation.
I’m also obliged to my course professor Prof.S.Ma, for the support accorded in preparation of this document. Special thanks for the dedicated and helpful library staff, who have always been a valuable source of help when, needed the most.
I bestow sincere thanks to my beloved wife, for the inspiration and encouragement she has provided me in my thought process during my stay at Malmö. Her influence in this study has been much greater than she could ever know.
Abstract
Title of Dissertation: Mergers in Liner Shipping – Strategic options available to Indian Shipping.
Degree: MSc.
This dissertation is a study of the spate of mergers taking place in the liner shipping industry and the options these leave for a small operator the size of ‘The Shipping Corporation of India Limited.’
A brief look has been taken at the measures liner operators have been taking to overcome the poor earnings from this industry. The evolution of the conference system and the global alliances has been examined here.
The liner industry has witnessed a number of mergers recently, and the motive driving these mergers and the rationalisation that has come to the industry has been looked into. Additionally case studies of three major mergers have also been presented for benchmarking purposes. A mention of major trends that are currently affecting the industry has also been made.
The dissertation is to propose a business strategy for Indian liner companies, hence the Indian scenario has been studied. Current status of the sole Indian operator, SCI has also been analysed with emphasis on the capability of the company to continue in the turbulent times in which many companies have given up. Options available to SCI have thus been evaluated and a course of action is proposed.
Table of Contents
Declaration ii
Acknowledgements iii
Abstract iv
Table of contents v
List of Tables vi
List of Figures vii
List of Abbreviations viii
1. Introduction 1
2. Co-operation schemes in liner shipping 2.1 Conferences
2.2 Consortia 2.3 Alliances
4 7 8
3. Mergers and Acquisitions 3.1 Case-Studies
3.1.1 P&O – Royal Nedlloyd
3.1.2 Neptune Orient Lines – American President Lines 3.1.3 Maersk Line – Sealand
3.2 Forces acting behind the mergers 3.3 The other face of mergers
3.4 How long will it last
12 14 14 15 17 18 22 23
4. Global Trends
4.1 Current forces affecting liner shipping 4.2 Futuristic market forces
5. Indian Scenario
5.1 Development of trade and fleet
5.2 The Shipping Corporation of India Ltd. 5.2.1 Liner operations
38 41 43
6. Business options before SCI 6.1 Business portfolio Matrix 6.2 Options available
6.2.1 Niche operator 6.2.2 Growth strategy 6.2.3 Join Alliance 6.2.4 Merger
47 49 49 53 57 59
7. Conclusion & Recommendations 7.1 An economic evaluation of options 7.2 Fleet
7.3 Containers 7.4 Marketing 7.5 Talent 7.6 Terminals 7.7 Agency 7.8 Systems
62 65 68 69 72 72 73 75
List of Tables
Page
Table 2.1 Alliances in Liner Shipping 10
Table 3.1 Mergers and Acquisitions in Liner Shipping since 1996 13
Table 3.2 Estimated Cost Savings -- P&O/Nedlloyd 15
Table 3.3 Estimated Cost Savings—NOL/APL 16
Table 3.4 World’s Top Ten Liner Operators 25
Table 4.1 Estimated and Forecast Average Unit Rate, East-West Market 30
Table 4.2 Generations of Containerships 31
Table 4.3 Mega Containership Specifications 32
Table 5.1 Share of Indian Lines in India’s Overseas Trade 39
Table 5.2 Indian Tonnage Profile as on 1.01.2000 40
Table 5.3 Share of Indian Lines in India’s Overseas Liner Trade 43
Table 6.1 Invasion and Destruction of Niche Markets 52
Table 7.1 World Container Fleet Ownership Structure
- Actual and Forecast
List of Figures
Page
Figure 3.1 Economies of Scale in Container Shipping 20
Figure 3.2 Scope of Financial Benefits Accruing from Carrier Integration 21
Figure 5.1 SCI’s Fleet Composition 42
Figure 6.1 SCI’s Liner Business Portfolio Matrix 47
Figure 6.2 Multiple Options before SCI 49
Figure 6.3 Strategic Advantage 51
Figure 6.4 Major International Liner Routes 54
Figure 7.1 Howe Robinson Containership Charter Index 67
Figure 7.2 Advantage accruing from different Agency Set-ups 74
List of Abbreviations
ANZDL Australia New Zealand Direct Line
B-2-B Business to business
Cb Block Co-efficient
Cif Cost Insurance Freight
Cosco China Oceanic Shipping Company.
CP Ships Canadian Pacific Ships
CRM Customer Relationship Management
DWT Dead weight tonne
Fob Free on board
GATT General Agreement on Trade and Tariffs
INSA Indian National Shipowners Association
IPBC India Pakistan Bangladesh Ceylon
IT Information Technology
Kn Knots
Loa Length overall
Lpp Length between perpendiculars
Lwl Length at water level
MCR Maximum continuous rating
MSC Mediterranean Shipping Company
NYK Nippon Yusen Kaisha
OOCL Orient Overseas Container Lines
SCI The Shipping Corporation of India Limited
TEU Twenty Equivalent Unit
THC Terminal handling charges
UASC United Arab Shipping Company.
UN United Nations
Vship Velocity of ship
1.
Introduction
“Container shipping is like a poker game - you just have to keep putting more and more money on the table which you are about to lose."
Late Sir Y-K Pao, one time chairman of World Wide Shipping.1
A key feature of liner business has been capacity management. From an economic view point, what makes this form of business different from bulk shipping is, in liner shipping there is an obligation to stick to a timetable, which makes capacity inflexible. While in tramp, owners can respond quickly to supply/demand imbalances by moving their least efficient ships to lay up, a liner company has to keep up with its schedules and has to run its vessels to stick to the schedule, no matter even if the vessels are moving empty. This inflexibility does not leave any leeway for the liner operator when there is a seasonal variation in cargo in some trade routes.
Another aspect of liner business has been the problem of pricing. Since the liner market has a huge fragmented customer base, it is not practicable for operators to negotiate rates for each consignment, which is not a problem in the tramp sector where the customers are big in size and shipowners move from trade to trade negotiating rates with each customer.
These two limitations, inflexible capacity and fixed prices have always dominated the liner industry. Revenues have been highly volatile, with cash flows frequently affected by trade cycles, seasonal cycles and trade imbalances. Industry operating profits never exceeded 6 percent in the last decade2 and there are very few liner
operators who have been able to produce consistent, acceptable levels of
profitability. To quote Ray Miles, CEO of CP Ships, twelve of the top twenty container lines suffered losses in 1998, while seven made insufficient profits and just one (CP Ships) made a satisfactory return.2 This phase of dismal returns has driven
away a number of established players from this business.
In order to have a stream of positive revenues, operators have been trying to influence the market forces. There has been array of experiments with some focussing on the revenue side by fixing prices for the transportation, while others tackling capacity by fixing up trade shares so that companies do not compete for each other’s cargo. One obvious strategy for this has been the formation of cartels and liner shipping has such co-operation schemes known as ‘Conferences’. In addition to the conference system, liner operators have also learnt the art of making friends with enemies, and competitors have worked together in the form of consortia and alliances as discussed in chapter 2 of this dissertation.
When the alliances were not able to result in desired savings, the industry witnessed weaker players surrendering to the more ambitious ones and thus started the era of mergers and acquisitions. Chapter 3 discusses this form of consolidation that the industry has witnessed in the last few years.
Chapter 4 takes a look at the current trends that have affected liner shipping in the recent past, and what is in hold for the future.
Since the dissertation is to find out a future course of action for Indian liner companies, Chapter 5 is an introduction to Indian companies in this business and the role played by those in the international arena. This chapter takes a look at The Shipping Corporation of India (SCI), which is the only Indian company having a presence in the international liner business today.
With the industry witnessing a number of takeovers, and the liner business not giving adequate returns to SCI, it becomes imperative to assess the options
available to the company to overcome the turbulence. An analysis of the options available before SCI is, therefore, discussed at chapter 6.
2.
Co-operation schemes in liner shipping
2.1 Conferences
The advent of steam ships brought a new dimension in shipping as it enabled operators to offer fixed sailing schedules, which they were not able to do with sail boats earlier, as those depended upon weather conditions. Steam ships had greater cargo handling capacity, and at the same time required less sailing days. This coupled with the opening of the Suez-canal in 1869 meant a high increase in cargo carrying capacity of the world merchant fleet. Unfortunately, the trade could not keep pace with the growing capacity, and the result was surplus tonnage on most trade routes. Operators, in a bid to attract customers resorted to rate cutting and freight rates soon came down to the level of direct operating costs. This was murderous and the only way shipowners’ could get over it was to join hands. The result was an association of shipping lines operating on the UK-Calcutta route formed in 1875, which was the first shipping conference.1
Before the conference system there was absolutely no regulation of prices, as the customer base was big and operators negotiated different rates with different shippers. The conference system was, therefore, a very helpful alternative in this industry as it established freight by limiting rate wars, and permitting a regular and steady service. These were basically associations of mutually competitive liner operators, maintained for the purpose of controlling competition among their members, and for strengthening those members through co-operative action in their competitive fight against non-member carriers.
In order to achieve the objective of controlling competition, the conferences adopted a series of measures as follows:
• Price fixation.
• Restriction on membership.
• Pooling arrangements - cargo and revenue pools.
• Active enforcement of conference agreements.
These arrangements were not received co-ordially by both shipowners and shippers alike. Small operators who were not admitted to the conference system due to limited membership were the first to come out in opposition to this system. And as the conference system set uniform rates regardless of the size of shippers, the big ones started to complain as they had a long lasting relationship with their carriers, which offered them discounted freights. These shippers turned to non-member liners, which shipped their cargo at lower rates. Conference lines, in order not to lose big regular customers, had to offer rebates on the conference rates to these customers and thus started the trend of offering rebates on conference rates. In order to satisfy big customers, schemes like the deferred rebate system and the dual contract rate have been devised in the past. These ensured that the conferences were market responsive, i.e. meeting the changing needs of the shippers and at the same time remaining an effective tool of managing freight rates.2
Liner conferences with typically closed membership were explicitly designed to limit competition among shipowners thereby creating a structure with the characteristics of a cartel. These are, however, exempted from anti-trust legislation as there has been broad consensus that liner shipping is an important facilitator of international trade and conferences are necessary to ensure the regularity, reliability and frequency of services. On a global scale, conferences have been regulated by the ‘UNCTAD Code of Liner Conferences’, which came into force in 1983. The anti-trust exemption has been the bone of contention for the shippers council, which has been trying at all forums to abolish this privilege enjoyed by the conferences.
Conferences, it should be mentioned here, operate within strict regulatory guidelines. An example of this, is the European Union framework which allows conferences to fix rates for the ocean leg of transportation of goods only. Operators in multimodal transport cannot have an agreement on tariffs for the inland leg of the transportation network, and any agreement on the same runs the risk of attracting huge penalties running into a high percentage of the operator’s revenues.
In modern times, the role played by conferences is unfortunately reduced and these have degenerated into bodies meant to fix tariffs. Tariff setting was the major function of conferences in the past and member companies stuck to these rates thereby ensuring some credibility to this set-up. However, the advent of containerisation, among other things made shipping companies offer differential rates as per the needs of individual customers and shipping companies, in practice consider conference rates as indicative rates only. While conferences have been becoming inactive over the years the death knell has been sounded by the ‘Ocean Shipping Reforms Act’ implemented in the USA last year. Shipping conferences earlier had to disclose the terms of contract specifying rates its member companies charge shippers, and in similar fashion non-conference liner companies had to file the rates with the Federal Maritime Commission. OSRA 1998, however, allows shipping companies to enter into confidential contracts with shippers. This means, while everybody has access to know about the details of contract between the shipper and the shipowner earlier, it is no longer public information. Nobody can know how much a shipping company charges its shippers, and hence the tariff fixation holds no meaning.3
Thus, the question now is what does a conference do? While there still exist big conferences on the main trade routes, critics say the death knell has already been sounded. As commented by Gunter Casjens, Ceo Hapag Lloyd4 “Conferences have
ceased to exist because basically their main purpose of agreeing collectively on rates is not being done anymore”.
2.2 Consortia
While conferences were very affective tool of bringing discipline to the liner industry in the early days, the advent of containerisation necessitated further co-operation within companies. One of the important consequences of containerisation was the increased capital intensity of liner industry. Containerisation led to the development of the hub-and-spoke system, which required high capacity and high frequency on the main trade routes. A weekly service on any of the Far-East - Europe, Far East-USA, Europe - USA sector requires at least 8 to 12 vessels. A weekly service for Asia-Europe for example, would require at least eight post-panamax carriers and 3 sets of containers per vessel. This entails an investment of about US$750 mn for just one string (estimated at US$65 mn per vessel and US$1,500 per container). And that is not the end, as given the strong growth pattern larger vessels would be required to meet the additional cargo volume in the future. Shipowners, therefore, would be faced with a task of replacing their fleet every 5-10 years, which means more money again. Unfortunately, the track record of profitability in liner shipping has been so low in the past that no shipowner dares to put in so much money into such a venture.
Shipowners, therefore, experimented with different degrees of co-operation within competing companies, depending upon the requirements of individual routes and an individual company’s position therein. Some successful forms of co-operations have been
• Slot Purchase
• Slot Sharing
• Vessel Sharing Agreements
• Joint Services
allocation that was proportionate to its own input, on each vessel running in the pool. With several strings in operation, carriers were thus in a position to offer a wider range of services than before. Apart from benefiting due to economies of scale, carriers were also able to restrict competition by raising barriers to entry.
Consortia remained as the most successful form of agreement between liner companies until 1990-91, when one of the major consortia on the east-west route of Trio, Scandutch and Ace group broke up.5 This left liner companies to operate
individually, once again, after having tasted the benefits of offering services in collaboration with others. What followed was a period of experimentation, until the novel concept of ‘alliances’ was launched in the mid-nineties.
2.3 Alliances
One of the major limitations of consortia was that it operated only on a specific trade route. The industry needed closer partnerships and it was difficult to find a stable relationship that could have led to substantial cost savings. To make substantial savings, the co-operation had to be extended beyond mere vessel sharing on one single route. This resulted in the birth of the alliances in May 1994, when four of the world’s major liner operators viz. American President Lines (APL), Orient Overseas Container Liner (OOCL), Mitsui OSK Lines (MOL) and Royal Nedlloyd announced the formation of the Global Alliance. This was a pioneering co-operation on a much larger scale and other companies rightly accepted this concept which was there to stay in the industry. Close on the heels of the Global Alliance, three other major alliances were immediately formed involving 12 of the 20 major liner companies, and the industry had never seen agreements on this scale earlier6.
As against earlier forms of collaboration, which were trade specific, the alliances covered more than one trade lane extending to global coverage. The alliances came as a succour to the depleting fortune of liner companies as freight rates were hardly increasing in real terms (in the long term), which put pressure on companies to cut
down on costs. Although the earlier forms of co-operation were formed with the objective of cutting down costs, those basically shared ship related costs only i.e. operating, voyage or capital. These shared costs constitute only 30 percent of the total cost to the shipowner. Thus the responsibility of putting a tab on the remaining 70 percent was still on the individual shipowner. This huge chunk of 70 percent cost could be shared by having a greater degree of co-operation, and the alliance concept was born to address this issue only7. Alliances have successfully managed
to bring some of these cost heads into the ambit of co-operation.
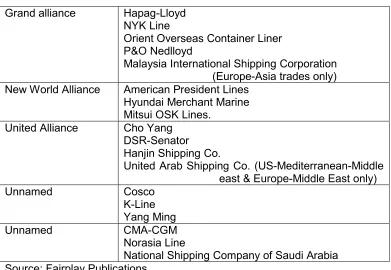
The alliances were intended to be long-term ventures and companies seemed to work in tandem until 1996, when the troubled liner divisions of P&O and Royal Nedlloyd, members of the Grand and Global alliance respectively, decided to merge. While this sparked off a realignment of membership within the alliance, the matter got confounded later when Neptune Orient Lines, then a member of Grand alliance, took over APL, a member of the Global Alliance. A round of musical chairs ensued thereafter and there have been a number of changes since 1996. Major alliances in operation today are at Table 2.1.
Table 2.1
Alliances in Liner Shipping
Grand alliance Hapag-Lloyd NYK Line
Orient Overseas Container Liner P&O Nedlloyd
Malaysia International Shipping Corporation (Europe-Asia trades only) New World Alliance American President Lines
Hyundai Merchant Marine Mitsui OSK Lines.
United Alliance Cho Yang DSR-Senator Hanjin Shipping Co.
United Arab Shipping Co. (US-Mediterranean-Middle east & Europe-Middle East only) Unnamed Cosco
K-Line Yang Ming Unnamed CMA-CGM
Norasia Line
National Shipping Company of Saudi Arabia Source: Fairplay Publications
Liner companies have been trumpeting in public about the advantages of less investment in tonnage and even boxes and chassis accrued by being in an alliance. However, the alliances have their own set of disadvantages, the most prominent being the problem of setting up realistic sailing schedules acceptable to individual carriers. It is very difficult to arrive at a common schedule which would be acceptable and of benefit to members disparate in size and functioning, and coming from different countries which means each has a different set of priorities. Arriving at a consensus is more difficult on matters concerning tonnage to be deployed or ordered, port rotation, frequency, joint use of terminals, and freight policies. Lines have candidly complained of alliances entailing time-consuming meetings, slow decision making, bureaucracy and looking too much inward8. It may be highlighted
here that it is not necessary to be in an alliance for achieving cost savings as three of the world’s five largest companies, Maersk-Sealand (from end 1999), Evergreen and Mediterranean Shipping Company operate independently outside any alliance9.
The alliances have long-term agreements of ten years, but it was the same for the earlier alliances too, which did not last half that period even. It is feared that the ongoing phase of consolidation in liner shipping may see another cross alliance merger which will trigger off the round of musical chairs again.
3.
Mergers and Acquisitions
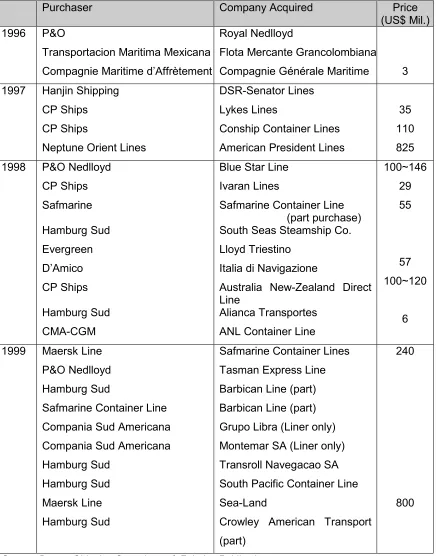
Table 3.1
Mergers and Acquisitions in Liner Shipping since 1996
Purchaser Company Acquired Price
(US$ Mil.) 1996 P&O
Transportacion Maritima Mexicana Compagnie Maritime d’Affrètement
Royal Nedlloyd
Flota Mercante Grancolombiana Compagnie Générale Maritime 3 1997 Hanjin Shipping
CP Ships CP Ships
Neptune Orient Lines
DSR-Senator Lines Lykes Lines
Conship Container Lines American President Lines
35 110 825
1998 P&O Nedlloyd CP Ships Safmarine Hamburg Sud Evergreen D’Amico CP Ships Hamburg Sud CMA-CGM
Blue Star Line Ivaran Lines
Safmarine Container Line (part purchase) South Seas Steamship Co. Lloyd Triestino
Italia di Navigazione
Australia New-Zealand Direct Line
Alianca Transportes ANL Container Line
100~146 29 55 57 100~120 6
1999 Maersk Line P&O Nedlloyd Hamburg Sud
Safmarine Container Line Compania Sud Americana Compania Sud Americana Hamburg Sud
Hamburg Sud Maersk Line Hamburg Sud
Safmarine Container Lines Tasman Express Line Barbican Line (part) Barbican Line (part) Grupo Libra (Liner only) Montemar SA (Liner only) Transroll Navegacao SA South Pacific Container Line Sea-Land
Crowley American Transport (part)
240
800
3.1 Case studies
The largest of all mergers were between P&O and Nedlloyd, NOL and APL and Maersk and Sealand, highlights of which are as follows:
3.1.1 P&O – Royal Nedlloyd
The merger of liner operations of the English company P&O with the Dutch operator Royal Nedlloyd, announced in September 1996, was one of the first major take-overs in the liner industry in the recent past. This merger sent tremors across the liner industry as both companies were members of competing alliances. The well thought out alliances planned for the long-term were just a year old, and this merger was to make the whole exercise start once again.
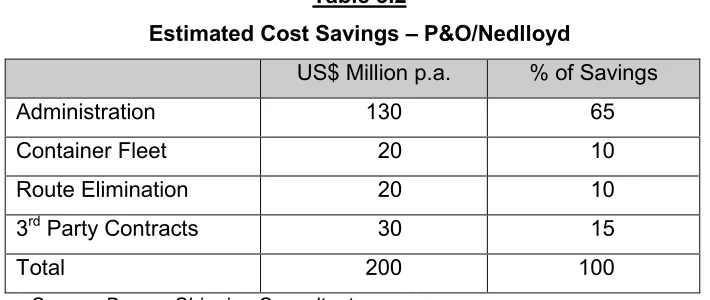
The merged entity P&O Nedlloyd controlled a total of 112 vessels with a standing slot capacity of 224,000 TEU, and some 540,000 containers. The two companies had a combined turnover of nearly US$ 4 bn and net assets value of US$ 1.5 bn1. It was a merger in the true sense as both companies were equal owners of the new entity and the new board equally represented both. Although there were some major service overlaps, the combined entity covered virtually all the main trade routes in the world. Both companies made quite a fanfare about the savings of US$ 100 per teu that would result from the merger. The majority of these savings were to come from the elimination of 1,400 positions around the world, which were about 15 percent of the combined work force of both the companies. Details of the synergy expected from the merger are seen in Table 3.2.
Table 3.2
Estimated Cost Savings – P&O/Nedlloyd
US$ Million p.a. % of Savings
Administration 130 65
Container Fleet 20 10
Route Elimination 20 10
3rd Party Contracts 30 15
Total 200 100
Source: Drewry Shipping Consultants
Synergies were achieved without any major hiccups and P&O Nedlloyd declared that the new entity made a saving of over US$ 200 mn in the first year of operation. However, merging the two entities was not an easy task and the company incurred a one-off restructuring cost of US$ 104 mn, which wiped off a substantial part of the savings incurred from the merger in the first year.2 The company’s 1997 annual report claimed that ‘P&O Nedlloyd largely retained the customer base of its two constituent companies’. P&O has definitely benefited from the merger, as it is the third largest operator in the world today, a position it would have had difficulty in achieving had it continued on its own.
3.1.2 Neptune Orient Lines – American President Lines
The take-over of APL by the Singaporean national carrier, NOL in November 1997 was surprising as APL was ranked higher than NOL in the container operator rank list. Although everyone knew APL was up for sale and there had been rumours floating around about P&O Nedlloyd and then Hapag Lloyd showing interest in APL, nobody expected NOL to clinch a deal so soon3. Industry watchers were surprised at the stars and striped Goliath being taken over by an operator smaller in size.
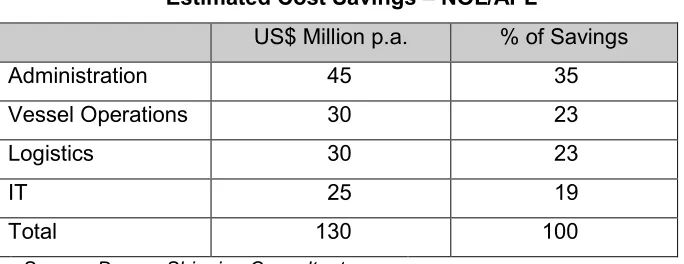
The combined entity of APL-NOL was forecast to have an annual turnover of US$ 4 billion, from lifting of over 2 mn teus in a year. Annual savings from the merger process were pegged at US$ 130mn for the full year of operation, which was
roughly US$60 per teu. Synergies expected from the take-over are shown in Table 3.3.
Table 3.3
Estimated Cost Savings – NOL/APL
US$ Million p.a. % of Savings
Administration 45 35
Vessel Operations 30 23
Logistics 30 23
IT 25 19
Total 130 100
Source: Drewry Shipping Consultants
NOL claims to have achieved a saving of S’pore$ 180mn in 1998, (about US$ 108m) and upped the target to S’pore$ 270mn in 1999.4 Its results have, however, taken a sharp downturn since the take-over. The deal had not come cheap for NOL as APL was a respectable name in the industry and NOL had to cough up a huge premium for the goodwill. It paid close to 50 percent premium over the ruling market price to APL’s shareholders (24.6 million shares at the rate of US$ 33.5 per share). NOL incurred a huge debt (S’pore$ 5bn) for financing the take-over and interest charges on the same (S’pore$ 349mn) had a heavy impact on its bottomline in 1998, the first complete year of joint operations. NOL reported a loss of US$ 245mn in 1998 but the management reasoned the same as the impact of the Asian crisis, as the company’s average freight rates across all trade lanes deteriorated by 8 percent that year over 1997 levels. NOL’s management justified the premium paid as necessary in the face of strong competitive bids.5
NOL hugely benefited from the merger process as it got a strong North American brand name and a readymade US transport and logistical network built to serve the Pacific trades. It adopted the APL brand and NOL’s liner business operation today operates under the name of APL. APL was the pioneer of the double-stack rail operations in the US, and at the time of sale it was second to none. In the words of
the chairman of the NOL group5 “The company (NOL) came to the realisation some years ago that it would be impossible to survive if the company continued to stagnate at a ranking of around 15th among the container lines in the world. To move up quickly in the ranking among the top ten, which position would be necessary for survival, merger with another major container shipping line of around the same rank was the only way”. APL is today ranked as the sixth largest liner operator in the world.
3.1.3 Maersk Line - Sealand
Denmark’s AP-Moller group’s purchase of Sealand last year was one more landmark take-over, which led to the disappearance of the last American liner company from international scene. The news came as no surprise as AP-Moller’s Maersk Line and Sealand had been operating in a close alliance for the past few years, and when news of Sealand being prepared for sale was public, everyone knew that it had to be Maersk bailing out the ailing company. The US-based CNX Corp was growing increasingly disenchanted with the group’s liner division operating under the name of Sealand, as dismal operating margins from this were affecting CNX’s ability to deliver value to its shareholders. CNX had been increasingly noisy in public about its unhappiness with the unpredictability of the liner shipping industry. The split of Sealand into three operating divisions early in 1999, was a harbinger of things to come in the future and observers knew it was just a matter of time before one, or other parts of Sealand would be sold off. 6
Sealand was a mega-operator commanding a strong brand name in major trade routes, hence it had many big names bidding for it. The announcement of major asset sales by P&O Nedlloyd during 1999 raised expectations of the industry and industry circles predicted P&O to make a bid. Had P&O acquired Sealand, the biggest loser would have been Maersk Line, as its carefully built-up global service network in association with Sealand would then have been endangered. This consideration might have played a major role in discussions at the Copenhagen headquarters of Maersk Line, when finally it agreed to take over Sealand at this
moment last year after years of speculations7. Maersk’s management stated that the acquisition came naturally as both the companies had been operating in very close co-operation, and Maersk Line could not have afforded to let Sealand go into the hands of any of its competitors.
Maersk paid US$ 800 million for Sealand’s international liner business, which in fact was US$300 mn less than Sealand’s book value.6 Unlike the APL take-over by NOL, Maersk did not have to pay out heavily for the brand name. The deal included vessels, containers, selected terminals and certain lease obligations on vessels. The Domestic shipping services of Sealand were not part of the deal as the US Jones Act protects those, and CNX was careful to not to attract the wrath of the authorities in the transaction.
The new entity Maersk-Sealand controls over 600,000 teu capacity, that is about 12 percent of the total world capacity. The company has a clear lead of 200,000 teu over its closest rival, Evergreen and is double the size of the world’s largest operator, P&O Nedlloyd. The size of this company can be seen from some of the statistics. It operates a fleet of 250 vessels, which sailed more than 62.5 million nautical miles in 1999, equivalent to 2,500 times around the world. The company made more than 20,000 port calls in 1999, which is about 55 calls every day or two calls per hour continuously. It operates a container fleet of about 700,000 units which if put in a line would stretch more than 6,000 kms, the approximate distance between Paris and New York. Maersk-Sealand has a policy of operating its own terminals at major locations in the world and today operates 24 container terminals8. The take-over has been beneficial for Maersk-Sealand in consolidating its position as the market leader.
3.2 Forces acting behind the mergers
The story of the first, third and sixth largest liner companies in the world shows that the merger is one sure path to supremacy. While this factor has been one of the
major forces behind this consolidation move, there are a number of other motives too. Some of the factors instigating the merger wave in liner shipping are:
• Intense competition and consistent low margins in liner shipping. • Low cost being the success factor.
• The Pursuit for gaining economies of scale. • Limited synergy realisation from alliances. • Deregulation and privatisation of the industry.
Freight rates in container shipping have been ruling very low in recent times, and many operators have suffered heavily in the past 2-3 years. Apart from over-tonnaging, market conditions have been badly affected by the South-east Asia meltdown three years back. Shipowners in the liner industry, have very little influence over revenues as no company is in a position to command a premium pricing. Cutting down on costs is the only way to survive in the long run, and operators have promptly realised this fact. Achieving economies of scale is a simple way of bringing down costs, and container shipping is a perfect case of scale economies, where the rule of the game is ‘big is beautiful’. On the technical side, scale economies has been the motive behind the move of shipowners to acquire large vessels. While on the organisational front, these economies of scale can be fully realised only by way of mergers, and hence the trend. Although alliances and joint ventures have tried to attain these economies, but the extent of gain in such cases is limited.9
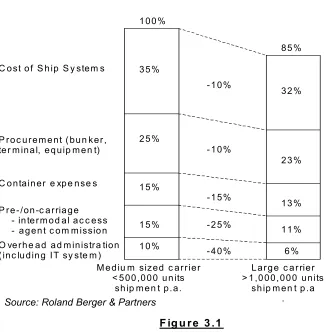
International consultants ‘Roland Berger & Partners’ state that economies of scale exist at two levels, namely, technical (ship sizes and systems) and organisational (scale and scope of companies). On the technical side, economies of scale are the motive behind companies’ choice of acquiring even larger vessels. When filled (load factor of at least 80%) a post panamax ship is 6.3% more advantageous in terms of all-up systems costs, over a panamax vessel. On the organisational side, economies of scale can be realised in all business processes, with the most important being sales and documentation, information technology, and container
logistics. A company with one million liftings a year has 15% scale advantage over a carrier one-third its size9. Areas where these synergies can be achieved are as illustrated in Figure 3.1.
Economies of Scale in Container Shipping
The conference and the alliances systems have not been able to achieve these synergies. Alliance members share only a significant part of the operating costs like running the vessel, container expenses, use of terminals, while the potential for savings on the administrative front remain untapped. Sales and documentation, IT systems and support, and logistics are some of the areas where alliances have found it difficult to have any co-operation so as to realise any synergy effect. Member companies are not forthcoming to share these operations within the alliance due to the sensitive nature of information these processes handle. This information is company specific and highly confidential, which mainly includes customer-related information and rates. A full-scale merger is the only solution if
M e d iu m sized c ar r ier < 5 00 ,0 0 0 u n its
sh ip m e n t p.a.
L ar g e c a r rier > 1 ,0 0 0,00 0 un its
sh ip m en t p .a . C o st o f S h ip S y stem s
P r o c u r e m e nt ( bu n ker , te r m ina l, e q uip m e n t)
C o ntain er e xp e n se s
P r e - /on -c a rria ge - in te r m o d a l a c c e ss - a g en t c o m m issio n O ve rh e a d a d m inistra tion ( inc lu din g IT sy ste m )
1 00 %
85 % 3 5% 1 0% 1 5% 1 5% 2 5% 32 % 23 % 13 % 11 % 6 % - 1 0%
- 1 0%
- 1 5%
- 2 5%
- 4 0%
F ig u r e 3 .1
companies experiencing increasing cost pressures, want to achieve synergy in these core processes. Financial benefits accruing from mergers are much higher than that, which can be achieved from other forms of carrier integration as shown in Figure 3.2.
Scope of Financial Benefits Accruing from Carrier Integration
Figure 3.2
Mergers also come naturally for the liner industry as it is highly fragmented with the largest company controlling just a little over 10 percent of the world capacity. There are a number of small players playing a dominant role in some niches. These small players do not have pockets deep enough to survive the financial strains from continuous low freight rates currently witnessed in the industry, and may easily fall prey to predators. Even for the big players, the changing face of technology and rising trade volumes in the recent past forced companies to invest heavily in large new building programmes. With freight rates running low, these companies are unable to generate sufficient cash flows to service debts, and in order to remain afloat need partners who can bail them out. These troubled companies are available cheaply and give the perfect opportunity to financially strong companies to increase their assets and augment services without a significant drain on their resources. Another factor forcing strong companies to buy out financially troubled companies is
High
Low Medium • Common Pricing
• Common Costs
• Full realisation of scale effects in - sales
- documentation
- Information Technology - logistics operation Merger or
Acquisition
Conference Alliance
• Sharing of significant proportion of operating costs (abt 70%) • Sharing vessel scheduling thereby quality of service.
• Setting rates in certain trades.
Organisational form Focus of common actions Financial benefits
to prevent outsiders from buying these and destroy freight rates further by running these companies at a low cost. Take-overs, in such instances, are defensive in the sense that the cost of acquisition is less than the potential damage that would be caused if the troubled company is taken over by some rival. This fear was the motive behind Hanjin’s take-over of perennial loss maker DSR-Senator lines in 1997 and Maersk’s take-over of Sealand last year.10
One interesting observation related to the three mergers mentioned has been that while the industry has always complained that the alliances have made liner shipping a commodity business, brand names have played a very important role in all of these mergers. P&O Nedlloyd realised that both the individual names of P&O and Nedlloyd were respectable names among shippers and decided to keep both the brand names alive. On the other hand P&O Nedlloyd also acquired Blue Star Lines in 1998, but erased the Blue Star name altogether, bringing all trades under P&O Nedlloyd. In the case of APL’s acquisition by NOL, APL was a very strong brand in North American trades, hence NOL had to swallow the bitter pill of bringing its liner operations under the APL brand and letting the NOL name disappear from liner shipping. Maersk-Sealand has moved very cautiously with brands when taking over companies, and while taking over Safmarine it let the company continue as a separate entity, as Safmarine is a very strong brand in South Africa, and Maersk could not risk to lose the loyal customers of Safmarine who may not associate themselves with a new name had all of Safmarine’s activity been brought under the Maersk umbrella. While the strategy for Safmarine has been different, for Sealand, Maersk followed the same strategy as P&O and changed its identity from Maersk Line to Maersk-Sealand.
3.3 The other face of mergers
Mergers and acquisitions are glamorous and we have seen so many companies jumping on the bandwagon. But companies need to tread cautiously as a bad acquisition can easily pull a financially strong company into the red due to the lack of a proper planning process. Even in the most favourable circumstances, mergers are risky manoeuvres and companies need to have a clear strategic focus before
making any bid. The digestion period is quite tumultuous and without a detailed plan for the whole process both partners can fall.
Merging companies always dream of regaining the existing market share of both the entities, but this is never achieved in real life. In the case of a merger 1 plus 1 does not result in 2. It is 1.7 or something in that range11. This is due to the fact that there is lot of overlapping in services, and some customers are lost in the process. Some of the clients may be competitors in their own field, and would not like their goods to be shipped by the same carrier as their rival’s. Thus partner selection needs careful study in order to maximise synergies and minimise risks. On the post-merger scenario, mixing of the operations of two companies may be easy, but when it comes to the software side i.e. people and the work culture, a proper detailed execution plan is required, as non-compatibility can be chronic. Moreover, proper pre and post merger integration is necessary to achieve a timely realisation of synergies. Non achievement of this will lead to the companies being locked in a time trap, and will make them pay heavily as the costs of acquisitions are pretty high in the short run.
3.4 How long will it last
The current wave of consolidation was triggered by the creation of P&O Nedlloyd, and the industry then predicted that a number of companies would follow suit. The question now is how long will this last? Are the happenings of the last five years enough or do we still have few more surprises to come? Drewry12 opines that countries that are home to several major operators might be on the verge of a national rationalisation. Thus Japan, Taiwan and also China are to be watched closely.
Another opinion is that we can expect consolidation within the alliances. Alliance partners have been operating in close co-ordination and their services complement each other, hence it makes sense to target one’s own alliance partner which would
11 Lim, S.M. 1998.
be a perfect fit, rather than going for a cross-alliance merger. However, the paradox here is one would like to buy out a company from the rival alliance so as to create trouble for that alliance set-up, and unstabilise competitors. Hence it is a debatable opinion and rumours keep on constantly being floated of some company or the other up for sale.
Most of the mergers in the past except P&O-Nedlloyd, NOL-APL, and Maersk-Sealand, have been relatively small. The focus has largely been on north-south ‘niches’ rather than the main east-west trunk trades. The motive behind these small-scale mergers has been to gain entry or a stronghold in new market areas. However, if rationalisation has to come to the industry, there has to be mergers among the big players. The industry still remains fragmented with the top twenty players controlling a little over half of the world capacity, and just one operator controlling over 10 percent capacity13. A shake-up within the top league is, therefore, imminent as operators aim to progress in the rankings. Changes in the top ten league since 1992 can be seen at Table 3.4.
Table 3.4
World’s Top Ten Liner Operators
Rank 1992 2000
1. 2. 3. 4. 5. 6. 7. 8. 9. 10. Evergreen Sealand Maersk Line NYK Line Mitsui OSK Line Cosco
Royal Nedlloyd K-Line
American President Line Hanjin
Maersk-Sealand Evergreen P&O Nedlloyd Hanjin
Mediterranean Shipping Company American President Line
Cosco NYK Line CP Ships Zim Line
Three of the top ten companies of 1992, Sealand, Nedlloyd and APL have been taken over by other big players. Of the current list, rumours about one company or the other up for sale keep flooding the market. It is a wait and watch game as board rooms all over the world discuss who will make the next move in this take-over rush.
Another aspect of the big league is that half of the top ten players of 2000 have taken recourse of the mergers and take-overs route to become big. Maersk-Sealand and P&O Nedlloyd are the amalgamated entity of parts of their name itself, while Hanjin has taken over DSR-Senator, APL is the merged entity of NOL and the earlier APL, and CP Ships has been very active taking over Lykes Line, Contship Containerline, Ivaran line and ANZDL in the past four years. Thus for companies dreaming of gaining supremacy and climbing up the super league table, this is the easier route than having organic growth. One strong believer of this strategy is P&O Nedlloyd as its management has always expressed its desire to seek industry consolidation and drive down unit costs through takeovers.
4.
Global Trends
In this chapter are discussed some trends which have and will in the future affect liner business in a big way. While some have affected all businesses, others have had a dramatic influence on the liner industry that has led to major changes in the way business is being conducted.
4.1 Current Forces affecting liner shipping
4.1.1 Globalisation - The GATT/ WTO system has brought a significant reduction or elimination of barriers to trade, through eight rounds of multilateral trade negotiations. Lower trade barriers have allowed companies to globalise production structures through investments in foreign land, which has boosted trade. The technological evolution has increased information flows, which had a profound impact on a firm’s decision to locate different components of its production processes in various countries and regions, and still maintain a corporate identity. Today it so happens that a car sold in one country has been assembled from parts coming from ten different countries. This has been possible due to the WTO.
1998 marked the 50th anniversary of the GATT, with the world trade witnessing a
upon nations, while the technological revolution has led to an explosion of productivity and slashed transportation costs. The unit cost of sea freight has declined by almost 70% in real terms since the mid-eighties, while the unit cost of air freight has fallen by 3-4 percent over the same period.1
The emergence of global production chains have placed a new set of demands on liner operators. To the general constraints of providing a regular and frequent service of adequate quality, a list of other requirements have been added, with global coverage dominant among them, making liner operations a more extensive, integrated, faster but not necessarily expensive operation. The globalisation effect was also able to penetrate the closed and protected world of conferences, with the emerging low cost operators putting pressure on the conference system. Globalisation was also one of the major forces behind the evolution of world-wide alliances as the spread of production facilities and markets required an integrated global network of services, the pace and magnitude of which made going-it-alone practically impossible for a carrier. While consortia and pools were the outcome of investment pressures arising out of containerisation, the alliances are the responses to the globalisation of production and distribution processes. Globalisation of the world economy has thus opened up a wide array of opportunities and challenges for the liner industry to adjust to.2
4.1.2 Deregulation - The world economy is increasingly being deregulated, which is opening up new trade frontiers for the shipping industry. Markets that were earlier regulated by national regimes are thrown open to competition. Deregulation measures like the ‘Ocean Shipping Reforms Act’ (OSRA) 1998, which came into operation on 1st May 1999 in the USA, has changed the rules of the game
completely and is expected to bring drastic changes in the functioning of liner companies. Major provisions of the Act are:3
• Of the service contracts to be filed with the Federal Maritime Commission, certain terms-rates, service commitments, intermodal origin and destinations, and penalties for non-performance can be kept confidential.
1 WTO, 1998.
• Tariffs need not be filed with the Federal Maritime Commission, but must be made publicly available.
• Carriers allowed to negotiate service contracts individually, as a conference or alliance. Conferences required to permit individual member lines to enter into service contracts, and contract terms can remain confidential.
• ‘Me-too’ service contract terms no longer mandatory for similarly situated shippers.
This Act has started an era of individual contracts between carriers and shippers. In addition, since the terms and rates are now allowed to be different for different shippers, it is expected that fatter clients will have a price advantage over small shippers, who can no longer demand ‘me-too’ contracts. Such de-regulations will change the shape of the liner industry in future.
4.1.3 Alliances - Alliances in the shipping industry have already been discussed in chapter 2 of this dissertation, and the situation in other industries is discussed here.
Alliances have been a major feature of services industries where companies want to achieve wider service coverage, without losing individual identity. The airline industry has identical alliances as shipping. There is the ‘Star Alliance’ of SAS, Lufthansa, Singapore Airlines among other airlines, and ‘One World Alliance’ of British Airways, Cathay Pacific, Qantas and others. Benefits of these have been substantial in terms of overheads as for example SAS looks after Lufthansa’s clients in the Scandinavian countries in return to Lufthansa looking after SAS’s clientele in Germany. Both companies thus save on office establishment costs upto some extent, at common locations. Shipping alliances just share the operational costs and they can learn from these alliances and try to share the administrative overheads too.
Alliances have always been shaky not only in shipping but elsewhere too. In telecommunications first ‘Unisource’ was created by major telecom companies in Sweden, Holland and Switzerland and was later integrated into the ‘World Partner
Alliance’, which involved about 25 telecom companies. Then there was the ‘Concert Alliance’ which started as a partnership between British Telecom and MCI and grew to include almost 50 companies by 1998. Finally, ‘Global One’ was launched in 1996 by Sprint, Deutsche Telecom and France Telecom. These world scale alliances did not last long and by the late nineties, all were in disarray. British Telecom has partnered with AT&T, World Partners is largely defunct and Global One was wrecked by financial problems.4 There seems to be an identical pattern in the
shipping alliances.
4.1.4 Mergers and Acquisitions - Mergers in the shipping industry have been discussed in chapter 3 of this dissertation, and the pattern in other industries is looked at here.
Cross-border mergers have become a do-or-die proposition as companies believe that to become winners, they have to share economies of scale in manufacturing, marketing and research and development. One or the other mega merger is reported on the front pages of the Wall Street Journal or the Financial times everyday, as every industry is witnessing its share of action:5
• Automobiles - Dalmier-Benz and Chrysler, Ford and Volvo, Renault and Nissan.
• Oil - Exxon and Mobil, BP and Amoco and Arco.
• Pharmaceuticals - Glaxo and SmithKline.
• Communication - Time Warner and America Online.
• Telecommunication - MCI Worldcom and Sprint, Vodafone and Mannesmann. The impact of this pursuit for consolidation is having wide repercussions on the shipping industry. The increasing size of these merged entities gives them greater bargaining power and they are able to dictate terms to the shipping companies. As cost reduction is the basic objective of most of these mergers the search for further cost cutting goes to transportation costs too, and these companies bargain for lower rates. Thus the era of the low freight rates continues.
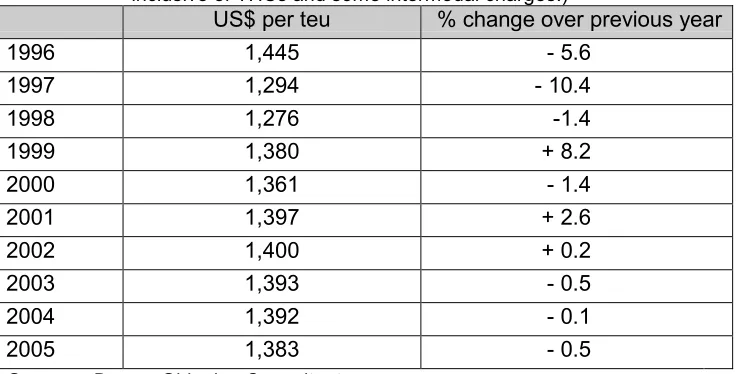
4.1.5 Downward trend in freight rates - Incessant price competition has been a major force in this industry, and freight rates have been going down on all routes with each passing year. Freight rates usually fall due to over capacity in any sector, and unfortunately rates in the liner industry hardly crawl back when slot utilisation increases. Gains accruing from cost cutting measures and declining vessel prices have quickly been passed over to shippers, and many production facilities and international markets have been established on the back of low freight rates only. The industry has to contend with the downward slide in freight rates in the future, as estimated in Table 4.1.
Table 4.1
Estimated and Forecast average unit rate, East-West market
(Weighted average of transpacific, Europe-Far East and transatlantic trades, inclusive of THCs and some intermodal charges.)
US$ per teu % change over previous year
1996 1,445 - 5.6
1997 1,294 - 10.4
1998 1,276 -1.4
1999 1,380 + 8.2
2000 1,361 - 1.4
2001 1,397 + 2.6
2002 1,400 + 0.2
2003 1,393 - 0.5
2004 1,392 - 0.1
2005 1,383 - 0.5
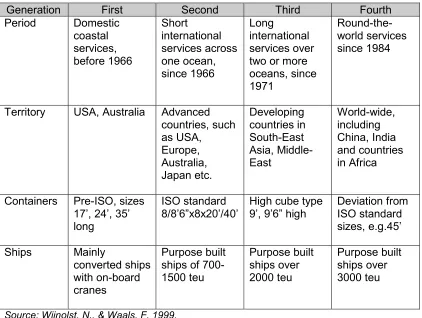
4.1.6 New Vessel Designs – Innovation in containership design has been an active feature of this industry. Vessel sizes have increased in the past as shown in Table 4.2.
Table 4.2
Generations of Containerships
Generation First Second Third Fourth Period Domestic coastal services, before 1966 Short international services across one ocean, since 1966 Long international services over two or more oceans, since 1971
Round-the-world services since 1984
Territory USA, Australia Advanced countries, such as USA, Europe, Australia, Japan etc. Developing countries in South-East Asia, Middle-East World-wide, including China, India and countries in Africa
Containers Pre-ISO, sizes 17’, 24’, 35’ long
ISO standard 8/8’6”x8x20’/40’
High cube type 9’, 9’6” high
Deviation from ISO standard sizes, e.g.45’ Ships Mainly converted ships with on-board cranes Purpose built ships of 700-1500 teu Purpose built ships over 2000 teu Purpose built ships over 3000 teu
Source: Wijnolst, N., & Waals, F. 1999.
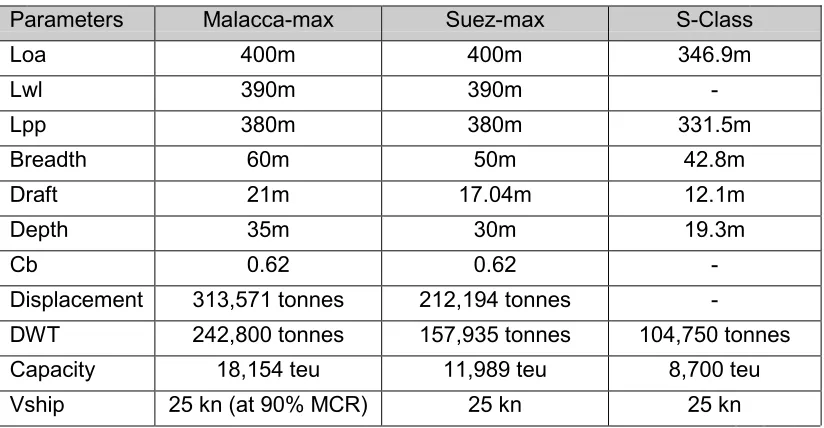
Vessel designs had been restricted to Panamax dimensions till 1998 when the first post-panamax vessel rolled out. The success of this let designers target the next geographical constraint, the Suez-Canal and the Suezmax container vessel is expected to come into service soon. The Suez-Canal is becoming deeper having been dredged to 17 meters in 1999, from the 6.76 meters when it was inaugurated in 1869. If the deepening continues, it is expected to reach 21 meters by 2009 which can allow the Malacca-max, the ultimate container carrier, to be brought into service.6
The Malacca-max, a concept designed by Prof. Niko Wijnolst and a team of students of the Delft University, is the latest in container vessel designs which dwarfs the current largest carrier, Maersks’ S-Class. The main dimensions of these vessels will be as shown in Table 4.3.
Table 4.3
Mega Containership Specifications
Parameters Malacca-max Suez-max S-Class
Loa 400m 400m 346.9m
Lwl 390m 390m
-Lpp 380m 380m 331.5m
Breadth 60m 50m 42.8m
Draft 21m 17.04m 12.1m
Depth 35m 30m 19.3m
Cb 0.62 0.62
-Displacement 313,571 tonnes 212,194 tonnes
-DWT 242,800 tonnes 157,935 tonnes 104,750 tonnes Capacity 18,154 teu 11,989 teu 8,700 teu Vship 25 kn (at 90% MCR) 25 kn 25 kn Source: Malacca-Max by Prof.N.Wijnolst, and Fairplay Database
recently released the concept of such a vessel and ship owners have shown interest in the project.7
4.1.7 Supply Chain Management - Globalisation of the world economy enhanced the established international exchange networks of finished goods and raw materials, and the focus has shifted from mere shipping to the organisation of distribution. Managing the entire process of movement of materials and goods has become more important than providing just transport. Thus shipping or road haulage has given in to the more fashionable concept ‘logistics’.
Global shippers demanding fast just-in-time deliveries, now look for carriers which can handle the whole of their distribution network, and not just provide port-to-port service. Shipping companies, therefore, have to transform their business operations and in addition to providing slots on vessels will have to provide value added services like packaging, warehousing, distribution, logistics consultancy etc. This is an entirely new business area for liner companies and they face stiff competition from non-shipping majors like UPS and Federal Express, which are developing as large supply chain management firms.
4.1.8 Increasing Containerisation - Containerised cargo is the fastest growing segment in sea transportation (other than cruise) registering a 8.9% per annum growth during 1980 to 1997, as against 2% by dry bulk, 0.9% by liquid bulk and 0.9% by non-containerised cargo. The conversion of break bulk cargo to containers has been rising and from a 21% share of containerisation in 1980, 50% of general cargo moved in containers in 1998. The trend towards putting bulk goods in containers is accelerating and we see today the pressure on reefer carriers as bananas and other fruits is increasingly being carried in containers. Operators, instead of repositioning empty carriers try to put in bulk cargo at cheap prices and we have waste paper moving in containers into Asia from Europe, and there was an extreme case of Maersk shipping 20,000 tonnes of wheat in containers from Denmark to Vietnam in 1998. 8 The degree of containerisation is expected to
7 Gray, T. 2000, June.
intensify in the future as carriers encourage stuffing in every type of goods they can in these boxes.
4.1.9 Transshipment - The hub and spoke system is being extended to the relay system whereby ports are developed at the intersection of the east-west and north-south route to facilitate transfer of cargo. The ports of Algeciras and Freeport have been developed as major relay ports in the world. The increasing size of vessels and the pressure for faster turnaround has led to the development of pure transshipment hubs, where most of the containers never pass through the terminal gate. Hubs like Gioia Tauro in Italy, Salalah and Aden in the Gulf have been developed without any hinterland transport traffic or infrastructure. Singapore is the transshipment port of the world, handling almost 10m teu more transshipment traffic than any other port in the world. With transshipment volume accounting for over 80% of container moves in ports like Gioia Tauro, Algeciras, Marsaxlokk, Khor Fakkan, the trend towards shipping companies cutting down on port calls and relying more on transshipment is set to accelerate.9
4.2 Futuristic Market Forces
It is foreseen that the industry will also be influenced by the following major evolutions, which can be termed as global trends, stage II.
Global Village - The WTO is going to have a more profound effect on the world economy, pulling down trade barriers completely. The whole world will be one dreamworld society like the European Union, where national boundaries have almost been removed and some head-way has even been made with a common currency. Regional organisations like the NAFTA, ASEAN will integrate countries into one world and there can be a free flow of trade in future.
artificial intelligence takes over the human factor and personal relations will play a smaller role in businesses.
Virtual Competition - Shipping companies will in the future have to face stiff competition from auction houses on the internet which will attract the small shippers. Net exchanges like www.gocargo.com are increasingly being used by small shippers, due to the platform they provide for striking a cheap bargain. These auction houses are slowly gaining acceptance and in future will be a major force liner companies will have to face.
Customised Services – The growing size of shippers due to mergers gives them higher bargaining power, and for shipping companies taking up the job of logistics management, services will have to be customized as per each clients needs. Shippers will be more demanding and carriers will have to engage their personnel with the logistics department of shippers and plan their services in synchronisation. Big clients will demand constant attention and this will evolve into an era of customised one-to-one marketing for each shipper.
High Powered Propulsion - From steam turbines, the industry has come to diesel technology for its vessels. Further inventions have covered the use of hydrogen for generating power and this concept may be extended to the use of nuclear power for propulsion. This can boost the speed of vessels, but nuclear fission is not eco-friendly and only if the radio-active wastes from this can be controlled in the future, will ships be propelled by nuclear technology.
Disposable Containers - Empty container movements is a big expense for carriers. An expected 15 million teu empties were shipped in 1997, producing 33.5m terminal lifts. Speculatively this would have cost carriers about US $6.5 billion10. The
imbalance in trade continues and the empty repositioning cost has been rising every year. Cheap disposable containers which need not be repositioned and boxes which
9 Boyes, J.R.C. 2000, March.
can be folded and stacked one over the other so that repositioning becomes cheap, have been experimented with and these will be extensively used in the future.
Futuristic Handling Operations - Gantry cranes currently being operated will pave the way for a more mechanised container handling operation which will increase productivity dramatically. Due to single movement of the boxes at a time there is no more than about 30 movements an hour per gantry. A suction technology whereby containers can be picked up and placed on the conveyor belts of the gantry, can lead to a post-panamax carrier emptied and filled in a span of a few hours, and we may see such handling operations in the future.
Emergence of the Freight Forwarder - While some predict that freight forwarder will vanish from the transportation scene and the liner company will take care of the entire transportation chain, another opinion is that they will grow stronger. As shipping lines target big clients, the freight forwarder playing the role of intermediary aggregating small parcels will be able to have the small shippers on his side. By accumulating, the forwarder can build big cargo volumes and bargain for discounts. Agencies like UPS, FedEx and DHL are the potential players and the business of cargo accumulation is set to boom in the future.
E-Commerce - The full potential of the internet is yet to be unleashed in commercial parlance and in future there will be more business transactions on the net. Few companies source components over the net today and it is more of busniness-to-consumer transactions, rather than business-to-business transactions that are taking place currently. Success of e-stores like Amazon.com encourages companies to build up a b-2-b virtual network that will integrate vendors, whereby each is connected to a shared platform for transacting business. This will require investments in systems, which will result in long-term vendor-client relationships since the cost of switch-over will be high for both. Thus b-2-b will be a major IT revolution in the near future.
5.
Indian Scenario
5.1 Development of trade and fleet
Shipping plays a vital role in the development of the Indian economy as it has a geographic advantage of having about 6,000 km coastline that is studded with 11 major and 139 minor and intermediary ports. It also has a strategic location athwart one of the world’s main sea routes. Indian trade has been very dependent on shipping and maritime policies have been framed over the years to purse the aim of having sufficient domestic tonnage to cater for at least part of the national trade in the following proportion:1
- 100% of coastal cargo.
- 100% of strategic cargoes like crude oil and oil products on the coast and also overseas.
- 50% of dry bulk cargoes in overseas trade. - 40% cargo in liner trade.
The above objectives have been aimed at so as to eventually reduce the dependence of national trade on foreign ships, ensuring availability of transport facilities at competitive rates to Indian traders. Indian tonnage, however, has not grown as has been envisaged and from a tonnage strength of 59 ships of 192,000 grt on the eve of independence in August 1947, the fleet had grown to 510 ships of 7.05m grt (11.49m dwt) by the end of 1999. Participation of Indian bottoms in carrying national trade has been hovering around 28~30 percent for the last few years, down from over a 40 percent share achieved in 1987-88.1 The maritime
industry, as well as the state, has adopted a series of measures to increase the participation of Indian lines in catering for the Indian trade by adopting cargo
reservation schemes and a policy of buying fob and selling cif by government departments and public sector enterprises. Regrettably, these measures have not been successful in enhancing Indian lines participation, which is shown in Table 5.1.
Table 5.1
Share of Indian Lines in India’s Overseas Trade
Year Gen Cargo Dry Bulk POL & Products
Total Indian lines
Total Trade
Mt % Mt % Mt % Mt % mt
1990-91 2.27 12.6 15.68 24.2 20.91 61.8 38.86 35.5 109.35 1991-92 2.49 12.9 15.14 28.9 23.38 58.2 41.01 36.7 111.80 1992-93 2.47 14.4 13.79 23.3 26.40 57.3 42.66 34.9 122.30 1993-94 2.29 8.8 11.54 20.0 32.24 60.6 46.07 33.6 136.97 1994-95 3.18 9.0 9.78 17.0 29.06 54.3 42.02 28.7 146.55 1995-96 3.56 10.4 10.35 14.5 32.09 53.3 46.00 27.8 166.10 1996-97 4.44 9.8 9.56 16.1 37.28 55.3 51.28 29.8 172.18 1997-98 6.52 12.4 10.98 14.4 46.03 62.3 63.53 31.4 202.44
Note: Percentage figures are the share of Indian ships in respective commodity groups.
Source – Indian National Shipowners’ Association Annual Review, 1998-99.
The Indian fleet has been slow to enter the emerging shipping sectors. This is evidenced by the fact that while 36 percent of the fleet is comprised of dry bulk and 47 percent of tanker tonnage, cellular container ships aggregating 0.18 m dwt constitute a mere 1.5 percent of the total tonnage.2 The current state of Indian
tonnage can be described as the stagnation phase as there has hardly been any increase in tonnage in the last five years. The lack of proper fiscal incentives and requisite cargo support measures from the state, coupled with the dismal freight market, are the principal causes for this condition. A large proportion of India’s overseas fleet (about 26 percent) is over 20 years old while another 25 percent (approx.) is between 15 and 19 years. India can, however, take pride in having a younger tonnage as the average age of its cargo carrying fleet is 15 years vis-a-vis