www.ijper.org
Development and Validation of
UV-Spectrophotometric Method for Estimation of
Metformin in Bulk and Tablet Dosage Form
Yuvraj Dilip Dange1, Sandip Mohan Honmane1*,Somnath DevidasBhinge2, Vijay Rajaram Salunkhe2,
Dhanraj Raghunath Jadge1
1Department of Pharmaceutics,Annasaheb Dange College of Pharmacy, Ashta, Shivaji University, Kolhapur, Maharashtra, INDIA. 2Department of Pharmaceutical Chemistry, Rajarambapu College of Pharmacy, Kasegaon, Shivaji University, Kolhapur, Maharashtra, INDIA.
ABSTRACT
Introduction: Diabetes mellitus, a metabolic disorder characterized by increased blood sugar level. Metformin hydrochloride is used to treat type I Diabetes mellitus. Metformin hydrochloride chemically 1, 1-dimethylbiguanide hydrochloride, is white crystalline powder, hygroscopic and freely soluble in water, Officially UV spectrophotometric method used for estimation of Metformin Hydrochloride from the bulk and tablets formulations. Objective: Develop and validate a simple, rapid, accurate, economic and precise UV/VIS method for Metformin Hydrochloride in bulk and tablets formulation.
Methodology: Choices of a common solvent were essential so various solvent ranges including methanol, ethanol, acetonitrile and phosphate buffer and various concentrations ranges of various buffers were analyzed. Conclusion: Among different solvents water has showed better results, hence water was selected as a solvent for the proposed method. Metformin Hydrochloride showed maximum absorbance at 234 nm. The percentage recoveries for Metformin Hydrochloride were found in the range of 99-101 %. Method was quantitatively evaluated in terms of linearity, accuracy, precision, ruggedness, robustness and recovery. The method was simple, convenient and suitable for the determination of Metformin Hydrochloride from bulk and tablet dosage forms.
Key Words: Metformin HCl, UV-Spectrophotometry, Tablet.
DOI: 10.5530/ijper.51.4s.109
Correspondence:
Mr. Sandip Mohan Honmane,
Annasaheb Dange College of Pharmacy, Ashta, Shivaji University, Kolhapur-416301. Maharashtra, INDIA. Phone no: 918600392878 E-mail: sandiphonmane@ gmail.com
INTRODUCTION
Chemically Metformin Hydrochloride (HCl) is a (N, N-dimethyl imidodicarbonimidic diamide monohydrochloride as shown in Figure 1. Metformin HCl is used in the treatment of diabetic’s mellitus–II, which works to decrease the glucose absorption in the small intestine, increase of glucose transport into cells, decrease the plasma frees fatty acid concentrations and inhibition of gluconeogenesis. Activation of AMPK plays a vital role in these processes.1,2
Literature survey revealed that reports on analytical methods such as UV-Visible, HPLC, LC-MS, LC-MS/MS and HPTLC for the determination of Metformin HCl from the bulk and dosage form, very few analytical methods reported for Metformin
Submission Date: 29-08-2017; Revision Date: 14-09-2017; Accepted Date: 04-10-2017.
HCl.3-18 Moreover reported methods were
not much cost-effective in terms of solvent consumption. The present investigation was carried out in the view of establishing a simple, rapid, accurate, economic, precise and robust UV method for estimation Metformin HCl in bulk and tablet dosage form using water as the solvent.
MATERIALS AND METHODS19,20,21 Instrument
Chemical and reagents
All the reagents and solvents were of analytical grade high purity deionized water was obtained from Millipore,
Milli-Q (Bedford, MA, USA) purification system.
Metformin HCl was purchased from Pawar supplier Karad, Maharashtra, India. All other chemicals used were of analytical grade.
Preparation of Standard Stock Solutions
100 mg of Metformin HCL was weighed separately and
transferred in 100 mL volumetric flasks. The drugs were
dissolved in 50 mL of distilled water by sonication and then the volume was made up to the mark with the same
solvent to obtain final concentration 1000 µg mL-1 of
the component. Sample Solution
Powder of twenty tablets (Marketed tablets of metformin; Bigomet), containing 500 mg Metformin HCl, was weighed. A quantity of powder equivalent to 10 mg of Metformin HCl was taken in different 10 mL
volumetric flasks containing about 5 mL distilled water
for analysis and sonicated for 15 min. After sonication, the volume was made up to the mark with the same solution to obtain sample stock solution of Metformin HCl (1000 mg mL-1). Further, 0.010 mL solution was quantitatively transferred to a 10 mL volumetric flask to get final concentration 10 mg mL-1 Metformin HCl. The
resulting solution was used for absorbance and results were recorded.
Preparation of Working Standard Solution
Suitable aliquots of 1000 mg mL-1 solution were diluted
up to the mark with water to get the concentration range of 10, 20, 30, 40 and 50 mg mL-1 for Metformin HCL.
The absorbance was measured at 234 nm.
Selection of wavelength
The wavelength for the analysis of Metformin HCl (20 ppm) was selected from the UV spectrum. The standard solution of Metformin HCl was scanned in
the range of 200-400 nm and the λmax was found to be 234 nm against water shown in Figure 2.
Amount of Metformin in each tablet was calculated by using following formula
Sample Absorbance Standard Dilution Average Weight Standard Absorbance× Sample Dilution ×
(1)
Amount Present
% Content 100
Label Claim
= ×
(2)
Method validation
The method was developed and validated according to the analytical procedure as per the ICH guidelines for validation of analytical procedures in order to determine linearity, accuracy precision, ruggedness, and robustness for the analyte.19,20,21
Linearity
The linearity was evaluated by analyzing the different concentration of the standard solution of Metformin HCl. The Beer-Lambert’s concentration range was found to be 10-50 µg mL-1 for Metformin HCl respectively.
The linearity of the relationship between absorbance’s and concentration was determined by plotting the calibration curves for Metformin HCl are shown in Figure 3 and Table 1.
Accuracy (% Recovery)
The accuracy study was performed using the standard addition method.22 The pre-quantified 2 µg mL-1 sample
solution of Metformin HCl were spiked with an extra 80, 120, and 100 % of the standard Metformin HCl. Absorbances were measured at 234 nm and the concen-tration of drug was determined. These mixtures were analyzed by the developed method. The experiment was performed in six times. The percentage recovery of the samples, % RSD and the percentage were calculated at each concentration level shown in Table 2.
Precision
Repeatability measurement was carried out by analyzing six different solutions containing same concentration 20 ppm Metformin HCl and % RSD was calculated. Repeatability of the method was established by ana-lyzing various replicates samples of metformin HCl. Precision was carried out by performing interday and intraday variation. In Inter day variation the sample was analyzed on three consecutive days. In an intraday varia-tion in the absorbance was measured three times in a day. Inter and intraday precision was determined using 20 ppm concentration.
Intraday Precision
In the intraday variation study was determined for a solution (20 ppm) and was analyzed three times for the consecutive days (i.e. morning, afternoon, evening). Mean, standard deviation and % RSD was calculated and shown in Table 3.
Interday Precision
of correlation coefficient for Metformin HCl was found
to be 0.9998 shown in Table 1 and Figure 3.
The standard addition method was employed for accuracy measurement. The percentage recoveries for Metformin HCl were found in the range of 99-101 %. The values of the recovery (%) and %RSD were shown in Table 2, which indicates the accuracy of the proposed method. Ruggedness
The ruggedness of the method was determined by carrying out the analysis by the different analyst in different laboratories using different UV spectropho-tometer and the respective absorbance of 20 mg mL-1
was noted. % RSD was calculated. The Ruggedness data and analytical performance parameters of Metformin HCl were shown in Table 5.
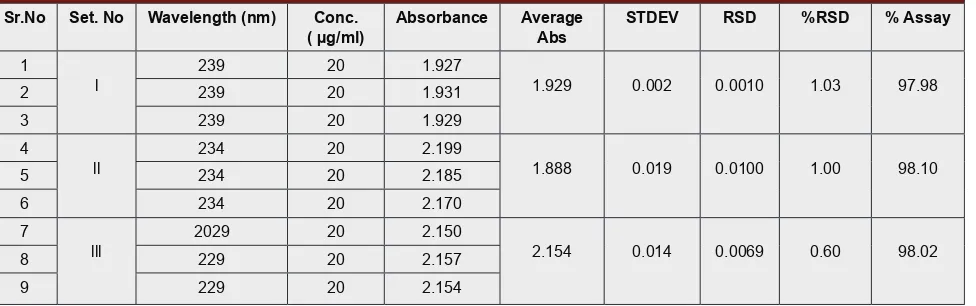
Robustness
The robustness was carried out to evaluate the influence
of a small but deliberate variation in the spectrometric condition for determination of Metformin HCl bulk and tablet dosage form. The Robustness data for varia-tions in wavelength of detecvaria-tions (±5nm) and the absorbance and its analytical performance parameters of Metformin HCl were shown in Table 6.
RESULT AND DISCUSSION
To optimize the UV parameters, several conditions were tried to achieve a good absorption and peak shape for Metformin HCl. Several solvents of different
composi-tions were tried to provide sufficient selectivity towards
the drugs. Distilled water components resulted in better sensitivity.
The methods discussed in the present work provide a convenient and accurate way for the analysis of Metformin HCl from bulk and tablet dosage form by UV Spectro-photometry method. The 234 nm wavelength was selected for analysis of Metformin HCl (Figure 2). The absorbance of Metformin HCl was found to be 1.102 to 5.710 (Table 1). Selected methods linearity was observed in the concentration range of 10-50 mg mL-1. In this
method, the concentration of the drug was determined at 234 nm using the respective absorptivity value shown in Figure 3.
A Linear correlation was obtained between absorbance Vs concentration. Calibration curve for Metformin HCl showed linearity in the concentration range 10-50 mg mL−1. The linearity of the calibration curve was validated
by the value of correlation coefficients (r2). The value
Table 1: Linearity study for Metformin.
Sr.No. Concentration (ppm) Absorbance
1 10 1.102
2 20 2.280
3 30 3.215
4 40 4.541
5 50 5.710
Mean 3.3696
SD 1.8167
RSD 0.5390
%RSD 53.90
Correlation coefficient 0.9998
Slope 0.07877
Figure 1: Structure of Metformin
Figure 2: UV Spectrum of Metformin
Table 4: Interday Precision for Metformin (n = 6).
Sr. No Conc.(ppm) Day I Day II Day III
1 20 2.232 2.270 2.280
2 20 2.222 2.260 2.275
3 20 2.251 2.265 2.277
4 20 2.260 2.281 2.280
5 20 2.251 2.280 2.261
6 20 2.255 2.278 2.271
Average 2.245 2.251 2.272
SD 0.0150 0.0086 0.0066
RSD 0.0066 0.0038 0.029
%RSD 0.66 0.38 0.29
Table 2: Statistical Validation for recovery studies of Metformin (n = 6).
Sr.
No. Concentration(ppm) Absorbance Mean SD RSD %RSD
1 80% 3.8103.790 3.795 0.01322 0.00348 0.34
3.785
2 120% 4.2504.285 4.269 0.01778 0.00416 0.41
4.273
3 100% 3.9134.000 3.947 0.04650 0.01170 1.17
3.928
Table 3: Intraday Precision for Metformin (n = 6).
Sr. No Conc.(ppm) Abs-I Abs-II Abs-III
1 20 2.232 2.231 2.199
2 20 2.222 2.260 2.251
3 20 2.251 2.260 2.251
4 20 2.260 2.197 2.257
5 20 2.257 2.251 2.260
6 20 2.255 2.195 2.226
Average SD RSD %RSD
2.2451 2.2253 2.2421
0.0147 0.0336 0.0247
0.0065 0.0151 0.0110
0.65 1.50 1.10
Average %RSD 1.08
The precision of the method was determined by analyzing the drug formulation by replicate injections and preci-sion of the system was determined by mixed standard solutions. % RSD of the analyte was found to be within the limit of 2 %, shown in Table 3 and Table 4 thus the developed method was found to be in the high degree
of precision. The low values of the % RSD indicate the repeatability of the proposed method.23
Ruggedness was determined by performing the assay with the same condition on different days, by different analysts, different instrument and different time.24 The
Robustness was determined by carrying out the assay during change wavelength. The % RSD was found to be not more than 2 % which was within the limit shown in Table 6.
CONCLUSION
The proposed method quantitatively evaluated in terms of linearity, accuracy, precision, ruggedness, robustness and recovery. All these factors lead to the conclusion that the proposed UV-Spectrophotometric method is simple, accurate, precise, sensitive and cost-effective. This method was adopted for the use of economical and easily available mobile phase and for the UV detec-tor. Thus the used mobile phase makes it an excellent method for the estimation of Metformin HCl in bulk drug and its formulations.
CONFLICT OF INTEREST
The authors confirm that these article contents have no conflict of interest.
ABBREVIATIONS USED
HCl: Hydrochloride; UV: Ultraviolet; RSD: Relative
standard deviation; HPLC: High-performance liquid
chromatography; HPTLC: High-performance Thin
layer liquid chromatography; LC-MS; liquid
chroma-tography-mass spectroscopy; AMPK: AMP-activated
protein kinase.
REFERENCES
1. Grzybowska M, Bober J, Olszewska M. Metformin - mechanisms of action and use for the treatment of type 2 diabetes mellitus. Postepy Hig Med Dosw online. 2011;6(65): 277-85.
2. Willard HH and Merritt II. Instrumental method analysis. New Delhi: CBS Publication and Distribution; 2001.
3. Kar M, Choudhury PK. HPLC method for estimation of metformin hydrochloride in formulated microspheres and tablet dosage form. Indian J Pharm Sci. 2009;71(3):318–20.
4. Neelima K, Prasad YR. Analytical method development and validation of metformin, voglibose, glimepiride in bulk and combined tablet dosage. Pharmaceutical Methods. 2014;5(1):27-33.
5. Sowjanya P. RP-HPLC method development of metformin in pharmaceutical dosage form. Research and Reviews: J Pharm Analysis. 2015;4(4):9-20. 6. Anedda A, Rial E, Gonzalez-Barroso MM. Metformin induces oxidative stress
in white Adipocytes and raises uncoupling protein 2 levels. J Endocrinol. 2008;199(1):33-40. Doi: 10.1677/JOE-08-0278.
Table 5: Statistical Validation for Ruggedness studies of Metformin.
Sr. No Parameter Set I Set II
1 System Shimadzu-1700 Systronics -119
2 Sample Batch No-X Batch No –Y
3 Day Monday Tuesday
4 Date 30/01/2017 31/01/2017
5 Time 11.45am 3.45 pm
6 Lab Analysis Chemistry
7 Analyst Dange Y. D. Honmane S. M.
8 Sample 20 ppm 20 ppm
9 Absorbance 2.286 2.280
10 Assay 99.65% 99.85%
Table 6: Statistical validation for Robustness studies of metformin.
Sr.No Set. No Wavelength (nm) Conc.
( µg/ml) Absorbance AverageAbs STDEV RSD %RSD % Assay
1
l 239 20 1.927 1.929 0.002 0.0010 1.03 97.98
2 239 20 1.931
3 239 20 1.929
4
ll 234 20 2.199 1.888 0.019 0.0100 1.00 98.10
5 234 20 2.185
6 234 20 2.170
7
lll 2029 20 2.150 2.154 0.014 0.0069 0.60 98.02
8 229 20 2.157
7. Zhang Z, Radziuk J. Inverse relationship between peripheral insulin removal and action: studies with Metformin. American J Physiology. 2001. 1-9. 8. Trautwein C. and Kummerer K.: Designed incomplete degradation of the
type II antidiabeticMetformin, http://www.leuphana.de/fileadmin/user_upload/ Forschungseinrichtungen/iec/files/Poster_Incomplete_degradation_of_the_ typeII_antidiabetic_Metformin.pdf.
9. Tache F, Albu M. Specificity of an Analytical HPLC Assay Method of Metformin Hydrochloride. Revue Roumaine De Chimie. 2007;52(6):603–609. 10. Narasimha Rao D, Chandana M. Method Development and Validation of
RP-HPLC Method for Simultaneous Analysis of Three-Component Tablet Formulation containing Metformin Hydrochloride, Pioglitazone Hydrochloride, and Glibenclamide. Int J Pharm Tech Research. 2012;4(3):948-956. 11. Dhabale PN, Seervi CR. Simultaneous UV Spectrophotometry Method for
Estimation of Gliclazide and Metformin Hydrochloride in Tablet Dosage Form. Int J Chem Tech Res. 2010;2(2):813-17.
12. Dhakar RC, Maurya SD, Aggarwal S, Kumar G, Tilak VK. Design and Evaluation of SRM Microspheres of Metformin Hydrochloride. Int J Comprehensive. 2010;1(7):1-5.
13. Bhinge SD, Malipatil SM, Jondhale A, Hirave R, Savali AS. A new approach to the RP-HPLC method for simultaneous estimation of Atorvastatin calcium and Fenofibrate in pharmaceutical dosage forms. J Chemistry. 2012;9(3):1223-29.
14. Dey S, Reddy YV, Swetha B, Kumar SD, Murthy PN, Sahoo SK, Kumar D, Patro SS, Mohapatra S. Method development and validation for the estimation of Olopatadine in bulk and pharmaceutical dosage forms and its stress degradation studies using UV- VIS Spectrophotometric method. Int J Pharm and Pharmaceutical Sci. 2010;2(4):212-18.
15. Sandhu GS, Hallan SS, Kaur B. Development of RP-HPLC method for simultaneous estimation of glimepiride, Pioglitazone hydrochloride and
metformin hydrochloride in a combined tablet dosage form. World J Pharm and Pharmaceutical Sci. 2016;5(3):1278-85.
16. Sethuraman S, Adhakrishnan K, Venkateswarlu V, Sravani M, Ramathulasi G, Bhanuteja S. Estimation And Degradation Monitoring Of Cefadroxil In Pharmaceutical Dosage Form By Using UV-Spectroscopy. Asian Journal of Research in Biological and Pharmaceutical Sciences. 2014; 2(1):27-33. 17. Karkhanis VV, Anand Kumar DC, Patel P. Development and Validation of
UV Spectrophotometric Method for Estimation of Glipizide in Bulk and Pharmaceutical Dosage Forms. Int J Pharmaceutical Science and Res. 2013;4(5):1865-67.
18. Dey S, Kalyani K, Samyuktha B, Sahoo SK, Mohapatra S, Murthy PN, Kumar D. Development And Validation Of A UV-Vis Spectrophotometric Method For The Estimation And Degradation Monitoring of Cefadroxil In Bulk And Pharmaceutical Dosage Forms. Int J Chem Res. 2010;1(1):29-34. 19. Chatwal GR and Sham KA. Instrumental method of chemical analysis. 5th ed.
Mumbai: Himalaya Publishing House; 2002;626-636.
20. Beckett AH and Stenlake JB. The Practical Pharmaceutical Chemistry. Part II. New Delhi: CBS Publishers and Distributors; 1997.
21. Lloyd RS, Joseph JK, Joseph LG. Practical HPLC Method Development. 2nd
ed. York: Wiley Wiley-Interscience publication; 1997.
22. Bhinge SD, Malipatil SM. Development and validation of stability indicating the method for simultaneous estimation of cefixime and dicloxacillin using a RP-HPLC method. J Taibah University for Science. 2016;10:734-744. 23. Bhinge SD, Malipatil SM, Sonawane LV. Bioanalytical Method Development
and Validation for Simultaneous estimation of cefixime and dicloxacillin in Human Plasma. Acta Chimica Slovenica. 2014;61(3):582-586.
24. Bhinge SD, Malipatil SM, Sonawane LV. Simultaneous estimation of cefixime and cloxacillin in human plasma by Reverse Phase HPLC with UV detection. Thia J Pharm Res. 2012;36:63-71.
SUMMARY PICTORIAL ABSTRACT
• UV/VIS method has been developed and validated for Metformin Hydrochloride. The Linearity was observed in the concentration range of 10-50 mg mL-1 for Metformin Hydrochloride. The correlation coefficients were found to be 0.9998. The percentage recoveries for Metformin Hydrochloride were found in the range of 99-101 %. Method was quantitatively evaluated in terms of linearity, accuracy, precision, ruggedness, robustness and recovery. The method was simple, convenient and suitable for the determination of Metformin Hydrochloride from bulk and tablet dosage forms.
Mr. Yuvraj D Dange: M.Pharm. Asst. Professor at Annasaheb Dange College of Pharmacy, Ashta, Sangli (MS). He has > 5 International and national Publications.
About Authors
Dr. Somnath D. Bhinge: M.Pharm Ph.D. Professor & HOD at Rajarambapu college of Pharmacy Kasegaon, Sangli (MS). He had 9 years in teaching experience. He is Approved PG Teacher. He has > 20 International and national Publications. He is a Life member of various professional associations like IPA, APTI & IPS.
Cite this article: Dange YD, Honmane SM, Bhinge SD, Salunkhe VR, Jadge DR. Development and Validation of UV-Spectrophotometric Method for Estimation of Metformin in Bulk and Tablet Dosage Form. Indian J of Pharmaceutical Education and Research. 2017;51(4S):S754-S60.
Dr. Vijay R. Salunkhe: M. Pharm. Ph.D. Professor & HOD at Rajarambapu college of Pharmacy Kasegaon, Sangli (MS). He had 22 years in teaching experience. He is Approved PG Teacher and Ph.D Guide. He has > 32 International and national Publications. He is a Life member of various professional associations like IPA, APTI & IPS.