DYNAMIC MACHINE LEVEL RESOURCE ALLOCATION
TO IMPROVE TASKING PERFORMANCE ACROSS MULTIPLE PROCESSES
by
Richard Walter Thatcher
A thesis
submitted in partial fulfillment of the requirements for the degree of Master of Science in Computer Science
Boise State University
© 2016
Richard Walter Thatcher
DEFENSE COMMITTEE AND FINAL READING APPROVALS
of the thesis submitted by
Richard Walter Thatcher
Thesis Title: Dynamic Machine Level Resource Allocation to Improve Tasking Performance Across Multiple Processes
Date of Final Oral Examination: 28 June 2016
The following individuals read and discussed the thesis submitted by student Richard
Walter Thatcher, and they evaluated his presentation and response to questions during the
final oral examination. They found that the student passed the final oral examination. James Buffenbarger, Ph.D. Chair, Supervisory Committee
Kyle Wheeler, Ph.D. Member, Supervisory Committee
Amit Jain, Ph.D. Member, Supervisory Committee
The author wishes to express gratitude to Dr. Kyle Wheeler, Dr. Richard Murphy, and Micron Technology without which this work would not have been possible.
Across the landscape of computing, parallelism within applications is increas-ingly important in order to track advances in hardware capability and meet critical performance metrics. However, writing parallel applications is difficult to do in a scalable way, which has led to the creation of tasking libraries and language extensions like OpenMP, Intel Threading Building Blocks, Qthreads, and more. These tools abstract parallel execution by expressing it in terms of work units (tasks) rather than specific hardware details. This abstraction enables scaling and allows programmers to write software solutions that can leverage whatever level of parallelism is available. However, the typical task scheduler is greedy and na¨ıve. Thus, concurrent parallel processes compete for computational resources, which results in unnecessary context switches, mis-timed synchronization, unnecessary resource contention, and the asso-ciated consequences. By providing a mechanism of communication between the task schedulers, processes can cooperate to more effectively utilize hardware and avoid the negative consequences of coarse-grained resource contention. This work uses Qthreads to demonstrate that cooperative allocation of computational resources reduces con-tention and decreases execution time. The overhead added for the resource allocation is shown to have minimal impact. Using the Unbalanced Tree Search (UTS) and High Performance Conjugate Gradient (HPCG) benchmarks, execution time across concurrent processes shows significant decreases across a range of machines running a variety of hardware resources and software configurations. Tests also indicate that dynamic compute-resource allocation provides a clear performance benefit even when
units. UTS tests saw an average of 4.98% reduction in execution time in Linux compared to Qthread’s yielding option and an 89.32% reduction in execution time in Apple OS X. HPCG resulted in partitioning reducing execution time by an average of 22.31% compared to the default Qthreads configuration across all test platforms.
ABSTRACT . . . vi
LIST OF TABLES . . . xi
LIST OF FIGURES . . . xii
1 Introduction . . . 1
1.1 The Problem . . . 1
1.1.1 Context Switching . . . 2
1.1.2 Jitter . . . 2
1.2 Qthreads . . . 3
1.2.1 Oversubscription . . . 5
1.3 Other Tasking Approaches . . . 5
1.4 Related Research . . . 6
2 Implementation . . . 8
2.1 Design Overview . . . 8
2.2 Thread Liveness . . . 9
2.3 Process Communication . . . 10
2.4 Data Protection . . . 12
2.5 Resource Partitioning . . . 14
2.5.1 Worker Zero Constraint . . . 17
3 Test Machines . . . 20
3.1 Variance of Environments . . . 20
3.2 Desktop . . . 21
3.3 Laptop . . . 21
3.4 Shared Server . . . 21
3.5 Dedicated Server . . . 22
4 Benchmarks . . . 23
4.1 Benchmark Selection . . . 23
4.2 Unbalanced Tree Search . . . 23
4.2.1 Test Trees . . . 24
4.3 High Performance Conjugate Gradient . . . 25
5 Results . . . 26
5.1 Testing . . . 26
5.2 Qthreads Default Configuration . . . 26
5.3 UTS Results . . . 28
5.3.1 Single UTS Process . . . 28
5.4 Three UTS Processes . . . 30
5.4.1 Laptop UTS Oversubscription . . . 31
5.5 UTS Scaling . . . 32
5.5.1 Desktop UTS Scaling Results . . . 33
5.5.2 Laptop UTS Scaling Results . . . 33
5.5.3 Shared Server UTS Scaling Results . . . 33
5.5.5 UTS Scaling Conclusion . . . 35
5.6 Partitioning with Yielding . . . 36
5.7 OpenMP and Intel Threading Building Blocks UTS Comparison . . . 37
5.8 Coming and Going . . . 39
5.9 HPCG Results . . . 40
5.10 Multi-User . . . 44
6 Future Work . . . 46
6.1 Code . . . 46
6.2 Research . . . 46
6.2.1 Resource Donation . . . 46
6.2.2 Worker Allocation . . . 47
6.2.3 Unshackle Worker Zero . . . 48
6.2.4 Benchmarks and Testing . . . 48
6.2.5 Tuning . . . 49
6.2.6 Error Handling . . . 49
7 Conclusion . . . 51
REFERENCES . . . 53
A Implementation Code . . . 55
4.1 UTS Tree Variables . . . 24
5.1 Qthreads Default vs Yielding enabled . . . 27
5.2 Desktop Single Test Variance . . . 29
5.3 Single Process Partitioning Overhead . . . 29
5.4 Laptop Three UTS Process Tests . . . 32
5.5 Interspersed Tests . . . 39
2.1 Single NUMA region worker assignment . . . 15
2.2 Two NUMA region worker assignment . . . 15
2.3 Example partition . . . 17
5.1 Single process execution with partition, yield, and default options . . . . 28
5.2 Three small UTS test Linux comparison . . . 30
5.3 Three large UTS test Linux comparison . . . 31
5.4 OS X Activity Monitor during tests . . . 32
5.5 Large UTS test scaling test results . . . 34
5.6 UTS tests results with both partitioning and yielding enabled . . . 36
5.7 OpenMP, TBB, Qthreads partition and yielding UTS comparison . . . 37
5.8 Desktop HPCG results . . . 40
5.9 Laptop HPCG results . . . 41
5.10 Shared server HPCG results . . . 42
5.11 Dedicated server HPCG results . . . 43
CHAPTER 1
INTRODUCTION
1.1
The Problem
Parallel computing often results in random distributions of work, creating hot spots of activity, especially when computation is not embarrassingly parallel and includes het-erogeneous threads and/or processes. As task-parallel programs continue to increase in prevalence, it is increasingly likely that multiple task-parallel processes live on a single machine, and even CPU/socket, creating contention for compute resources.
Lightweight tasking alleviates some of the contention by abstracting the under-lying operating-system-level thread usage to distribute work among a set of worker threads. However, each instance of a lightweight tasking library typically assumes it is the only instance on the machine. Naturally, it makes scheduling decisions to maximize performance based off that assumption. Such decisions are often highly counterproductive in a shared or even oversubscribed environment.
rely on multiple schedulable threads, they are more exposed to the negative impacts of unfortunate OS-scheduler decisions.
1.1.1 Context Switching
Pre-emptive context switching is a standard operating-system tool for sharing compu-tational resources. Processes are scheduled to get a time slice to run and those time slices are scheduled according to the OS’s scheduling policy. Pre-emptive context switching is the process by which one process is swapped out of the CPU and another process is swapped in for each time slice. A context switch has direct and indirect costs that can degrade the performance of a process.
The direct cost of a context switch is the time to perform the action: save CPU registers and other process state, flush CPU pipeline and cache, run OS-scheduler code to select another process, then load and begin execution of the newly selected process. Indirectly, there will be cold-cache misses as a result of flushing the cache. Li, Ding, and Shen found the direct cost of a context switch to be 3.8 microseconds, and found the indirect costs to reach as high as over one-thousand microseconds on a server with dual Intel Xeons with a 2.0 Ghz clock rate [10].
1.1.2 Jitter
Operating system jitter, also known as scheduling jitter, is delays in processing due to scheduling of other processes and system interrupts, or, more generally, delays due to context switching [1]. Due to the time-slicing of the OS scheduler, in parallel programs this can cause a compounding execution delay related to synchronization.
that time slice, then A will continue to wait for the rest of its time slice. Depending on the type of synchronization, process A may get scheduled repeatedly, with nothing to do but wait, before process B gets scheduled. When B is run next, it will reach the synchronization point allowing A to continue, but A is now back in the scheduler waiting for another time slice. When A is scheduled next, it will continue past the synchronization point.
Since the impact of jitter depends on the scheduling policy, as well as the dynamic set of other processes contending for time slices, it leads to inconsistency in execution time. Furthermore, because this can potentially happen on every synchronization, and synchronizations can occur between more than two threads, this delay can compound and drastically alter execution time. What’s more, jitter in one set of threads creates localized delay, which changes the balance of execution, leading to more jitter effects. The simple way to reduce the effect of jitter is to yield whenever a synchronization point is reached, allowing the process to immediately relinquish its time slice. If there is synchronization mismatch due to jitter, yielding can reduce time spent waiting for synchronization, by allowing other threads or processes to run. However, this can backfire. If A and B both reach their synchronization point during overlapping time slices, they can proceed as normal, but if the processes yield when they synchronize then both A and B would be waiting until their next time slice to continue, adding delay.
1.2
Qthreads
synchronization, data structures, etc., and is a portable, user-space, shared library [19].
When Qthreads is initialized, it spawns a number of worker pthreads, or “workers.” The workers may be grouped, based on a user specification or automatically via software that reports the hardware topology. Every group of workers is a shepherd, even if there is only one group. By default, Qthreads attempts to have the number of groups equal to the number of non-uniform memory access (NUMA) domains, as determined by its understanding of the hardware.
Each shepherd has a queue of work that its workers pull from to execute. Because of this, and because NUMA regions frequently map to L3 cache sharing, the grouping to NUMA regions allows workers to leverage cache locality based on the work in the queue. In an effort to balance the work between shepherds, and to keep all workers busy, shepherds can steal work from another shepherd’s queue [16].
This model allows a programmer to create as many lightweight threads as memory allows, without incurring the typical problems of oversubscribing the hardware, since the number of OS threads doing the work is matched to the hardware.
1.2.1 Oversubscription
Qthreads provides a compile-time option that causes the Qthreads spinlock to yield its time slice. These yield functions end the thread or process’s current time slice and move them to the back of the process scheduling queue for their priority. This allows other threads or processes to run. This is a useful behavior in situations where it does not make sense to have a process or thread spinning and wasting time, such as in oversubscribed situations where other threads and processes need the resources. This has a large impact in oversubscribed situations. Since the aim of this work is to improve performance in oversubscribed situations, the yielding feature of Qthreads is the true benchmark to test against.
1.3
Other Tasking Approaches
processes are running and the implementation of dynamic teams lies entirely inside the OpenMP shared library. However, dynamic teams uses a constantly polling “watchdog” for monitoring the shared data segment, uses locking mechanisms on the shared data segment, and has additional restrictions imposed due to the OpenMP specification.
Intel Threading Building Blocks (TBB) [6] is a tasking library similar to Qthreads provided by Intel. TBB uses a shared library and associated API to give programmers an abstraction of tasks from threads to provide performance and task scalability. Intel’s documentation of TBB lays out the same core problems that this work is aimed at addressing [7]. It implies that TBB does not mitigate compute resource contention across processes and that Intel leaves users of TBB to mitigate these issues either through programming or control of the run-time environment.
1.4
Related Research
The concept of partitioning work across threads or processes is not new, and is central to most parallel programming. Partitioning hardware resources for multiple applications is not as common on a single machine.
VPMs. One benefit is that the VPMs can provide an additional level of sandboxing for applications, siloing them to prevent system instability as a result of misbehaving applications.
Liu et al. suggest space-time partitioning, which virtualizes partitions then schedul-ing at the partition level [11]. Similar to the VPM approach, this requires operatschedul-ing- operating-system-level implementation, going so far as to propose all scheduling is done at the partition granularity, even the OS services, and a context switch effectively becomes a partition switch. Tessellation is what they call the kernel that implements partitioning and allocation, as well as provides an API allowing programmers to pin threads to specific cores and specify virtual-memory translations. They describe the possibility of having an application span multiple partitions and providing an inter-partition communication method, though they appear to mean simply that multiple applica-tions can interact across partition boundaries. The concept of scheduling partiapplica-tions obviously brings a lot of challenges, an overhaul of OS scheduling and design, and an additional programming paradigm.
CHAPTER 2
IMPLEMENTATION
The goals of the implementation are to be as efficient as possible to minimize overhead and maintain Linux and Unix compatibility. Additionally, the implementation keeps in line with Qthreads use as a userspace-only shared library. This is worth mentioning because it would be far easier to implement these features inside the operating system kernel. For example, the Qthreads code could be a single runtime, directly handling the resource allocation instead of relying on inter-process communication. This would be more efficient since shared memory would not be necessary but would reduce the portability of the library. Or there could be an OS service or daemon that handles errors and resource allocation.
2.1
Design Overview
receives a notification of a new process, it will repartition based on the updated information in the shared memory. When a process finishes, it will update the shared memory section to remove itself and notify the other processes, which will repartition, allowing them to reclaim the resources used by the process that is finishing.
2.2
Thread Liveness
Central to the concept of friendliness across parallel processes is to have only the threads allocated for a process active. The goal is to maintain the sets of inactive and active threads such that the union of the active threads across processes is all threads, and the intersection of the active threads across processes is the empty set. The only exception being thread zero, which is the parent thread for a Qthreads instance, so it is left active as a safety precaution.
slices. Once the data for the waiting process/thread is available, it signals the kernel that the data is ready and the kernel puts the waiting process/thread back into the process scheduler. Since the process/thread is not being scheduled during the time it is waiting, this reduces context switching and wasted time slices. The reduction in context switching in turn improves performance when it is expected that the process/thread will be waiting for longer periods of time and thus added delay between the signal to the kernel and the process/thread getting its scheduled time slice isn’t as important.
In this implementation, a pipe is used for the blocking I/O call. To bring a thread out of the inactive pool, a single byte is written to the pipe ending the blocking read. However, to avoid potential for a locked system where a blocking write is called but the thread is not in the inactive pool, and thus not waiting to read, writes to the pipe are non-blocking calls. Using a mutex would be largely equivalent to using a pipe, since it would also block, remove the thread from the scheduler, and incur a signal upon unlocking, but has portability challenges.
2.3
Process Communication
There are two common ways for processes to communicate: message passing and shared memory [9]. Message passing is very broad and can range from signals to pipes to sockets. This implementation effectively uses both message passing and shared memory as a means to allow asynchronous message passing via signals and the data delivered via shared memory segment.
but still very restrictive in its usage compared to memory usage within an application. Since process memory is typically protected from access by other processes, it is not possible to put function pointers in the shared memory to allow a process to call a function into another. Even further, because virtual addresses are different for each process, it is not possible to reliably use pointers across processes for data within the shared memory. Due to these limitations, the partitioning implementation uses a combination of shared memory and signals.
The shared memory portion of the implementation stores the dynamic resource-allocation data structure that has a 64-bit unsigned integer to count active processes and an array of 64-bit signed integers to be used to provide data about the process, hereafter referred to as the “process array.” The initialized size of the array is 511, which, combined with the 64-bit active process count variable, keeps the data structure inside a single 4-kilobyte memory page.
Entries in the process array use an encoding to provide information about the process. The encoding uses the most significant bit (MSB) to indicate if the process is in need of additional resources. This allows a simple sign check to determine if it needs resources. After the MSB, the next 31 bits are available for extending the implementation or adding functionality. The final 32 bits are the process ID, which provides a unique identification, as well as the means to send signals to other processes. If a system uses 64-bit process IDs, then the sign and extension space could be eliminated or moved to a secondary 32 or 64-bit integer. The code in Listing 2.1 shows the definitions of the shared memory section and bit masks.
Listing 2.1: Shared memory definitions
1 # d e f i n e M A X _ F I M _ P R O C 511
2 // p r o c s e n c o d i n g :
4 // 3 2 : 6 2 m a i l b o x
5 // 0 : 3 1 p i d
6
7 // b i t e n c o d i n g s
8 # d e f i n e F I M _ M S B _ 0 0 x 7 F F F F F F F F F F F F F F F
9 # d e f i n e F I M _ M S B _ 1 0 x 8 0 0 0 0 0 0 0 0 0 0 0 0 0 0 0
10 # d e f i n e F I M _ L O W 0 x 0 0 0 0 0 0 0 0 F F F F F F F F
11 # d e f i n e F I M _ H I G H 0 x F F F F F F F F 0 0 0 0 0 0 0 0
12
13 t y p e d e f s t r u c t f i m _ t {
14 u i n t 6 4 _ t n u m _ p r o c s ;
15 i n t 6 4 _ t p r o c s [ M A X _ F I M _ P R O C ];
16 } f i m _ t ;
Shared memory provides the necessary data sharing, but processes are not aware of changes to the shared data unless they are monitoring the shared data state. To notify all the processes of changes to shared memory, the user defined signals,SIGUSR1
and SIGUSR2, are used to check if a process is still active/alive (see Section 2.6) or to
repartition (see Section 2.5), respectively.
2.4
Data Protection
Using shared memory means that all participating processes have access to the shared data structure. Consequently, there can be a race condition when updating the shared data. Any code that updates the shared data structure is considered a “critical section” and needs protection for multiple simultaneous accesses.
While a mutex or semaphore may be necessary in cases where the critical section is multiple instructions, they can hurt performance and can introduce the possibility of deadlocks if not programmed carefully.
An alternative to locking the data structure is to modify it only using atomic operations. This approach is viable as long as every possible state the data structure may be in is legal and coherent. Such operations can often be done with compiler built-in functions depending on the target processors [2]. Atomic operations provide common simple manipulations such as add or subtract, which are performed on the data atomically with the option to return either the new value or the old value depending on which atomic function is used. Beyond these simple operations, some additional atomic operations are provided, specifically atomic compare and swap (CAS). CAS operations take a pointer to the data being worked on, as well as an old value and a new value. If the data in memory is equal to the old value, then it is set to the new value, otherwise the data is not modified. Since the data is not modified if it is not equivalent to the old value, this provides safety in the case where another thread modified the data first.
cost of the additional oversubscription on all processing units. With the current number of slots, how such an occurrence is managed is unlikely to have a significant impact because at that level of oversubscription the system will have already severely degraded performance.
2.5
Resource Partitioning
Partitioning the resources calculates the number of processing units each process will have based on the total number of both processing units and processes. Each process determines its rank, or relative position in the process array, compared to the other processes and calculates its portion of processing units using its rank. Partitioning reduces the overall amount of parallelism available by reducing the number of active workers, but in exchange provides each process with a set of workers with far fewer processes competing for the associated computational resources.
In cases where there are more parallel processes than processing units, the pro-cesses each get two workers: processing unit zero and one calculated based on the process rank. The process may be sharing its calculated processing unit with another process whose rank results in the same processing unit being calculated, and zero is shared by all the parallel processes. This is still a large reduction in contention for resources, however it is also a large reduction in available parallelism.
Once a process has added itself to the shared memory data structure, it broad-casts SIGUSR2to all other participating processes, which initiates a new partitioning calculation for all signaled processes. Since this is an expensive operation, it only occurs when a process starts and when a process terminates.
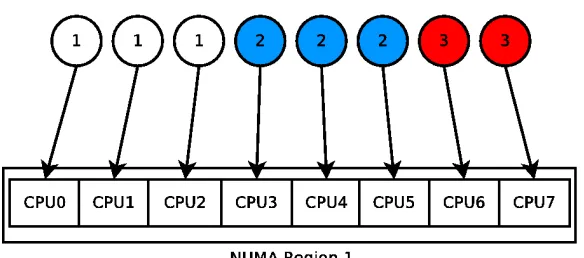
Figure 2.1: This is an example processing unit assignment for a single NUMA region configuration with three processes on an eight processing unit machine. Each circle is a process and the number is the process id, squares are processing units.
Figure 2.2: This is an example processing unit assignment for two NUMA regions with three processes on an eight processing unit machine. Each circle is a process and the number is the process id, squares are processing units.
one and ensures that every process retains at least one worker, plus worker zero. The system can handle more processes than processing units because the shepherd and worker indices are calculated such that after the worker-process relationship is one-to-one, processes will be oversubscribed incrementally and in order of the worker ID, as opposed to oversubscribing all processing units equally.
system, and CPU cycles spent on repartitioning instead of the application. When a worker is disabled, it does not immediately go inactive because it may be currently processing work. It is likely that for workers that stay active for a process through a repartition that the deactivation and reactivation flags will happen in close enough succession that the thread will never actually go inactive and will be unaffected by repartition thrashing.
The partitioning attempts to keep the workers for a process grouped together, giving them a higher probability of belonging to the same NUMA region, and thus able to take advantage of cache locality. The grouping is achieved by using the process rank and the number of shepherds and workers. First, the number of workers for each process is calculated by taking the total number of workers and evenly dividing it by the number of active processes. If there is a remainder from the division, x, the first
with the partitioning scheme is future work (see Section 6.2.2).
2.5.1 Worker Zero Constraint
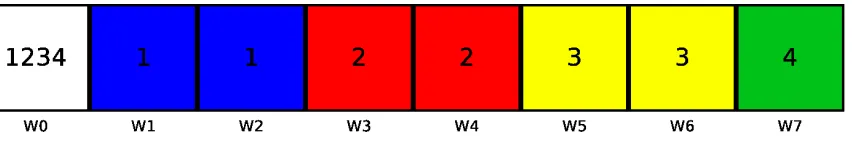
Figure 2.3: An example partitioning with four processes, eight processing units (labeled W0-W7), and the resulting oversubscription on worker zero.
2.6
Error Handling
Error handling has many challenges when dealing the multiple processes and shared memory. Without a centralized process, detecting if a process is still running is difficult and if a process crashes without triggering a repartition then the resources allocated for that process will not be reclaimed until a different process initiates a repartition or another process attempts to send the crashed process a signal.
One option is to create a daemon that checks each process periodically to ensure no one crashed and adjust the shared data structure accordingly. A daemon is a relatively robust option, but would require additional resources since it would be a standalone process. A daemon would need access to the shared memory section, or could replace it as a centralized mechanism for communication, but messages would still be signal based. Additionally, a daemon adds an additional layer to the communication: if process C starts, it would need to communicate to the daemon that a repartition is necessary and the daemon would then broadcast the message to all the other processes. Contrast this with process C starting and directly broadcasting its arrival. A daemon would also need a schedule to check the processes.
A second option is to have each process check on the other processes on a time interval. This would likely be in the form of an alarm, which introduces additional signal handling and processing into the system. This is very similar to the daemon approach but removes that daemon layer of message passing.
CHAPTER 3
TEST MACHINES
3.1
Variance of Environments
The problem and solution detailed in Chapters 1 and 2 were run on several different machines and software environments. The systems were chosen to represent common execution environments and to ensure the viability of the solution across operating systems, compilers, and hardware configurations. Four different operating systems were used in testing: Fedora, CentOS, and Ubuntu Linux distributions and OS X. Two servers, a desktop, and a laptop were used for testing.
3.2
Desktop
The desktop machine used for testing uses a Intel Core i7-960 quad core CPU with hyperthreading, which provides eight processing units operating at 3.2 Ghz and 12 GB of DDR3 1600 RAM. The operating system is Ubuntu 14.04, with kernel 3.13.0, and gcc version 4.8.4, fully updated as of April 17, 2016. All software used was installed from Ubuntu’s APT repository.
3.3
Laptop
The laptop used for testing is a 2015 MacBook Pro (MBP) 15” base model. This provides a 2.2 Ghz quad core Intel Core i7-4770HQ CPU with turbo boost up to 3.4 Ghz. This i7 also provides hyperthreading and eight processing units. The MBP has 16 GB of DDR3L 1600 RAM. The tests were run with a fully updated version of OS X 10.11, and used tools provided by the latest XCode package, including Apple LLVM version 7.3.0, as of April 17, 2016.
3.4
Shared Server
The shared server is a Linux server at Boise State University that is available to all Computer Science students. It represents a common usage case of a system shared by multiple users, where exclusive usage of the computational resources is not likely, and thus can impact the execution time of processes owned by other users. The shared server runs Fedora 22, with kernel 4.2.3, and has gcc version 5.1.1.
Ghz. The shared server has 32 GB of DDR3 1600 RAM.
3.5
Dedicated Server
CHAPTER 4
BENCHMARKS
4.1
Benchmark Selection
The benchmarks were selected as representations of common parallel application patterns. Unbalanced Tree Search creates a tree and visits each node, with each node visit being a new work task. This results in a large number of small tasks with the task computation being independent from other tasks. The High Performance Conjugate Gradient benchmark is a serial application that parallelizes loops with a smaller, set number of tasks, which is very common in scientific computing.
4.2
Unbalanced Tree Search
For all the tested implementations of UTS, every node is spawned as a task. When a node is visited, a counter is incremented that keeps track of the total number of nodes in the tree. The trees can grow very quickly with little variation in the branching factor and leaf probability, which results in massive time and memory requirements. Due to the rapid tree growth, a depth limit is additionally imposed on the trees to limit the number of nodes in the tree. When the depth limit is reached, it forces the current node to be a leaf node and the leaf probability routine is skipped.
The UTS benchmark was selected for testing because it produces a lot of work to execute and generates a large number of tasks (one per node in the tree), which keeps the processing units and the tasking scheduler busy. UTS itself does not intro-duce significant synchronization between tasks or threads, so it does not introintro-duce additional jitter delays due to synchronization.
4.2.1 Test Trees
Three tree sizes were selected to be used in testing with the single tree generation time/size selected to keep execution time reasonable, even when there are many parallel processes generating the trees. The sizes are distinguished as small, medium, and large. The size is adjusted by changing the branching factor and tree depths. Table 4.1 shows the values and sizes of the trees.
Table 4.1: UTS Tree Variables
Test Branching Factor Tree Depth Number of Nodes
small 5 55 871691
medium 5 70 24938666
4.3
High Performance Conjugate Gradient
High Performance Conjugate Gradient (HPCG) is a benchmark intended to behave like complex physics simulationsi [3]. HPCG generates a 3D matrix then itera-tively performs a set of operations on the matrix. These operations include sparse matrix-vector multiplication, vector updates, global dot-products, and more. The Qthreads implementation of HPCG parallelizes only the loops, making the benchmark a sequence of parallel and serial sections.
CHAPTER 5
RESULTS
The test results for UTS show that execution times of partitioning generally approxi-mate the Qthreads yielding option, usually executing faster than the yielding method. On the laptop, the execution time disparity is extreme, with partitioning being much faster. On the servers, partitioning is clearly faster on the dedicated server, but on the shared server partitioning did not provide an advantage over yielding until twelve or more concurrent processes were run.
5.1
Testing
The laptop and desktop were rebooted before testing to provide a fresh environment. Testing on all machines was done “out of the box,” meaning there was no special tun-ing done. Similarly, to keep testtun-ing representative of the average case, thread/process priorities were not changed for the test applications. For Qthreads, hwloc was used for the topology.
5.2
Qthreads Default Configuration
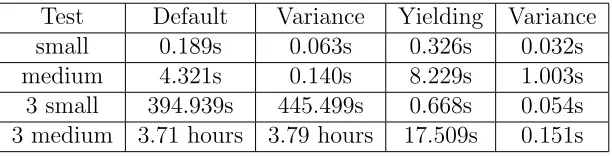
Table 5.1: Qthreads Default vs Yielding enabled Test Default Variance Yielding Variance
small 0.189s 0.063s 0.326s 0.032s
medium 4.321s 0.140s 8.229s 1.003s
3 small 394.939s 445.499s 0.668s 0.054s 3 medium 3.71 hours 3.79 hours 17.509s 0.151s
environments, common to high performance computing. The Qthreads default does well with single applications, but even three concurrent processes shows severe perfor-mance degradation. Single small tests had an average runtime of 0.189s, medium tests had an average runtime of 4.300s, and large tests had an average runtime of 9.242s. However, running three small-test processes simultaneously ballooned the average time to 394.939s, and varied with a minimum time of 138.130s and a maximum time of 583.629s. Running three medium-size processes proved even more dire, with an average of 3.71 hours, with a minimum of 1.05 hours, and a maximum of 4.85 hours. The difference between the minimum and maximum medium tests, 3.79 hours, and small tests, 445.499s are larger than the averages themselves. The variability shows that jitter is severely and nondeterministically impacting performance, and that the architecture of Qthreads may be good for single-process performance, but it clearly does not handle multi-process jobs well. Table 5.1 shows the compared execution times of small and medium sized, individual, and three-process UTS tests, averaged over eight runs on the desktop computer. The three process times are the time it took all three processes to execute. Large tree-generating tests are not included due to the amount of time necessary to execute three concurrent processes.
default performance, when oversubscribed, is untenable, growing from 0.189s for an individual, small test to 394.939s with just three processes, and taking almost four hours on average for three medium-size tests. Since Qthreads provides a yielding option, that will be the primary configuration used for comparison with partitioning.
5.3
UTS Results
5.3.1 Single UTS Process
0.000 5.000 10.000 15.000 20.000 25.000
small medium large
Exec
u
tio
n
T
im
e
(s
ecs
)
Tree Size
Desktop Single UTS Process Comparison
Default Partitioning Yielding
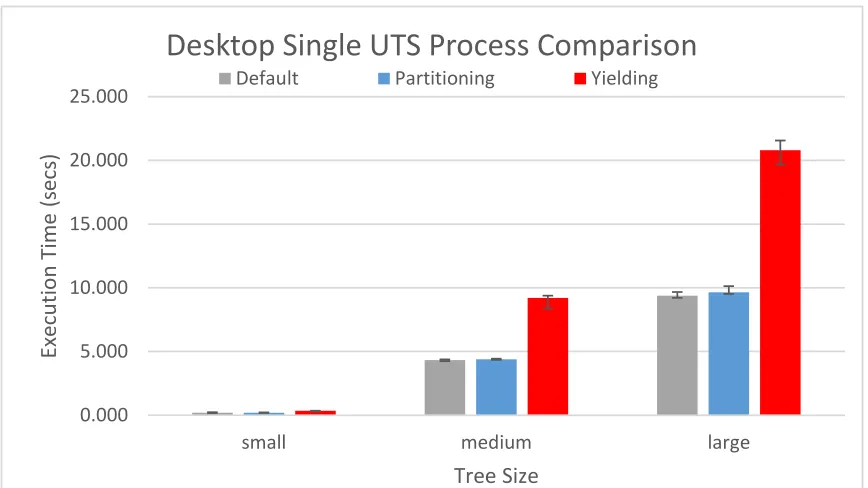
Figure 5.1: Single UTS process execution time using default, partition, and yielding options on the desktop.
Table 5.2: Desktop Single Test Variance Test Yielding Variance Partition Variance
small 0.032s 0.038s
medium 1.003s 0.090s
large 1.882s 0.607s
The single-process tests are the average of eight runs of tree generation for each tree size. Figure 5.1 shows the Qthreads default single-process performance compared to both yielding and partitioning, including the maximum and minimum execution times. This demonstrates that the overhead introduced by the standard yielding technique is substantial, while the single-process overhead of the partition scheme is minimal. Table 5.2 shows the variance between minimum and maximum execution times. Partitioning shows much less variance, which could indicate that there is less jitter due to the partitioning. However, the execution time difference makes yielding more susceptible to jitter just by having a larger time window available for system disruption.
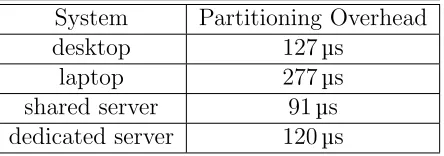
The overhead of the startup and shutdown of partitioning was timed to measure the average overhead for a single process. The combined overhead averaged between 91 to 277 microseconds across the four test systems. Table 5.3 shows the combined startup and shutdown times of each system, over eight single-process UTS tests.
Table 5.3: Single Process Partitioning Overhead System Partitioning Overhead
desktop 127µs
laptop 277µs
shared server 91µs
5.4
Three UTS Processes
0.000 0.100 0.200 0.300 0.400 0.500 0.600 0.700
desktop shared server dedicated server
Exe
cu
tion
T
im
e
(s
ecs
)
Test Machine
Three Small UTS Tree Test
Partition Yielding
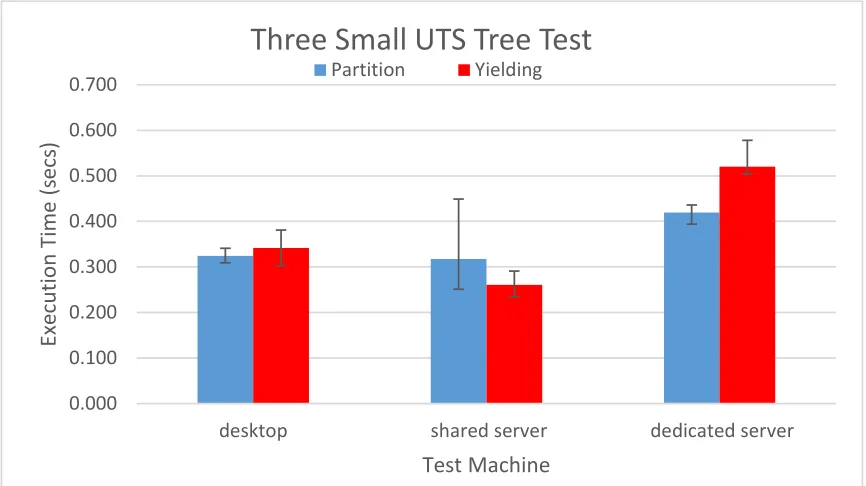
Figure 5.2: Total execution time of three UTS processes, in the small configuration, using partitioning and yielding. The black vertical lines represent the range of result values. Due to the variance of the execution times, the laptop results are shown in Figure 5.4.
For testing three UTS processes, three small-tree tests, three medium-tree tests, and three large-tree tests were run together. These tests were run on all four test systems.
Figure 5.2 shows the results of the three UTS process, small tree tests on the desktop, shared server, and dedicated server. Both the desktop and dedicated server show a performance edge to partitioning. However, the shared server had high variability with partitioning and was slower on average than yielding.
0.000 2.000 4.000 6.000 8.000 10.000 12.000 14.000 16.000 18.000 20.000
desktop shared server dedicated server
Exec
u
tio
n
T
im
e
(s
ecs
)
Test Machine
Three Large UTS Tree Test
Partitioning Yielding
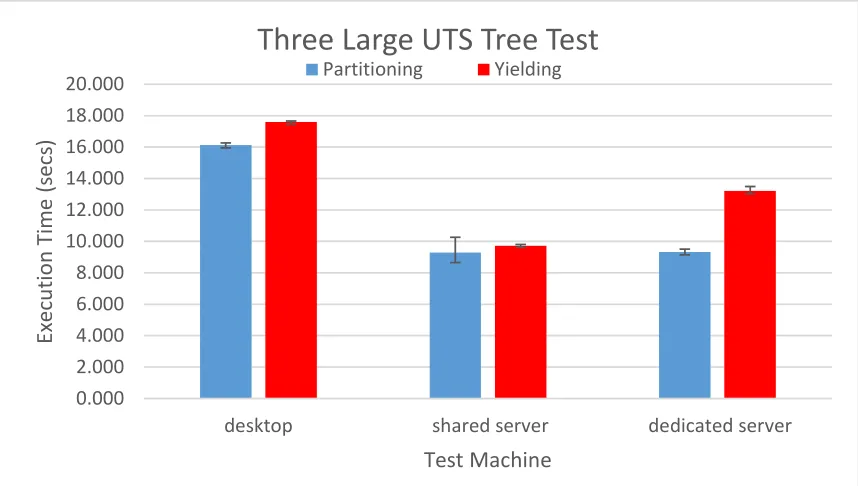
Figure 5.3: Total execution time of three processes, in the large configuration, using partitioning and yielding. The black vertical lines represent the range of result values.
5.4.1 Laptop UTS Oversubscription
Table 5.4: Laptop Three UTS Process Tests Tree Size Yielding Partition
small 6.008s 0.396s
medium 133.968s 9.130s large 296.364s 20.043s
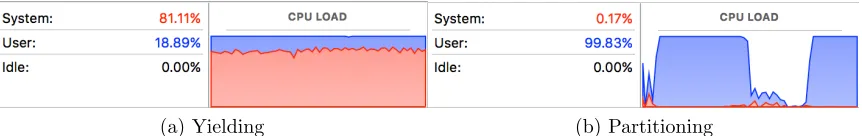
The OS X Activity Monitor, Figure 5.4, provides an indication that part of the reason for the slowdown using the yielding option is that the yield calls and context switching are dominating execution of the UTS benchmark code. Figure 5.4a shows only roughly 20% of CPU cycles is going to user code during execution of a test with the yielding option enabled. Compare that to Figure 5.4b, which shows almost 100% of resources being used for user code during execution with partitioning enabled.
(a) Yielding (b) Partitioning
Figure 5.4: The OS X Activity Monitor shows full resource utilization for both tests. However only roughly 20% is for user code when using yielding while partitioning has almost 100% user code utilization.
5.5
UTS Scaling
processes were run. The dedicated server was also tested with forty-two processes. A forty-two process test was not run on the shared server, due to it being shared with other students, and a forty-two process test would negatively impact anyone else on the system.
5.5.1 Desktop UTS Scaling Results
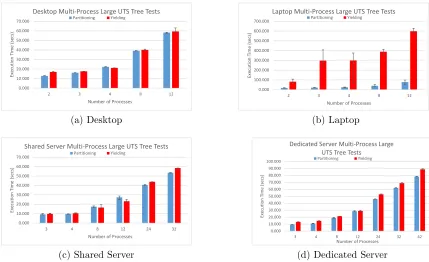
The desktop computer showed that resource partitioning consistently improved exe-cution time over yielding, with the exception of the four-process test. Due to worker zero being used for all processes using partitioning, a four-process test results in three of the processes getting two dedicated workers but, process four only gets one. This is because worker zero is active for all processes, so worker zero is not in the partitioning group of workers. Figure 5.5a shows the large test comparison results. Both the small and large tests follow a similar curve, with partitioning generally being faster than yielding by small margins, except for the four-process tests.
5.5.2 Laptop UTS Scaling Results
Similar to the three-process tests, the laptop results are heavily skewed due to its poor performance with the yielding option. Figure 5.5b shows the large tree UTS test comparison results. Partitioning is a clear winner, compared to yielding, in not just execution time, but also minimizing the variance in execution time between runs.
5.5.3 Shared Server UTS Scaling Results
0.000 10.000 20.000 30.000 40.000 50.000 60.000 70.000
2 3 4 8 12
Execu tio n T im e (s ecs )
Number of Processes
Desktop Multi-Process Large UTS Tree Tests Partitioning Yielding (a) Desktop 0.000 100.000 200.000 300.000 400.000 500.000 600.000 700.000
2 3 4 8 12
Exe cu tio n T im e (s ecs )
Number of Processes
Laptop Multi-Process Large UTS Tree Tests Partitioning Yielding (b) Laptop 0.000 10.000 20.000 30.000 40.000 50.000 60.000 70.000
3 4 8 12 24 32
Execu tio n T im e (s ec s)
Number of Processes
Shared Server Multi-Process Large UTS Tree Tests Partitioning Yielding
(c) Shared Server
0.000 10.000 20.000 30.000 40.000 50.000 60.000 70.000 80.000 90.000 100.000
3 4 8 12 24 32 42
Exec u tio n Ti m e (s ecs )
Number of Processes
Dedicated Server Multi-Process Large UTS Tree Tests
Partitioning Yielding
(d) Dedicated Server
Figure 5.5: Total execution time of large tests comparing partitioning and yielding.
machines in that it had two tests where partitioning was slower than the yielding option.
5.5.4 Dedicated Server UTS Scaling Results
Despite very similar hardware to the shared server, the dedicated server’s results are not very similar. Figure 5.5d shows the large UTS-tree test comparison results. The dedicated server results show a clear performance advantage to partitioning across all tests. Since the dedicated and shared servers are so similar in hardware, the difference between their results must be due to either other users on the shared server or the differences in the software environments.
5.5.5 UTS Scaling Conclusion
The scaling tests show that partitioning has a strong performance advantage with fewer processes and, with the exception of OS X, stays pretty close to the yielding results. Since partitioning is effectively reducing parallelism available to the appli-cations, this implies that reducing parallelism is better performing than the costs of oversubscription. This is true even when applications are reduced to two processing units, including worker zero, which is shared by all processes in the partitioning scheme.
the effect of yielding does not effectively mitigate the contention, allowing partitioning to maintain a lead by keeping contention minimal.
5.6
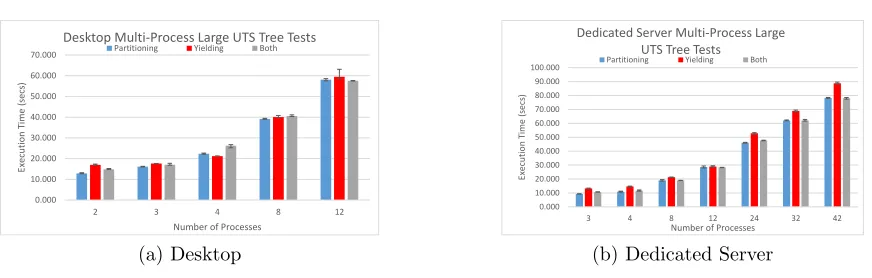
Partitioning with Yielding
0.000 10.000 20.000 30.000 40.000 50.000 60.000 70.000
2 3 4 8 12
Execu tio n T im e (s ec s)
Number of Processes
Desktop Multi-Process Large UTS Tree Tests Partitioning Yielding Both
(a) Desktop 0.000 10.000 20.000 30.000 40.000 50.000 60.000 70.000 80.000 90.000 100.000
3 4 8 12 24 32 42
Exec u tio n T im e (s ecs )
Number of Processes
Dedicated Server Multi-Process Large UTS Tree Tests Partitioning Yielding Both
(b) Dedicated Server
Figure 5.6: Total execution time of large tests on the desktop and dedicated server comparing partitioning, yielding, and enabling both.
5.7
OpenMP and Intel Threading Building Blocks UTS
Com-parison
In addition to testing Qthreads, Intel Threading Building Blocks and OpenMP were tested with UTS. Each was tested with single-process executions, for a baseline, then tested with three-process, three tree tests, then run with two, four, eight, and twelve binomial tree processes. These tests were run on the desktop computer.
0.000 10.000 20.000 30.000 40.000 50.000 60.000 70.000
1 2 3 4 8 12
Exec u tio n T im e (s ecs )
Number of Processes
Desktop Large UTS Tree Test Tasking Comparison Partitioning Yielding TBB OpenMP
(a) Execution time
0 2 4 6 8 10 12 14
1 2 3 4 8 12
Mu ltip le of Single Pro ce ss
Number of Processes
Normalized UTS Tasking Comparison Partitioning Yielding TBB OpenMP
(b) Normalized on single process execution time
Figure 5.7: Large test results comparison with TBB, OpenMP, Qthreads oversub-scribed, and Qthreads partitioning showing a comparison of raw execution time and execution time normalized to single-process execution time.
situations.
Intel’s Threading Building Blocks (TBB) offering clearly has a lot of work put into it, and the performance shows. Figure 5.7 shows the curves for OpenMP, TBB, Qthreads with yielding, and Qthreads with partitioning on the desktop computer in both raw execution time and normalized on single process execution time. The normalized graph shows TBB is linear and partitioning is super-linear. However, the normalized graphs for OpenMP and yielding, on the surface, show exceptional performance but that is an artifact of their poor single-process performance. TBB starts off with a sizeable performance advantage over Qthreads, on single-process execution, and maintains that lead through all testing. Monitoring the processing-unit load during OpenMP execution revealed that OpenMP was limited to the number of physical cores. It was not pinning processes to those cores causing execution to migrate across processing units, which is responsible for OpenMP having over seven seconds in variance on its eight large-test runs. The OpenMP curve shows that it struggles in single process performance, due to not utilizing all the processing units, but stays relatively flat as the number of processes increase.
5.8
Coming and Going
One of the benefits of partitioning is its dynamic nature, making it a better approach than manually tuning processes because processes can start with full system resources, give some up when another process starts, then regain them when the second process ends. To show this, a few tests were constructed that start with a large test then have additional tests added at intervals to see how the performance fared.
The interspersed process tests are:
• LM: Start a large test, wait for three seconds, then start a medium test.
• LSSS: Start a large test, wait three seconds, start a small test, wait two seconds, start another small test, wait two more seconds and start a final small test.
• LMMM: Start a large test, wait three seconds, start a medium test, wait two seconds, start another medium test, wait two more seconds and start a final medium test.
• LLLL: Start a large test, wait three seconds, start a large test, wait two seconds, start another large test, wait two more seconds and start a final large test.
Table 5.5: Interspersed Tests Test Name Partition Yielding
LM 10.843s 18.799s
LSSS 23.682s 20.489s
LMMM 15.218s 18.904s
LLLL 24.233s 27.084s
These results are expected, with partitioning generally being faster, which is consistent with other desktop results. However, the test with three small-tests in-terspersed resulted in very poor performance and reveals a big weakness in the partitioning: signal thrashing. What would happen is one small test would end at roughly the same time another one was starting, causing a lot of jitter due to signals, and also causing successive repartitions, which would harm the large test due to multiple repartitions.
5.9
HPCG Results
0.000 10.000 20.000 30.000 40.000 50.000 60.000 70.000 80.000 90.000 100.000
1 2 4 8
Exe
cu
tio
n
T
im
e
(s
ecs
)
Number of Processes
Desktop HPCG Tests
Default Partitioning Yielding
Figure 5.8: Total execution times of HPCG benchmark on the desktop comparing Qthreads default, partitioning, and yielding.
then parallelizes loops. Since HPCG is not alway parallel, the contention for resources is substantially reduced, because the parallel loop sections are unlikely to execute at exactly the same times, and thus won’t likely contend for resources.
0.000 20.000 40.000 60.000 80.000 100.000 120.000
1 2 4 8
Exe
cu
tio
n
T
im
e
(s
ecs
)
Number of Processes
Laptop HPCG Tests
Default Partitioning Yielding
Figure 5.9: Total execution times of HPCG benchmark on the laptop comparing Qthreads default, partitioning, and yielding.
Partitioning reduces parallelism for the application’s lifetime, regardless of the actual compute-resource contention. In the case of HPCG, this could work against partitioning in specific cases where the parallel loops of the concurrent processes do not overlap.
default configuration. Thus, the results include Qthreads default, the yielding option, and the partitioning scheme.
Figure 5.8 shows the HPCG results on the desktop. The yielding option is fastest for single process and is a very fast solution throughout. Partitioning is fastest for two and four processes, but is slower than the yielding option for one and eight.
0.000 20.000 40.000 60.000 80.000 100.000 120.000
1 2 4 8 12
Exe
cu
tio
n
T
im
e
(s
ecs
)
Number of Processes
Shared Server HPCG Tests
Default Partitioning Yielding
Figure 5.10: Total execution times of HPCG benchmark on the shared server comparing Qthreads default, partitioning, and yielding.
Figure 5.9 shows the results for the laptop. Partitioning is fastest for single and two process execution, but the yielding option has a strong performance advantage, compared to partitioning and the default configuration, at four and eight processes.
the yielding option, with partitioning still being faster than the default, but a distant second.
0.000 5.000 10.000 15.000 20.000 25.000 30.000
1 2 4 8 12
Exec
u
tio
n
Ti
m
e
(s
ecs
)
Number of Processes
Dedicated Server HPCG Tests
Default Partitioning Yielding
Figure 5.11: Total execution times of HPCG benchmark on the dedicated server comparing Qthreads default, partitioning, and yielding.
The dedicated server blazed through all the tests with single and two process being essentially a three-way tie. Four and eight process saw the default and partitioning be fastest, respectively, but not by significant margins. However, there was a lot of time variance for the yielding option, with four and eight processes, though its average was close to the others.
contention for resources as a benchmark like UTS. Instead, HPCG benefits from all processes being able to use all cores, since the contention does not increase with the number of processes as rapidly as UTS.
5.10
Multi-User
An additional user account was created on the desktop computer to test if the shared memory section could be used across user accounts. From another computer, two separate accounts were logged into on the desktop, viassh, and each one ran a single UTS large test with the default configuration and then with partitioning. The default configuration execution times were consistent with the previous desktop results.
Running with partitioning enabled had the same result. One issue was that of file permissions. While the shared memory section permission bits were set correctly, the two processes were still not able to both open the shared memory section. Putting both users in the same group fixed this. However, there remained another issue: users cannot send signals to processes owned by other users.
It may be possible to set the CAP KILL capability on the processes, or find some other way around this limitation. However, the concept of being able to send signals to another user’s processes is probably a bad idea and has many security implications. By changing the partition model to polling on changes in the shared memory section, sending signals could be avoided completely, but that would harm performance to gain a functionality that would be little, if ever, used.
CHAPTER 6
FUTURE WORK
6.1
Code
The implementation is complete and functional, however that does not mean the work is completely finished. The following items are still left to complete regarding the code.
• Logging: Simple logging to a file was implemented solely for the partitioning. Qthreads provides its own logging structure, so the partition implementation should be converted to use the regular Qthreads logging infrastructure.
• Merge with Qthreads Github repository: The code has not been merged into the Sandia National Labs git repository on Github.
6.2
Research
6.2.1 Resource Donation
thus its workers are sitting idle. Since the process could be aware of its resource utilization, and since the partitioning scheme allows for communication across pro-cesses, it is possible a process with underutilized workers could donate a worker to a process that is in need of workers. Since the donating process would be the one with underutilized workers, the overhead of selecting a participating process to donate to would have little impact on the donating process. Additionally, since a donation would not be a repartition, it would have very little impact on the process receiving the donation.
Resource donation can happen when a worker doesn’t have work to perform and can then donate a resource to another process, as long as the donating process retains at least one worker after the donation. To perform this, the donating process deactivates the worker to be donated, then iterates over the process array in shared memory until it finds a negative value (indicating that process is in need of resources). Once the receiving process is identified, the donating process copies the receiving processes’ shared memory array entry, then sets the MSB to zero, and sets the worker ID field to the worker being donated. Finally, a compare and swap is done with the original value. If the compare and swap is successful, the donating process will then
send SIGUSR1 to the receiving process to notify it that it can activate the worker.
Additionally, when a process finishes execution and callsfinalizeon the Qthreads library, the process will signal for a repartition.
6.2.2 Worker Allocation
calculation to change the grouping such thatnconsecutive worker IDs are mapped to consecutive processing units on a single shepherd, only crossing shepherd boundaries as necessary, instead of a round-robin shepherd assignment should not be necessarily difficult, but needs thorough testing for consistency and robustness across different topologies.
6.2.3 Unshackle Worker Zero
All processes being required to keep worker zero active was a strong restriction that undoubtedly hurt performance, due to oversubscription of worker zero. Allowing processes to enable and disable worker zero would reduce contention for all processes. Disabling worker zero may be possible if it is re-enabled before Qthreads is shut down. The first thing the Qthreads finalize function does is identify worker zero and only worker zero completes the cleanup using the parent thread. Thus, worker zero would need to be re-enabled before the Qthreads finalize function is called and the parent thread needs to be migrated back to worker zero.
Additionally, the protections around disabling worker zero also apply to shepherd zero. If the worker allocation from Section 6.2.2 is implemented, this could result in a shepherd being disabled, which should be a better solution, but will certainly have consequences not yet identified.
6.2.4 Benchmarks and Testing
Livermore Unstructured Lagrangian Explicit Shock Hydrodynamics (LULESH) [8], which is implemented with Qthreads in the benchmarks directory.
6.2.5 Tuning
There are some aspects of the partition implementation that could be fine tuned for better performance. For example, it allows for 511 process entries in the shared data structure, which means that for every partition and check that other processes are still active (error handling) the iteration over the array is all 511 elements. However, it is unlikely that this will be run in an environment with 511 processes on a single machine (in fact, server testing only reached a maximum of 42 processes) so that iterating over the shared array can be done more quickly. 511 was chosen to use a full page of memory, and provide scalability, so further testing could be done to bring this number down.
Similarly, the shared array uses int64 t for the array data, which allows for extensibility such as, but not limited to, resource donation, even though process IDs are a uint32 t. Changing the type to a uint32 t would make the data array much more compact, allowing either further scaling or just reducing the memory footprint. However, this does limit the extensibility, unless the shared data structure is altered.
6.2.6 Error Handling
CHAPTER 7
CONCLUSION
This work conclusively shows that partitioning computational resources across con-current parallel applications using the same tasking library shows an improvement in execution time. For the UTS benchmark, the performance of the default Qthreads configuration in a multi-process environment was severely impacted. However, the yielding feature brings the execution time closer to partitioning, even out-performing it in certain cases. For the HPCG benchmark, partitioning still performs very well, being the fastest in many cases, but cannot keep up with the yielding option in the eight-process tests. The yielding option brings downsides, such as poor single-process performance, and turning yielding on requires recompiling the tasking library. In contrast, partitioning maintains default Qthreads performance for single-process ex-ecution and often better performance than yielding, making it an ideal feature that can be turned on and left on with no discernible downside compared to the other options.
REFERENCES
[1] P. De, R. Kothari, and V. Mann. Identifying sources of operating system jitter through fine-grained kernel instrumentation. In Cluster Computing, 2007 IEEE International Conference on, pages 331–340, Sept 2007.
[2] GCC. Atomic builtins - using the gnu compiler collection (gcc). https://
gcc.gnu.org/onlinedocs/gcc-4.5.0/gcc/Atomic-Builtins.html. Accessed:
2016-03-18.
[3] HPCG. HPCG: High performance conjugate gradient benchmark. http://www.
hpcg-benchmark.org/. Accessed: 2016-04-04.
[4] C. Iancu, S. Hofmeyr, F. Blagojevi, and Y. Zheng. Oversubscription on multicore processors. InParallel Distributed Processing (IPDPS), 2010 IEEE International Symposium on, pages 1–11, April 2010.
[5] Apple Inc. https://developer.apple.com/library/mac/documentation/
Darwin/Conceptual/KernelProgramming/scheduler/scheduler.html.
Ac-cessed: 2016-04-03.
[6] Intel. Intel threading building blocks. https://software.intel.com/en-us/
tbb-documentation. Accessed: 2016-02-14.
[7] Intel. Intel threading building blocks - appendix a costs of time slicing. https:
//software.intel.com/en-us/node/506127. Accessed: 2016-04-14.
[8] Lawrence Livermore National Laboratory. Livermore unstructured lagrangian explicit shock hydrodynamics (lulesh). https://codesign.llnl.gov/lulesh. php. Accessed: 2016-04-04.
[9] T. J. LeBlanc and E. P. Markatos. Shared memory vs. message passing in shared-memory multiprocessors. In Parallel and Distributed Processing, 1992. Proceedings of the Fourth IEEE Symposium on, pages 254–263, Dec 1992.
[10] Chuanpeng Li, Chen Ding, and Kai Shen. Quantifying the cost of context switch.
InProceedings of the 2007 Workshop on Experimental Computer Science, ExpCS
[11] Rose Liu, Kevin Klues, Sarah Bird, Steven Hofmeyr, Krste Asanovi´c, and John Kubiatowicz. Tessellation: Space-time partitioning in a manycore client os.
In Proceedings of the First USENIX Conference on Hot Topics in Parallelism,
HotPar’09, pages 10–10, Berkeley, CA, USA, 2009. USENIX Association. [12] POSIX Programmer’s Manual. PTHREAD MUTEX LOCK(P), 2003. Accessed:
2016-03-28.
[13] POSIX Programmer’s Manual. SEM OVERVIEW(7), May 2012. Accessed: 2016-03-28.
[14] Open MPI. Portable hardware locality (hwloc). https://www.open-mpi.org/
projects/hwloc/. Accessed: 2016-04-14.
[15] K. J. Nesbit, M. Moreto, F. J. Cazorla, A. Ramirez, M. Valero, and J. E. Smith. Multicore resource management. IEEE Micro, 28(3):6–16, May 2008.
[16] Stephen L. Olivier, Allan K. Porterfield, Kyle B. Wheeler, and Jan F. Prins. Scheduling task parallelism on multi-socket multicore systems. In Proceedings of the 1st International Workshop on Runtime and Operating Systems for Super-computers, ROSS ’11, pages 49–56, New York, NY, USA, 2011. ACM.
[17] OpenMP. Openmp application programming interface. http://www.openmp.
org/mp-documents/openmp-4.5.pdf. Accessed: 2016-02-14.
[18] J. H. Schonherr, J. Richling, and H. U. Heiss. Dynamic teams in openmp. In Computer Architecture and High Performance Computing (SBAC-PAD), 2010 22nd International Symposium on, pages 231–237, Oct 2010.
APPENDIX A
IMPLEMENTATION CODE
Listing A.1 shows the core implementation code for the partitioning. The partitioning has an initialization called at startup that creates the shared memory section and then signals the other participating processes to partition. Similarly, there is a cleanup function that also tells the other participating processes to partition but unlinks the shared memory section and closes all open files. These functions are called in the Qthreads initialize and finalize functions, respectively. This file also contains the signal handling for the partition scheme, the struct held in the shared memory, and the first pass at two functions for resource donation beyond just the partitioning.
Beyond the partition source file, there were some minor updates to the Qthreads code. Listing A.2 shows the updated wait-loop uses a blocking read to wait for parti-tioning instead of the spinlock. Similarly, Listing A.3 shows the updatedenable worker
function that uses a write to a pipe to enable the worker.
This implementation could be reused for other applications and tasking libraries with little modification. However, it was necessary to use some data internal to Qthreads so this is specific to the Qthreads tasking library and is not a generic implementation.
Listing A.1: partition.c
1 # i n c l u d e < s t d i o . h >
3 # i n c l u d e < sys / m m a n . h >
4 # i n c l u d e < f c n t l . h >
5 # i n c l u d e < u n i s t d . h >
6 # i n c l u d e < sys / s t a t . h >
7 # i n c l u d e < i n t t y p e s . h >
8 # i n c l u d e < e r r n o . h >
9 # i n c l u d e < s i g n a l . h >
10 # i n c l u d e < u n i s t d . h >
11
12 # i n c l u d e ‘ ‘ p a r t i t i o n . h ’ ’
13 # i n c l u d e ‘ ‘ q t h r e a d . h ’ ’
14 # i n c l u d e ‘ ‘ q t _ s h e p h e r d _ i n n a r d s . h ’ ’
15 # i n c l u d e ‘ ‘ q t h r e a d _ i n n a r d s . h ’ ’
16
17 // u s e d 5 1 1 as l i m i t to k e e p s h a r e d d a t a s t r u c t u r e w i t h i n a s i n g l e p a g e .
18 # d e f i n e M A X _ F I M _ P R O C 511
19 # d e f i n e V E R B O S E 0
20 // p r o c s e n c o d i n g :
21 // 63 s t a t u s
22 // 3 2 : 6 2 m a i l b o x
23 // 0 : 3 1 p i d
24
25 // b i t e n c o d i n g s
26 # d e f i n e F I M _ M S B _ 0 0 x 7 F F F F F F F F F F F F F F F
27 # d e f i n e F I M _ M S B _ 1 0 x 8 0 0 0 0 0 0 0 0 0 0 0 0 0 0 0
28 # d e f i n e F I M _ L O W 0 x 0 0 0 0 0 0 0 0 F F F F F F F F
29 # d e f i n e F I M _ H I G H 0 x F F F F F F F F 0 0 0 0 0 0 0 0
30
31 t y p e d e f s t r u c t f i m _ t {
32 u i n t 6 4 _ t n u m _ p r o c s ;
33 i n t 6 4 _ t p r o c s [ M A X _ F I M _ P R O C ];
34 } f i m _ t ;
35
36 // v a r i a b l e s
37 s t a t i c u i n t 3 2 _ t m y _ r a n k ;
38 s t a t i c int fd ;
39 s t a t i c int i n i t e d = 0;
40 s t a t i c u i n t 3 2 _ t n u m _ a c t i v e _ p r o c s = 0;
41 s t a t i c f i m _ t * fim = N U L L ;
42 // f i m _ l o g g i n g
43 F I L E * f i m _ l o g = N U L L ;
44
45 // f u n c t i o n s
46 s t a t i c v o i d s i g n a l _ h a n d l e r ( int ) ;
47 s t a t i c v o i d d o n a t e _ a l l ( v o i d ) ;
48 s t a t i c v o i d g e t _ r e s o u r c e s ( v o i d ) ;
49 s t a t i c v o i d p u l s e ( v o i d ) ;
50 s t a t i c v o i d i n i t _ r e p a r t ( v o i d ) ;
51
52 int i n i t _ p a r t i t i o n () {
54 // i n i t p i p e s
55 for ( int x = 0; x < qlib - > n s h e p h e r d s ; x ++) {
56 for ( int y = 0; y < qlib - > n w o r k e r s p e r s h e p ; y ++) {
57 int f i d s [ 2 ] ;
58 if ( p i p e ( f i d s ) < 0) {
59 f p r i n t f ( stderr , ’ ’ U n a b l e to c r e a t e p a r t i t i o n pipes , r e v e r t i n g to d e f a u l t b e h a v i o r \ n ’ ’ ) ;
60 r e t u r n -1;
61 }
62 qlib - > s h e p h e r d s [ x ]. w o r k e r s [ y ]. r e a d _ p i p e _ f d = f i d s [ 0 ] ;
63 qlib - > s h e p h e r d s [ x ]. w o r k e r s [ y ]. w r i t e _ p i p e _ f d = f i d s [ 1 ] ;
64 f c n t l ( qlib - > s h e p h e r d s [ x ]. w o r k e r s [ y ]. w r i t e _ p i p e _ f d , F_SETFL , O _ N O N B L O C K ) ;
65 }
66 }
67 // s e t u p s i g n a l h a n d l e r s
68 if ( s i g n a l ( SIGUSR1 , s i g n a l _ h a n d l e r ) == S I G _ E R R ) {
69 p r i n t f ( ‘ ‘ u n a b l e to r e c e i v e s i g n a l s (1) \ n ’ ’ ) ;
70 r e t u r n -1;
71 }
72 if ( s i g n a l ( SIGUSR2 , s i g n a l _ h a n d l e r ) == S I G _ E R R ) {
73 p r i n t f ( ‘ ‘ u n a b l e to r e c e i v e s i g n a l s (2) \ n ’ ’ ) ;
74 r e t u r n -1;
75 }
76 // c r e a t e a n d i n i t s h a r e d m e m o r y
77 if ( V E R B O S E ) {
78 p r i n t f ( ‘ ‘ o p e n i n g s h a r e d m e m o r y \ n ’ ’ ) ;
79 }
80 if (( fd = s h m _ o p e n ( ‘ ‘/ fim ’ ’ , O _ R D W R | O_CREAT , 0 6 6 6 ) ) < 0) {
81 p r i n t f ( ‘ ‘ fd is n e g a t i v e \ n ’ ’ ) ;
82 r e t u r n -1;
83 }
84 s t r u c t s t a t * s t a t s = c a l l o c (1 , s i z e o f ( s t r u c t s t a t ) ) ;
85 f s t a t ( fd , s t a t s ) ;
86 if (0 == stats - > s t _ s i z e ) {
87 // p r i n t f ( ‘ ‘ fd is % d , f i l e s i z e is % l l d \ n ’ ’ , fd , stats - > s t _ s i z e ) ;
88 if ( -1 == f t r u n c a t e ( fd , s i z e o f ( f i m _ t ) ) ) {
89 // p r i n t f ( ‘ ‘ f t r u n c a t e f a i l e d % s \ n ’ ’ , s t r e r r o r ( e r r n o ) ) ;
90 // r e t u r n -1;
91 }
92 }
93 f r e e ( s t a t s ) ;
94 fim = m m a p ( NULL , s i z e o f ( f i m _ t ) , P R O T _ R E A D | P R O T _ W R I T E , M A P _ S H A R E D , fd , 0) ;
95 if ( M A P _ F A I L E D == fim ) {
96 p r i n t f ( ‘ ‘ m m a p f a i l e d \ n ’ ’ ) ;
97 r e t u r n -1;
98 }
99 p i d _ t m y _ p i d = g e t p i d () ;
100 // e f f e c t i v e l y i g n o r e r e t v a l s i n c e t h a t ’ s n o t g u a r a n t e e d to be r a n k
101 m y _ r a n k = _ _ s y n c _ f e t c h _ a n d _ a d d (&( fim - > n u m _ p r o c s ) ,1) ;
102 // T h e r e m a y be g a p s in t h e a r r a y f r o m p r o c e s s e s
103 // so t r y to f i l l t h o s e f i r s t