rsif.royalsocietypublishing.org
Research
Cite this article:
Trnka M, Hlavinka P,
Semenov MA. 2015 Adaptation options for
wheat in Europe will be limited by increased
adverse weather events under climate change.
J. R. Soc. Interface
12
: 20150721.
http://dx.doi.org/10.1098/rsif.2015.0721
Received: 11 August 2015
Accepted: 21 October 2015
Subject Areas:
environmental science, biometeorology
Keywords:
climate change, extreme events, food security,
winter wheat
Author for correspondence:
Miroslav Trnka
e-mail: mirek_trnka@yahoo.com
Electronic supplementary material is available
at http://dx.doi.org/10.1098/rsif.2015.0721 or
via http://rsif.royalsocietypublishing.org.
Adaptation options for wheat in Europe
will be limited by increased adverse
weather events under climate change
Miroslav Trnka
1,2, Petr Hlavinka
1,2and Mikhail A. Semenov
31Global Change Research Centre AS CR v.v.i., Beˇlidla 986/4b, Brno 60300, Czech Republic
2Institute of Agrosystems and Bioclimatology, Mendel University in Brno, Zemeˇdeˇlska´ 1, Brno 61300,
Czech Republic
3Department of Computational and Systems Biology, Rothamsted Research, Harpenden AL5 2JQ, UK
Ways of increasing the production of wheat, the most widely grown cereal crop, will need to be found to meet the increasing demand caused by human population growth in the coming decades. This increase must occur despite the decrease in yield gains now being reported in some regions, increased price volatility and the expected increase in the frequency of adverse weather events that can reduce yields. However, if and how the frequency of adverse weather events will change over Europe, the most important wheat-growing area, has not yet been analysed. Here, we show that the accumulated prob-ability of 11 adverse weather events with the potential to significantly reduce yield will increase markedly across all of Europe. We found that by the end of the century, the exposure of the key European wheat-growing areas, where most wheat production is currently concentrated, may increase more than twofold. However, if we consider the entire arable land area of Europe, a greater than threefold increase in risk was predicted. Therefore, shifting wheat production to new producing regions to reduce the risk might not be possible as the risk of adverse events beyond the key wheat-growing areas increases even more. Furthermore, we found a marked increase in wheat exposure to high temperatures, severe droughts and field inaccessibility com-pared with other types of adverse events. Our results also showed the limitations of some of the presently debated adaptation options and demon-strated the need for development of region-specific strategies. Other regions of the world could be affected by adverse weather events in the future in a way different from that considered here for Europe. This observation empha-sizes the importance of conducting similar analyses for other major wheat regions.
1. Introduction
The 70% increase in food production by 2050 required to feed a population over 9 billion [1] puts pressure on the production of sufficient amount of high-qual-ity food in a sustainable way [2]. At the same time, ongoing climate change with warming trends across the globe has resulted in increased climate variability and extremes [3 –6], although high uncertainty remains in the relationship between global warming and variability [7]. There is serious concern about dete-riorating food quality [8] and abnormally high volatility in food prices arising from their close connection to the price of crude oil [2]. Challinoret al.[9] esti-mated that, for 28C of local warming without adaptation, losses in aggregate production could be expected for wheat, rice and maize in both temperate and tropical regions, while using available adaptation options may lead to a 7–15% yield increase. Such yield increases would fall short of the 70% required. The majority of existing studies [9] do not fully consider the impacts of adverse weather events (i.e. conditions capable of causing severe yield reductions). While there has been an effort to increase the reliability of future yield predictions
through the use of ensembles of crop models [10], these models still do not incorporate the effects of most adverse weather events. The same is true for design of wheat ideotypes (and breeding priorities) for target environments [11].
In this study, we seek to answer the following research question: ‘To what extent will climate change alter the probabi-lity of those adverse weather events that can be detrimental to wheat production?’ The study is focused on wheat as the most widely grown crop in terms of harvested area [12]. Wheat provides approximately 20% of total human calorie con-sumption [13]. World trade in wheat is greater than for all other crops combined and, in terms of the total production tonnages used for food, it is currently second to rice as the main human food crop and is the leading source of vegetable protein in human food [8]. The area covered by the study (figure 1) rep-resents almost one-third of global wheat production and exports [13]. Production (depending on the region) is being affected by high temperatures, occurrences of drought, late spring frosts and severe winter frosts associated with inadequate snow cover, lodging, waterlogging and field acces-sibility during key field operations [15]. This study employs recently developed methodology applicable for the assessment of combined probability of multiple adverse events affecting wheat production [14] with local-scale climate scenarios based on two selected Global Circulation Models (GCMs) from the most up-to-date CMIP5 [16] multi-model ensemble. Realizing the critical importance of European growing areas [15], we also tested the potential benefits of some of the adaptation strategies.
2. Results
2.1. Change in the adverse event probability and
dominant type
Under the present climate, the probability of a single adverse event is lower than 20% (i.e. once every 5 years) over the wheat-growing area that delivers 80% of the wheat in Europe (figure 2a,d). The core areas producing more than one-half of all European wheat are faced with some type of adverse event at least once every 10 years (figure 2a). Under both RCP4.5 and RCP8.5 scenarios, the probability of a single adverse event is predicted to increase considerably (figures 2 and 3). Under the HadGEM-RCP8.5 climate scenario, by 2090 only 10% of European wheat production would be affected by a single adverse event less than once every 10 years, while one-half of the arable land area of Europe would be affected at least once every 2 years (figure 2f). There is a significant difference in the probabilities of a single adverse event between climate scenarios based on RCP4.5 and RCP8.5, with the latter showing a much greater increase in risk (figure 3). There are also considerable differences (figures 2 and 3) in the prob-abilities of a single adverse event between climate scenarios based on the low-climate-sensitivity model (GISS) and the high-climate-sensitivity model (HadGEM). However, even a relatively ‘favourable’ climate scenario based on projections from GISS for RCP4.5 indicates a notably higher overall adverse event frequency. Figure 3a,bshows that the key areas where the majority of European wheat is produced today are
0 250 500 1000km
0 250 500 1000km
0 250 500 1000km
0 250 500 1000km
0 250 500 1000km
0 250 500 1000km
<5.0
(a–c) (d–f) <1.0%
> 50.0% 1.1 – 5.0 5.1 – 10.0 10.1 – 25.0 25.1 – 50.0 drought
field inaccessibility high temperatures low temperatures water excess/lodging 5.1 – 10.0
10.1 – 25.0 25.1 – 50.0 50.1 – 100.0
0.001 0–0.025 0.026–0.05 0.051–0.1 0.101–0.2
0.201–0.4 0–0.10 0.11–0.25 0.26–0.50 0.51–0.75 > 0.75 0.401–0.6
>0.6 (g)
(h)
0.025 0.05 0.10 0.15 0.20 0.25 0 250 500 1000
km
0 250 500 1000 km
–10˚ 0˚ 10˚ 20˚ 30˚ 40˚ –10˚ 0˚ 10˚ 20˚ 30˚ 40˚ –10˚ 0˚ 10˚ 20˚ 30˚ 40˚
40˚ 50˚ 60˚ 40˚ 50˚ 60˚
(b)
(a) (c)
(d)
(g) (h)
(e) (f)
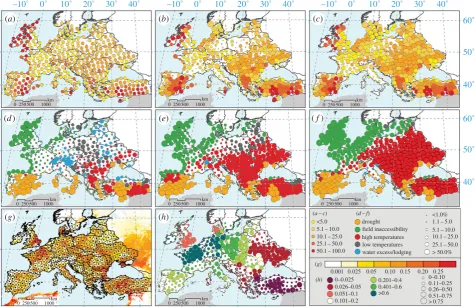
Figure 1.
Combined probability of a single adverse event over (
a
) the baseline, (
b
) GISS-RCP8.5 and (
c
) HadGEM-RCP8.5 scenarios with the size of the circle
corresponding to the relative change compared to the baseline. (
d
) The dominant type of adverse event for the baseline, (
e
) for GISS-RCP8.5 and (
f
) for
HadGEM-RCP8.5 with the size of the circle corresponding to the event frequency. (
g
) Proportion of wheat area in each grid (colour) in Europe based on Monfreda
et al.
[14] with the locations of 379 sites used in the study (thin lines are Thiesen polygons). (
h
) Colour-coding corresponds to the share of European wheat
production per polygon, and the size of the circle corresponds to the proportion of the European wheat area represented by the polygon. Baseline
(1981 – 2010) and climate scenarios (2081 – 2100).
rsif.r
oy
alsocietypublishing.org
J.
R.
Soc.
Interfa
ce
12
:
20150721
less vulnerable to changes in the frequency of adverse weather events compared with the entire arable land area. At present, therefore, most European wheat is grown in areas with a lower risk of adverse events relative to European arable land as a whole. Despite this, the exposure of the major wheat-producing areas to adverse events is predicted to increase more than twofold for the RCP8.5 and HadGEM model com-pared with a threefold increase over the entire available area of Europe’s arable land.
Field inaccessibility under current conditions is indicated to be the most frequent limitation for wheat production over much of the northwestern coastal area of the continent and the UK. Drought is estimated to be the major limiting factor for wheat growth in parts of the Mediterranean, with heat stress affecting parts of southeastern Europe and Turkey. According to our estimates, water excess and lodging risk, together with the occurrence of low temperatures, are the major concerns in central and northeastern Europe (figure 1d). Future climatic conditions by the end of the century (2081–2100) based on the RCP8.5 emission scenario would lead to not only a sharp increase in the probability of these events, as discussed, but also more distinct regionalization of the dominant adverse events, with the northwestern coast being even more affected by field inaccessibility and almost all of southeastern and central Europe being affected by a significant increase in exposure to high temperatures (figure 1e,f). Drought would remain dominant on the Iberian Peninsula and in parts of Turkey. The major difference between the HadGEM and GISS scenarios (figure 1f,e) is that the former would bring a more significant increase in adverse weather events for the most productive areas indicated in figure 2.
2.2. Implications for adaptation strategies
One of the adaptation strategies for reducing the risk of adverse weather events is stress avoidance through shifts in either time
or space. Avoidance in time could be achieved by using early ripening cultivars to escape heat or drought stress or moving the focus of production elsewhere. However, electronic supplementary material, appendix figure S1 shows that this avoidance strategy would lead to a lower sum of effective global radiation (EfGr—see the electronic supplementary material, appendix for a more detailed description) intercepted by the crop, decreasing yield potential (unless the radiation-use efficiency of the crop were significantly improved). Under future climate scenarios, not only was the EfGr reduced by shift-ing the wheat-growshift-ing season to a period of shorter days, but droughts also became more frequent and prolonged, especially in south and southeast Europe (electronic supplementary material, appendix figure S1).
Avoidance in space could be achieved by shifting wheat pro-duction to new growing areas which could potentially be less endangered by the projected increase in adverse event frequency. While regions with very small or even no change in the adverse event frequency can be found (figure 3a–c), overall the most important wheat-producing areas will be faced with an up to twofold increase for the RCP8.5 and HadGEM models. How-ever, the increase in the adverse event frequency over the entire available area of arable land in Europe is more than three-fold compared with the present conditions. This indicates that shifting wheat production to areas not currently used for wheat would lead to an even higher probability of adverse events (figure 1). Therefore, growing wheat predominantly in the present growing area (and adaptation to the increase in the frequency of adverse events) seems to be the most likely scenario. We also assessed the strategy that would be focused on maximizing the EfGr by maintaining the length of the growing period, using late-maturing cultivars, and we asked whether this strategy would lead to an increased exposure to adverse weather events (figure 3). Obviously, different-maturing culti-vars are used in different regions based on multiple factors and operational requirements. In electronic supplementary
0 0 20 40 60 80 100
20 40 60 80 100
probability of 1 adv
erse e
v
ent (%)
affected wheat production (%) baseline
0 20 40 60 80 100
affected wheat production (%) HadGEM_RCP8.5
20
0 40 60 80 100
affected wheat production (%) GISS_RCP8.5
0 0 20 40 60 80 100
20 40 60 80 100
probability of 1 adv
erse e
v
ent (%)
affected arable land area (%) baseline
0 20 40 60 80 100
affected arable land area (%) GISS_RCP8.5
0 20 40 60 80 100
affected arable land area (%) HadGEM_RCP8.5
(b)
(a) (c)
(d) (e) (f)
Figure 2.
Cumulative probability of the occurrence of a single adverse event during wheat-growing season under baseline and projected climate scenarios as a
function of (
a – c
) the affected wheat production, and (
d – f
) the arable land area. (
a,d
) represent the baseline period (1981 – 2010) and (
b,c,e,f
) climate scenarios
(2081 – 2100) for low-sensitivity GISS (
b,e
) and high-sensitivity HadGEM (
c,f
) climate models for RCP8.5. A medium-ripening cultivar was used in the simulations.
rsif.r
oy
alsocietypublishing.org
J.
R.
Soc.
Interfa
ce
12
:
20150721
material, appendix figure S2g–i, we selected, for each growing season, the cultivar that had the lowest risk of adverse events without significantly reducing the total EfGr. The use of early maturing cultivars in the Mediterranean and southeast-ern Europe under the model’s future climate (i.e. 2081–2100) resulted in a significant reduction of adverse events compared to the medium cultivars, while the late-maturing cultivars performed the best at some sites. However, as the electronic supplementary material, appendix figure S2d–f shows, the stress avoidance strategy only partly succeeded in reducing the exposure of the wheat crop to the adverse events, and the overall risk would still be far greater than under present con-ditions. Opting for this strategy would also mean a decrease of the EfGr available for wheat growing in what would then be the most productive regions of Europe, resulting in a decrease in yield potential (electronic supplementary material, appendix figure S1h).
3. Discussion
Existing studies estimating the effect of climate change on pro-duction (e.g. [9,17]) rely either on the set of empirical models or process-based crop models that are not primarily optimized to recognize the impacts of most of adverse events that were
considered here. This is the case for the former class of models because of their reliance on monthly or seasonal data; this is also the case for the latter class because the model algor-ithms do not account fully (or at all) for the effects of these adverse events, which in reality can cause major yield decreases. While there has been great effort focused on crop model improvement (e.g. [10]), there has to date not been a con-certed effort focusing on the adverse weather events relevant to wheat as such. Even now, targeting genotypes that provide good matches to environments still relies on monthly or even seasonal climatological parameters (e.g. [11]) and does not reflect the baseline frequency of adverse events. In those cases where research focuses on extreme/adverse weather, there seems to be a bias towards certain types of these events, which are then addressed in detail without considering other coexisting potential threats. In recent years, substantial research efforts have focused on the effect of drought and especially of heat stress (e.g. [4,18,19]). However, it is well known that wheat production is affected by not only the fre-quency of days with high temperatures but also the occurrence of late frosts and severe frosts without adequate snow cover or by overly wet and cool weather, which enhances the occurrence of diseases, contributes to lodging and makes crop management more difficult. Many efforts have also been (rightly) focused on those regions of the world where the understanding of the climate–yield relationship is less advanced, e.g. West, Central or East Africa [17]. However, the eventual changes in the production patterns in areas in the key exporting countries/regions, as performed in this case or by Moore & Lobell [20], are as important for the stability of global food prices as production in those countries that are key producers but use most of their production domestically (e.g. China or India). The cited study concluded that long-term temperature and precipitation trends since 1989 have reduced continent-wide wheat yields by 2.5%, with a high level of heterogeneity across the continent and the highest impact observed around the Mediterranean. While the climate trends according to this study can account for only 10% of the stagnation in European wheat yields, it should be remembered that observed climate trends are expected to accelerate signifi-cantly, particularly if RCP 8.5 is considered. Our results showed that these changes would lead to a several-fold increase in the risks of single and multiple adverse events occurring within one wheat-growing season. This also increases the risk that compared with the baseline, events capable of significantly reducing wheat yields will occur across a wider part of the European wheat-growing area within the same season. When the shift of the wheat pro-duction to other parts of Europe as a coping strategy was explored authors did not consider other factors influencing such a shift, e.g. local demand, farmer skill, suitable soils, pro-duction infrastructure or need to displace currently produced crops. However in the case of changing climate conditions and adverse event risk it is fair to assume that shift of the wheat area production will be considered as one of the options. Negative impacts of increased risks of adverse weather events would likely not be limited only to wheat crops. The growing seasons, sensitive periods and magnitude of impacts of many important crops overlap with those of wheat [21]. Therefore, it is likely that the productivity of these other crops will also be affected by increased adverse weather events. Olesen et al. [22] showed that spring crops tend to be even more sensitive to some of the evaluated events (e.g.
0 0.2 0.4 0.6 0.8 1.0
probability of one adv
erse e
v
ent
area production
0 0.2 0.4 0.6
probability of tw
o adv
erse e
v
ents
90% of the area/production 75% of the area/production 50% of the area/production 25% of the area/production 10% of the area/production
baselineGISS_45
HadGEM_45 HadGEM_85
GISS_85 baselineGISS_45
HadGEM_45 HadGEM_85 GISS_85
(b) (a)
(c) (d)
Figure 3.
Boxplots of probability of one (
a,b
) and two (
c,d
) adverse events for
the wheat area (
a,c
) and wheat production (
b,d
) for the baseline (grey), RCP4.5
(white) and RCP8.5 (orange) climate scenarios from the GISS and HadGEM climate
models. Each boxplot shows the mean adverse event probability for the top 10,
25, 50, 75 and 90% grids according to their wheat area (
a,c
) or their wheat
production (
b,d
). Baseline (1981 – 2010) and climate scenarios (2081 – 2100).
rsif.r
oy
alsocietypublishing.org
J.
R.
Soc.
Interfa
ce
12
:
20150721
drought) than are winter crops. While spring crops would apparently not suffer directly from low winter temperatures their sowing would be affected by the increased water stag-nation projected for some of the regions. Adaptation to some of these adverse events would be difficult and costly.
As Trnkaet al.[15] have shown, the severity and frequency of some of the adverse events (e.g. drought stress) would, in general, be higher on soils with a lower water-holding capacity, both under baseline and future climate scenarios (i.e. 2081–2100). This finding was confirmed also in our study when we used free-draining soil with a water-holding capacity of 270 mm and compared it with a ‘light’ soil with its water-holding capacity set at 150 mm. The water-holding prop-erties of the selected soil used in the study are very good in comparison with the majority of the arable land. If we select actual soils (with water-holding capacity in many cases below 270 mm), then the probability of adverse events as defined in the study will mostly increase. By contrast, the study did not consider the influence of the high underground water table that could be found at some of the key wheat-producing areas in Europe [23] and would be capable of mitigating the impact of some adverse events (especially of the drought stress), but, equally, could prolong periods of water stagnation if the water table itself remained high. Our study also did not consider irrigation, as the absolute majority of Europe wheat production is rainfed. While the use of irrigation would decrease the overall exposure of wheat crop to some adverse weather events and would eventually allow a longer growing season it would be limited by the existing water scarcity in some areas and by the existing legal requirements (e.g. [24]).
By using climate scenarios based on low- and high-climate-sensitivity GCMs from the CMIP5 ensemble, we estimated the range of responses which, in principle, should be comparable with the range based on the whole CMIP5 ensemble. Under future climate scenarios, nearly every site is at risk of different multiple events depending on the scen-ario and the region. Therefore, the target traits for wheat improvement and strategies focused on improvement of the field conditions vary according to the region and the magni-tude of climate change. Failing to address these challenges by appropriate adaptation measures could potentially lead to a substantial reduction of European wheat production in the future. Other key wheat-producing regions of the world could be affected differently by changes in adverse weather events in the future, including other dominating types of adverse events or different magnitudes of these changes. Therefore, similar analyses for other major wheat-growing regions should be performed in addition to impact assessments based on crop growth models.
4. Methods
The paper focuses on events that could be considered ‘adverse’, i.e. conditions that are detrimental to winter wheat yield. The specific thresholds are described in the electronic supplemen-tary material, appendix table S1. We prefer the term ‘adverse’ rather than ‘extreme’, as the latter term is usually defined by the frequency of occurrence at the given site/region.
4.1. Study area and climate data
The simulation of adverse weather events for wheat was performed for 379 European sites that represent the study
domain (figure 1). In total, 36 European countries are represented by the study, covering the current European wheat-producing regions with the exception of Russia (figure 1g). Two GCMs from the CMIP5 ensemble were used with low, GISS-E2-R-CC (GISS), and high, HadGEM2-ES (HadGEM), climate sensitivity (electronic supplementary material, appendix figure S3). Two representative concen-tration pathway scenarios, RCP4.5 and RCP8.5, were considered in the construction of local-scale climate scenarios. Climate projections from GCMs were downscaled to the local-scale daily weather by the LARS-WG 6.0 weather generator using the ELPIS dataset of site-specific parameters across Europe [25,26]. For each site and for each combination of GCMs and RCPs, we generated 300 years of daily site-specific weather, representing the baseline scenario corresponding to 1981–2010, and 300 years for the future climate scenario corre-sponding to 2081–2100. In each simulation, the first 50 years were used to initiate the calculation, and the remaining 250 years of data were retained for the subsequent analyses.
4.2. Agroclimate modelling
For each site, we used three types of cultivars according to the maturity date and two levels of photoperiod sensitivity as described by Trnkaet al.[15]. The sowing, anthesis and matur-ity dates for the baseline conditions were estimated using AGRICLIM software, with the mean dates presented in the
electronic supplementary material, appendix figure S4. It is assumed that cultivars represent winter wheat in all locations except those where temperature constrains vernalization. At these locations, we assumed that winter-sown spring wheat cultivars are used. For the entire study, autumn sowing dates were preferred to keep the sowing within the same season for all locations and facilitate comparisons among them. The duration of phenological phases was calculated according to Olesenet al.[27] using accumulated degree days (8Cd) above the base temperature combined with the day-length response for the period from emergence to anthesis as used by Trnka
et al.[15]. The detailed settings are listed in the electronic sup-plementary material, appendix table S2. The sowing dates were determined automatically as the first day after the mean air temperature dropped below 138C for more than five sub-sequent days with the soil moisture above one-third of its water-holding capacity. When calculating evapotranspiration, an adjustment for the atmospheric CO2 concentration was
made by reducing the reference evapotranspiration by a scal-ing factor [28]. The value of the scalscal-ing factor for 2090 was estimated to be 0.94 for RCP4.5 and 0.88 for RCP8.5 of the base-line value. We used one soil profile for all of the sites, with homogeneous soil properties assumed throughout the top and subsoil layers to enable comparison among sites. The plant-available water at field capacity was assumed to be 270 mm in the entire profile (a depth of 1.3 m). We used a single free-draining soil with good water-holding properties and a relatively deep profile, allowing us to easily perform between-site comparisons of the climate signal.
4.3. Defining adverse weather events
To describe the major adverse conditions for wheat production, we used the following set of 11 indicators: indicators of frost damage, water logging, lodging, heat stress, drought stress and adverse conditions during sowing and harvest, with a more detailed description being available in the electronic
rsif.r
oy
alsocietypublishing.org
J.
R.
Soc.
Interfa
ce
12
:
20150721
supplementary material, appendix table S1. To provide a measure of the potential productivity of a given site, we used the sum of the EfGr. We calculated the cumulative global radi-ation for days with a daily mean air temperature above 58C, daily minimum air temperature above 08C, no snow cover and actual-to-reference evapotranspiration ratio above 0.4. To define subregions and assign appropriate weights, Thiesen polygons (figure 1g) were used to assign areas represented by each station. Then, the area of arable land in each polygon was estimated using data by Monfredaet al.[14]. The weight of each polygon in total wheat production (figure 1h) was cal-culated based on gridded information on wheat acreage [14] combined with FAOSTAT [29] and EUROSTAT 1999–2013 [30] mean yield data (on national or regional level).
Detailed information on the methods and thresholds used as well as associated references are available in the electronic supplementary material, appendix I.
4.4. A
GRIC
LIMsoftware
The agroclimatic parameters listed in the electronic sup-plementary material, appendix table S1 were calculated with the use of a software package, AGRICLIM[31]. The software
uses daily maximum and minimum temperatures, daily sum of solar irradiation and rainfall, mean daily wind speed and mean daily relative air humidity. For all of the ETr and ETa cal-culations, the winter wheat canopy was considered using the single crop coefficient (Kc) approach defined by Allenet al.
[32]. Compared to the original methodology [32], AGRICLIM
accounts for the degree-day driven change of Kc, crop height and rooting depth, which is based on results of Olesenet al.
[27]. The model also distinguishes between solid and liquid precipitation [33] and the effect of snowmelt on soil water con-tent. An evaluation of the soil moisture routine has been presented, for example, by Hlavinkaet al.[34].
Data accessibility.Climate data and weather generator tools used to pre-pare the paper can be found at LARSWG (http://www.rothamsted. ac.uk/mas-models/larswg.php) and the CMIP5 ensemble distri-bution site (http://pcmdi9.llnl.gov/).
Authors’ contributions.M.T. and M.A.S. conceived and planned the study; M.T. led the AGRICLIM software development; M.T. and P.H. per-formed the parametrization of AGRICLIM; M.T. performed the
calculation and initial analysis; M.A.S. developed CMIP5-based cli-mate change scenarios. All of the authors jointly developed the final set of indexes and contributed to writing the manuscript. Competing interests.The authors have no conflicts of interest to declare. Funding. We acknowledge funding from Ministry of Education, Youth and Sports of CR within the National Sustainability Program I (NPU I), grant no. LO1415, from the European Union’s Seventh Framework Programme (FP7-KBBE-2011– 5) for the ADAPTAWHEAT project (agreement 289842) and project IGA FA TP 7/2015, and from the MACSUR project (grant no. BB/K00882X/1). Rothamsted Research receives strategic funding from the Biotechnology and Biological Sciences Research Council of the United Kingdom.
Acknowledgements. Support from Jan Balek ( programming and data handling) and Daniela Semera´dova´ (technical preparation of figure 1, EDS 1,2,4 and GIS support) is greatly appreciated. We would like to acknowledge Dr Margarita Ruiz-Ramoz, Dr Christian Kersebaum, Prof. Reimund Ro¨tter, Prof. Jorgene Olesen and Prof. Zdeneˇk Zˇalud for providing expertise that helped to formulate the study methods. We acknowledge the World Climate Research Pro-gramme Working Group on Coupled Modelling responsible for CMIP5, and we thank the climate modelling groups for making avail-able their model output and support of the researchers from FACCE MACSUR collaborative initiative.
References
1. FAO. 2009How to feed the world in 2050. Rome,
Italy: FAO.
2. Porter JRet al.2014 Food security and food
production systems. InClimate change 2014:
impacts, adaptation, and vulnerability. Working Group II contribution to the Fifth Assessment Report of the Intergovernmental Panel on Climate Change
(eds CB Fieldet al.), pp. 485 – 533. Cambridge, UK:
Cambridge University Press.
3. Rahmstorf S, Coumou D. 2011 Increase of extreme
events in a warming world.Proc. Natl Acad. Sci. USA
108, 17 905– 17 909. (doi:10.1073/pnas.1101766108)
4. Gourdji SM, Sibley AM, Lobell DB. 2013 Global crop
exposure to critical high temperatures in the reproductive period: historical trends and future
projections.Environ. Res. Lett.8, 024041. (doi:10.
1088/1748-9326/8/2/024041)
5. Liu C, Allan RP. 2013 Observed and simulated
precipitation responses in wet and dry regions
1850 – 2100.Environ. Res. Lett.8, 034002. (doi:10.
1088/1748-9326/8/3/034002)
6. Tingley MP, Huybers P. 2013 Recent temperature
extremes at high northern latitudes unprecedented
in the past 600 years.Nature496, 201 – 205.
(doi:10.1038/nature11969)
7. Huntingford C, Jones PD, Livina VN, Lenton TM, Cox
PM. 2013 No increase in global temperature
variability despite changing regional patterns.
Nature500, 327 – 330. (doi:10.1038/nature12310)
8. Myers SSet al.2014 Increasing CO2threatens
human nutrition.Nature510, 139 – 142. (doi:10.
1038/nature13179)
9. Challinor AJ, Watson J, Lobell DB, Howden SM,
Smith DR, Chhetri N. 2014 A meta-analysis of crop yield under climate change and adaptation.
Nat. Clim. Change4, 287 – 291. (doi:10.1038/ nclimate2153)
10. Asseng Set al.2013 Uncertainty in simulating
wheat yields under climate change.Nat. Clim.
Change3, 827 – 832. (doi:10.1038/nclimate1916) 11. Hyman G, Hodson D, Jones P. 2013 Spatial analysis
to support geographic targeting of genotypes to
environments.Front. Physiol.4, 40. (doi:10.3389/
fphys.2013.00040)
12. Leff B, Ramankutty N, Foley JA. 2004 Geographic
distribution of major crops across the world.Glob.
Biogeochem. Cycles18, GB1009. (doi:10.1029/ 2003GB002108)
13. FAOSTAT. 2014 Food and agricultural commodities production/countries by commodity. See http:// faostat3.fao.org/browse/rankings/
countries_by_commodity/E (cited 25 October 2014). 14. Monfreda C, Ramankutty N, Foley JA. 2008 Farming the planet: 2. Geographic distribution of crop areas,
yields, physiological types, and net primary
production in the year 2000.Glob. Biogeochem.
Cycles22, GB1022. (doi:10.1029/2007GB002947) 15. Trnka M, Ro¨tter RP, Ruiz-Ramos M, Kersebaum KC,
Olesen JE, Zˇalud Z, Semenov MA. 2014 Adverse
weather conditions for European wheat production will
become more frequent with climate change.Nat. Clim.
Change4, 637 – 643. (doi:10.1038/nclimate2242) 16. Taylor KE, Stouffer RJ, Meehl GA. 2012 An overview
of CMIP5 and the experiment design.Bull. Amer.
Meteorol. Soc.93, 485 – 498. (doi:10.1175/BAMS-D-11-00094.1)
17. Lobell DB, Schlenker W, Costa-Roberts J. 2011 Climate trends and global crop production since
1980.Science333, 616 – 620. (doi:10.1126/science.
1204531)
18. Gourdji SM, Mathews KL, Reynolds M, Crossa J, Lobell DB. 2013 An assessment of wheat yield sensitivity and
breeding gains in hot environments.Proc. R. Soc. B
280, 20122190. (doi:10.1098/rspb.2012.2190)
19. Semenov MA, Shewry PR. 2011 Modelling predicts that heat stress, not drought, will increase
vulnerability of wheat in Europe.Sci. Rep.1, 66.
(doi:10.1038/srep00066)
20. Moore FC, Lobell DB. 2015 The fingerprint of climate
trends on European crop yields.Proc. Natl Acad. Sci. USA
112, 2670–2675. (doi:10.1073/pnas.1409606112)
rsif.r
oy
alsocietypublishing.org
J.
R.
Soc.
Interfa
ce
12
:
20150721
21. Hlavinka P, Trnka M, Semera´dova´ D, Dubrovsky´ M, Z
ˇalud Z, Mozˇny´ M. 2009 Effect of drought on yield
variability of key crops in Czech Republic.Agric. For.
Meteorol.149, 431 – 442. (doi:10.1016/j.agrformet. 2008.09.004)
22. Olesen JEet al.2011 Impacts and adaptation of
European crop production systems to climate
change.Eur. J. Agron.34, 96 – 112. (doi:10.1016/j.
eja.2010.11.003)
23. Fan Y, Li H, Miguez-Macho G. 2013 Global patterns
of groundwater table depth.Science339, 940 – 943.
(doi:10.1126/science.1229881)
24. Monaghan JM, Daccache A, Vickers LH, Hess TM, Weatherhead EK, Grove IG, Knox JW. 2013 More ‘crop per drop’: constraints and opportunities for
precision irrigation in European agriculture.J. Sci.
Food Agric.93, 977 – 980. (doi:10.1002/jsfa.6051) 25. Semenov MA, Donatelli M, Stratonovitch P,
Chatzidaki E, Baruth B. 2010 ELPIS: a dataset of
local-scale daily climate scenarios for Europe.Clim.
Res.44, 3 – 15. (doi:10.3354/cr00865)
26. Semenov MA, Stratonovitch P. 2010 The use of multi-model ensembles from global climate models
for impact assessments of climate change.Clim. Res.
41, 1 – 14. (doi:10.3354/cr00836)
27. Olesen JEet al.2012 Changes in time of
sowing, flowering and maturity of cereals in
Europe under climate change.Food Addit. Contam.
A29, 1527 – 1542. (doi:10.1080/19440049.2012.
712060)
28. Kruijt B, Witte J-PM, Jacobs CMJ, Kroon T.
2008 Effects of rising atmospheric CO2 on
evapotranspiration and soil moisture: a practical approach for the Netherlands.
J. Hydrol. 349, 257 – 267. (doi:10.1016/j.jhydrol. 2007.10.052)
29. FAOSTAT. 2012 See http://faostat.fao.org/site/567/ default.aspx#ancor (cited 20 September 2014).
30. EUROSTAT. 2014 See http://epp.eurostat.ec.europa. eu/portal/page/portal/statistics/search (cited 20 September 2014).
31. Trnka Met al.2011 Agroclimatic conditions in
Europe under climate change.Glob. Change Biol.
17, 2298 – 2318. (doi:10.1111/j.1365-2486.2011.
02396.x)
32. Allen RG, Pereira LS, Raes D, Smith M. 1998Crop
evapotranspiration:guidelines for computing crop water requirements. FAO Irrigation and Drainage Paper no. 56. Rome, Italy: FAO.
33. Trnka Met al.2010 Simple snow cover model for
agrometeorological applications.Agric. For.
Meteorol.150, 1115 – 1127. (doi:10.1016/j. agrformet.2010.04.012)
34. Hlavinka Pet al.2011 Development and evaluation
of the SoilClim model for water balance and soil
climate estimates.Agric. Water Manage.98,
1249 – 1261. (doi:10.1016/j.agwat.2011.03.011)