VOLUME 36, ARTICLE 46, PAGES 1399
,
1434
PUBLISHED 28 APRIL 2017
http://www.demographic-research.org/Volumes/Vol36/46/ DOI: 10.4054/DemRes.2017.36.46
Research Article
Setting the census household into its urban
context: Visualizations from 19
th-century
Montreal
Sherry Olson
This publication is part of the Special Collection on “Spatial analysis in historical demography: Micro and macro approaches,” organized by Guest Editors Martin Dribe, Diego Ramiro Fariñas, and Don Lafreniere.
© 2017 Sherry Olson.
This open-access work is published under the terms of the Creative Commons Attribution NonCommercial License 2.0 Germany, which permits use, reproduction & distribution in any medium for non-commercial purposes, provided the original author(s) and source are given credit.
1 Introduction 1400
2 Visualizing connections 1401
3 Toward an experimental strategy 1403
4 Relationships of making a living 1405
4.1 Live-in servants: Families of origin and service 1405
4.2 Metal workers: geocoding occupations 1406
4.3 The workplace near home 1408
4.4 Stall holders in the public markets 1409
4.5 Journey to work of two business élites 1411
4.6 Partnerships of business and residence 1413
4.7 Corporate enterprise 1414
5 Households in kinship 1418
5.1 Moving through households 1418
5.2 Kinship and transmission of property 1420
6 Conclusions 1424
7 Acknowledgements 1425
Setting the census household into its urban context:
Visualizations from 19
th-century Montreal
Sherry Olson1
Abstract
BACKGROUND
Organized by household, North American census data promoted research into household composition, but discouraged research into connections between urban households. Yet these constitute “communications communities” that powerfully influence demographic decisions (Szreter 1996).
OBJECTIVE
How can we uncover relations between urban households? From spatial cues, can we infer social connections that generate constraints on or incentives for the formation of a household, its break-up, reconstitution, or relocation?
METHODS
For Montreal and its suburbs, 1881‒1901, we employ double geocoding and lot-level precision to explore a dozen types of relationships. Samples for experiment are drawn from a local historical geographic information system (HGIS) that integrates tax roll and directory with census data.
RESULTS
‘Family’ was socially embedded at three levels. Neighbouring of kin was strategic, and kinship was a factor in employment, enterprise, and property development as well as residential choices. In managing property, family networks operated with a horizon of four generations.
CONCLUSIONS
Introduction of geographic coordinates offers a critical set of neglected cues to relationships between households, such as business partnerships, credit, or use of transit or telephone. In an urban HGIS, advantageous features are lot-level precision and facilities for coding and matching addresses to accommodate alternative levels of spatial aggregation.
CONTRIBUTION
Geocoding is shown to be a breakthrough innovation for exploring urban connectivity. Experiments with maps and networks as tools of visual thinking invite us to rethink the ‘census family’ at higher levels of relatedness.
1. Introduction
Organized by household, the population census has been effectively used to study the dynamics of household composition (Ruggles and Brower 2003; Sennett 1970; Schürer 2004), but to capture connections between households remains challenging. With this objective, I report a dozen examples drawn from the HGIS called “MAP, Montréal l’avenir du passé.” The MAP team has explored a wide range of microdata for a fast-growing industrializing city. They designed their construction of data spaces to unravel connections in geographic spaces and linkages in the city’s social spaces. Setting households into their time-space coordinates offers insight into the way ‘family’ is socially embedded.
On the fast-moving frontier of spatial demography, we habitually use the ‘where’ and ‘when’ as clues to discover ‘how’ and ‘why.’ Stitching together spatial and demographic variables has already involved heavy investment in geocoding, address matching, reconstruction of historic street-maps, mastery and adaptation of software for geographic information systems (GIS), and social network analysis (SNA).2 The collaboration of demographers, historians, and geographers has reintroduced visual thinking and collaborative imagination in the borderlands of the social sciences (Frisby 1992; Simmel 2009).
Covering the span of the industrial revolution in Montreal (1840‒1910), MAP is an artisanal first-generation HGIS, built piecemeal over thirty years through extensive and varied collaborations (Sweeny and Olson 2003). In spite of conceptual flaws, empirical errors, broken links, arguable matches, and poorly documented corrections, it has been used by several dozen scholars for diverse purposes, and can therefore serve to stimulate our imagination for future ventures.
Fundamental techniques of historical demography were, for the most part, developed in village studies (Henry and Blum 1988; Wrigley 1997; Laslett and Wall 1972), and the rural village – thought to be a reasonably sized object for a thesis or a lifetime of scholarship – is still a site for innovation in grounding genealogies and
2 Changes in house numbering, street names, and spelling create ambiguities, and since the 1960s North
social networks in the evolution of landscape and property (Brudner and White 1997; Alfani and Munno 2012; Guzzi-Heeb 2012; Rueck 2014). Applications to cities of modest size extended interest in the ‘where’ and ‘when’ to the ‘whereto’ and ‘wherefrom’ (Perrenoud 1979; Alter 1988; Bardet 1983; Rosenthal 1999; Oris and Alter 2001). The social relationships of a metropolis remain daunting, especially in its fast-growth foundational phase, but the mushrooming of digital resources – ‘Big Data’ – has whetted appetites for studying cities we once perceived as too big to swallow.
Because cities are places of intense connectivity, the challenge of the urban object is as a “connectome” (Seung 2012). How are we connected? How does the structure of connections change? How does it make us what we are? And how do we organize a data space to elicit understanding of the connections? According to Peter Gould (1991: 4), “Geography is all about connections. No connections, no geography.” If we paraphrase Gould, “Demography is all about couples. No couples, no demography.” The coupling motif offers a guide to urban spaces of interest to the historical demographer: for example, marriage fields, moves of couples and their offspring, and residential choices of siblings. To interpret the communications communities that influence the ideals and preferences of the married couple (Szreter 1996; Neven 2002), we need to consider all the cross-connections that generate constraints on or incentives for the formation of a household, its break-up or reconstitution, and its relocation; indeed the full spatial articulation of an urban economy and the nuances of cultural identity (Kwan 2002; Long 2005; Kok and Mandemakers 2010; Marttila 2010; Pinol and Garden 2009).
In villages, historical demographers have paid close attention to the value of land and the systems of inheritance. Why are we ignoring these in the cities? (c.f. Alter 2013). The conception of family as a social network anchored in ‘place’ allows us to block distinct levels of relatedness (Lemercier 2005) and invites conceptualization of new graphic forms (Drucker 2014; Cheshire and Uberti 2014). If we locate census households in the urban space, and take full advantage of complementary sources, the geographic proximities will reveal social connections that allow us to decipher the urban connectome.
2. Visualizing connections
social space pegged to social coordinates such as rent level and sector of employment, or as a population-space referenced to coordinates of age and gender. The data space of the HGIS or the historic-geographic information system introduces temporal coordinates for the analysis of events, durations, seasons, and travel times (Southall 2011), and challenges us to recognize constraints on time-sharing and probabilities of encounter (Hägerstrand 1982 and 2004; Pred 1981; Beck 1973).
Much of the appeal of GIS and SNA, graphic narrative (Franzosi 2005), and software for exploratory data analysis (EDA) lies in the power of visualization (Andrienko and Andrienko 2006; Unwin 2006; Hansen, Shneiderman, and Smith 2010; Zhao et al. 2013). In the farthest-reaching collaborations of MAP – between respiratory epidemiologists and historical geographers – we found visual display to be the instrument that opened up communication among team members. When technicians, students, and professors from diverse backgrounds sat down in front of the same screen, the questions they asked each other led to rewarding explorations of the data space (Schwartzman et al. 2012). The ‘zoom,’ so powerful a function in GIS software and so popular in way-finding applications (GPS), lends itself to the great challenge of thinking simultaneously in terms of the Big Data and Little Data of which it is composed. With Big Data have come exciting options − still scarcely recognized − for grounding very small samples, and thereby designing and integrating new sampling strategies. In sample design, how can we make better use of the zoom?
There is more to ‘Viz’ than the management of data and the ‘G-whiz’ or glamour factor. In the mid-18th century the emergence of a culture of the diagram was a watershed in the history of science (Bender and Marrinan 2010; Hentschel 2014), as data spaces were transformed into visual models. The whole of demography grew out of ‘graphing’ statistical tables such as life tables, interest rate tables, and tables showing the frequency of homicide and suicide. Our postmodern cartographies of social and historical phenomena grew out of those first thematic maps (Palsky 1996; Friendly and Palsky 2007; Tufte 1983 and 1990).
object to think with, identifying the couplings, unraveling the chains of connection, uncovering networks, and revealing correlations, lesrapports sociaux.
3. Toward an experimental strategy
While Canadian cities are rich in historic map images, scholars were handicapped because the census-makers did not record street addresses until 1901, failed to preserve their maps of operational divisions within a city, failed to report the logic of the divisions, and made little attempt at continuity from one decade to the next. These flaws forced us to turn to other sources for geocoding census households. The municipal tax roll of Montreal offered a rough-and-ready annual census with occupation of the “head of household,”3 and Lovell’s city directory identified businesses as well as household heads. The moment we integrated these two additional sources, coding street addresses to the lot (cadastral unit of municipal taxation), we opened up additional social variables such as the rental valuation of the dwelling; we added options for address-matching in addition to nominal address-matching, and we gained perspective on the objectives of the creators of the three sources (Sweeny 2015). Since the original MAP team included a dozen doctoral students from five universities and five disciplinary ‘homes,’ the diversity of their research objectives led to our decision to code with exceptional precision: to place households on the lot, and to exploit the highest-quality historic maps. As shown in Figure 1, the sources available allowed us to slice off 20-year intervals that captured the city’s great surges of growth. The linkage methods, the more coherent analyses of mortality, fertility, and nuptiality in three cultural communities, and the gendering of property ownership have all been reported (Olson and Thornton 2009; Gauvreau and Olson 2008; Sweeny 2015).
Of three key strategies, our first was precision geocoding. The second was how to establish links between sources: by the same address? same household? same person? same date? The third strategy was then inevitable: how to interpret the case of a person with two different addresses? Or reports of different people at the same location? We carried out database triangulations, searching for connections.
3 The annual tax roll, like the directory, identified a household without specifying its individual members, and
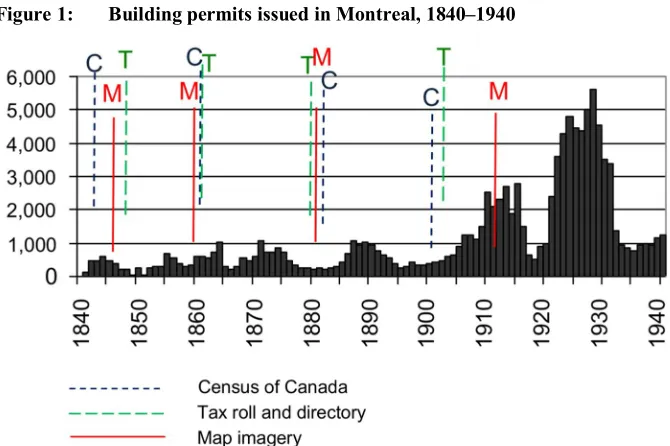
Figure 1: Building permits issued in Montreal, 1840–1940
Building cycle in Montreal, 1840‒1940 and MAP databases. To frame the data space in the building cycle, the MAP team anchored georegistration in map images(M) of 1846, 1860, 1881, and 1912, and integrated household data from the Census of Canada(C) for 1842, 1861, 1881, and 1901; municipal tax rolls(T) of 1848, 1860, 1880, and 1903, and directories (not shown) of 1848, 1861, 1881, and 1901.
Sources: Ville de Montréal, Annual Reports of the Building Inspector, 1842‒1940.
The dozen experiments described in this paper emerged as ‘fall-out’ from those methodological and analytic checks, as we verified a match, traced a missing person or a lost link, or searched for a source of bias in a sample. They are explorations I consider fragmentary or unfinished, selected from data 1880‒1901, but they demonstrate how challenges emerged, one from another, inviting us to revisit in the metropolis lines of questioning employed in studies of villages and country towns: the relations of kinship to occupational networks, property, credit, and exercise of power (Marttila 2010; Guzzi-Heeb 2012; Alfani and Munno 2012).
4. Relationships of making a living
To uncover work-related links between households, let us take advantage of geographic cues. Despite heroic efforts applied to census classification of occupation (Mandemakers 1993; Van Leeuwen, Maas, and Miles 2004), comparative analyses among cities and neighbourhoods are rare. The population census itself permits only a skeletal view of industrial jobs and a distinction between bourgeois and popular occupations, with high versus low remuneration. It does not tell us that the front room had a shop window on the street, or that the man next door was a brother, partner, and half-owner of the horse and wagon in the yard they shared. Yet the size and rate of the growth of a city were grounded in the potential for specialization and exchange, and the progressive division of labour in new lines of manufacture implied links not specified by existing classifications. We shall see that proximities and joint trajectories revealed by double geocoding of home and workplace point to long-running relationships ‒ the woman who married her father’s merchant clerk, the foreman who hired his reliable workman’s nephew, or the brother-in-law who recovered their assets at a sheriff’s sale. Anchoring people in geographic coordinates offers cues to unsuspected relationships and invites use of a wider variety of sources.
In Montreal, the year 1857 marked an acceleration of the transition to steam power, resulting in larger-scale metallurgy and by 1880 concentration of workers in larger factories, with as many as 1,100 or 1,500 workers. From this point on, corporate enterprise took a great leap. From the 1880 tax roll and business directory we can identify 147 corporate employers, 124 institutional employers (such as hospitals and colleges), some hundreds of business partnerships, and thousands of individual entrepreneurs. The problem is to extract some cues pointing to the journey to work or the relationship between the households of employer and employee. The ‘samples’ captured may not be fully representative, but they are enough to offer hypotheses that can be further tested. We look first at patterns observed in particular occupations and social strata (sections 4.1‒4.5), then at professional and business partnerships (4.6), and finally corporate enterprise (4.7).
4.1 Live-in servants: Families of origin and service
and what neighbourhoods were furnishing domestic servants. Contrary to the instructions given to census takers, 75 young women were reported both in their families of origin and in the households of their employers. As a sample of servants (1.3%), it is merely the tip of the iceberg, but the geographic distribution suggests the errors are unbiased: their places of employment correspond with those of the city’s 3,616 households with a servant (10%). To the extent that it may be representative, the tiny sample tells us that households who furnished servants were decidedly larger than average (46% with seven or more persons), and disproportionately headed by a labourer (17%), a widow (19%), or an aged couple (10%). Those figures are more than double what might be expected from household composition citywide. Households furnishing servants were living in streets with low rents, high density on the ground, and high levels of room crowding. In a modal housing stock of three- and four-room flats, the push of crowding is unsurprising (Atkinson 2011; Devrieze and Vanhoute 2001; Bras 2003). A little more intriguing is the discovery that one in six of those households was supplying more than one daughter to the pool of domestics. One girl had a ‘place’ a block away from her brother’s lodging house; another was reported as a domestic in two homes in the same street; and two sisters served another pair of neighbouring households. Although many hires were short-term relationships, each spell of ‘service’ widened the young woman’s information network, extended a traffic in resources such as second-hand goods and in-kind payments, transferred knowhow, and stimulated aspirations.
4.2 Metal workers: geocoding occupations
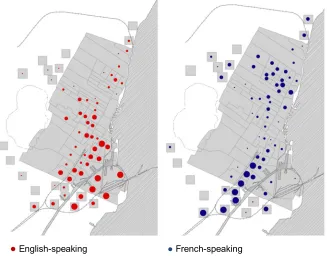
the locomotive shop workers show some dispersal (Hoskins 1989). Within the tight constraints of budget and travel times, the contrast of residential choices by language group suggests that differentiation of surroundings accommodated identity variables such as language and religion on the part of the employee, the employer, or both. Higher concentration of the English-speaking in the southeast reflects the hiring bias in the locomotive and mechanical shops of the Grand Trunk Railway. About a third of the francophone families of moulders and foundrymen were networked by common surnames, and deeper genealogical research confirms a highly interconnected network with a common regional origin, the solidarity of a craft union, and international career mobility (Bischoff 1997; Marttila 2010).
Figure 2: Metalworkers mapped by language group and census division, Montreal, 1880
● English-speaking ● French-speaking
Circles are proportioned to numbers of household heads reporting metalworking trades. Language group is inferred from consonance of names. Addresses were coded by street segments and reaggregated to 1881 census divisions. Boundaries of census divisions were reconstructed from the matched roll of property owners.
The same factors can be observed among carters, carpenters, and other occupations. The long tradition of a one-year lease produced a theatrical ‘Moving Day’ every year on the first of May. In a given year, four-fifths of households had the option of moving or staying, and as many as one-fifth actually undertook a move. Within a limited range of dwelling sizes, and row-house streets narrowly defined in rent level, families were making multi-objective decisions and reviewing them every year.
4.3 The workplace near home
Industrial concentration of heat and power, relatively well documented, favoured removal of metallurgy and many other kinds of work from domestic habitats, but information is scarcer with respect to smaller-scale close-to-home activities. From the tax roll we selected people who were taxed for a dwelling and an attached or adjoining workplace on the same lot, and Table 1 distinguishes two groups: high-rent merchants ($200/year or more for each domestic and each work unit) and low-rent artisans and small shopkeepers (dwelling and business space valued at under $120 each). The high-rent set lined the main streets close to the docks on the waterfront or radiated from that centre, while the low-rent set includes hundreds of corner stores. At both levels the most numerous occupations involved the distribution of liquor, and the distinction between ‘trader’ and ‘merchant’ was fraught with social and political meaning.
Table 1: Individuals taxed for business and dwelling on the same lot ($/year)
Occupation ≤ 120 ≥200
Grocer 366 22
Trader 269 9
Innkeeper 146 42
Merchant 40 46
Barber 46 3
Tobacconist 33 2
Baker confectioner 31 12
Doctor 29 0
Blacksmith 24 0
Carpenter, cooper, or cabinet-maker 23 0
Tailor 0 2
Tinsmith 18 0
Other occupations 325 55
Since the locational objective of the shopkeeper, the independent artisan, and the professional was access to a pool of consumers or clients, the distribution of such households reflected the streetscape and its traffic pattern, still that of a ‘walking city.’ The street network was (and is) of formidable importance since it connected everybody, analogous to Diderot’s visualization of circulation of blood in the veins and sensory signals through the nervous system (Diderot and d’Alembert 1751: Anatomie, vol. 18, plate IX).4 In the “space syntax” proposed by Bill Hillier (1996), “the fundamental correlate of the spatial configuration is movement.” As he puts it, “Encountering, congregating, avoiding, interacting, dwelling, conferring are not attributes of an individual, but patterns or configurations, formed by groups or collections of people” (p. 152 and p. 31). The street segments created by the MAP team using the methods of Charles Booth generated geographic patterns similar to his 1890 map of London.
4.4 Stall holders in the public markets
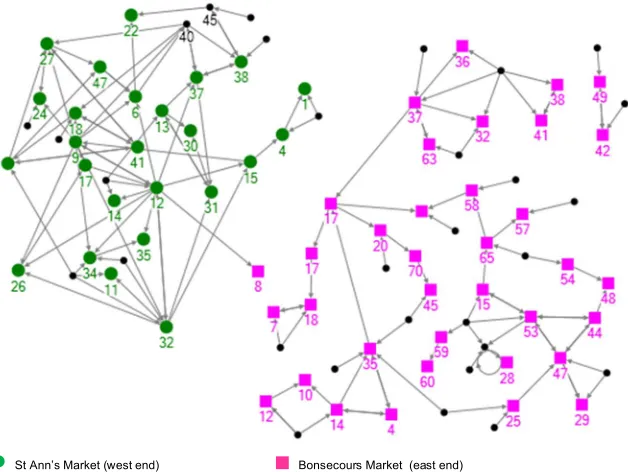
For butchers, a highly regulated and well-capitalized trade, sales were restricted to the public markets, seven in 1880 (Figure 3). Lovell’s directory lists both home address and the market stall. Over half a century (1848–1901) the average distance lengthened between the butcher’s home and his market stall, despite the construction of new markets. In the decade following the introduction of electric tramways (1892) some men undertook a longer journey to work: in the top quartile the distance doubled. Women stallholders, who sold fish, fruit, and vegetables, averaged shorter distances: in 1881 the median for men was 48% longer than for women (852 vs. 574 metres). At the semi-annual auction of the privilege, the city demanded of each lessee two guarantors of payment, and Figure 4 shows, for the simpler situation of 1848, the networks of trust, characterized by some reciprocity between nearby stallholders (13 cases where X secured Y and Y secured X). In the larger Bonsecours market there were several cliques, while a highly integrated network in St Ann’s Market (southwest) was associated with a tighter residential clustering and may reflect a coherent leadership resulting from the politics of its recent reconstruction.5
4 Shop-front ‘main streets’ display great diversity with respect to income and ethnic origin; the social
diversity persists as a result of the variety built into the structures (Gilliland, Olson, and Gauvreau 2011).
5 The open-source Excel template NodeXL_1.0.1.245 was used to generate the graph from the list of pairs
Figure 3: Journey to work of stallholders in the public markets of Montreal, 1881
A straight line links the home address of the stallholder to the market location.
Figure 4: Butchers who pledged for each other, 1848 and 1849
●
St Ann’s Market (west end)■
Bonsecours Market (east end)Adjacent numbers (labels) reference adjacent locations in the market. Points in black are outsiders who are not butchers.
Source: BanQ, Acts of Ross, leases of 25 August1848 and 1849.
4.5 Journey to work of two business élites
French-speaking Catholics residing along two parallel streets studded with prominent Catholic institutions. Both residential clusters were characterized by greater owner occupancy than elsewhere, architectural display, and homes designed for lavish entertainment. Unlike the butchers, these families were users of the horsecar service, and the tax roll confirms that many of them had their own horse and carriage. The complexity of the geography points to the multiplicity of objectives; entrepreneurs juggled their business and residential locations not just to minimize the journey to work but to optimize their travel patterns: to find the best compromise between a variety of attractions and obligations.
Figure 5: Journey-to-work patterns associated with workplaces in two streets, 1880
In blue, men with offices in St François Xavier Street; in red, with offices in St Vincent or St Amable Streets.
4.6 Partnerships of business and residence
Situated at the break-in-bulk point in the navigation of the St Lawrence River, Montreal’s commercial power throughout the 19th century was grounded in partnerships, and the largest personal fortunes were founded on multiple partnerships. Working strictly from titles of firms in Lovell’s directory of June 1880, and excluding those of father and son(s) or brother(s), I identified 400 business partnerships. Routine assignment of addresses to lots (in the MAP geobase) yielded a double geocoding of the two partners’ residences for 344 enterprises, and double geocoding for place of residence and place of business for 321 firms. Since a partnership usually implied larger capital and scale of operation than an individual enterprise, nearly all the partners lived in high-rent districts, and we can differentiate three groups.
Close to one-quarter were the 75 firms of lawyers and notaries shown in Figure 6; they are distinguished from other partnerships by a greater distance between the partner’s home and place of business (column A at left) and by greater distances between the homes of the partners (column D). A map of their residences would show concentrations of wealth, with a split of language and religion much like Figure 5, but with more crosstown links, since many of the law firms were strategic intercultural partnerships. Since the 18th-century British conquest of Quebec it had been necessary for notaries, advocates, registrars, and surveyors to be familiar with both French and British law, to speak both languages, and to accommodate interactions of clienteles from both traditions.
Figure 6: Paired distances in three types of business partnership, Montreal, 1881
At left (A, B, and C) are the distributions of journey-to-work distances in metres for participants in three types of partnerships: A Advocates and notaries for whom no kin relation is apparent (n=75 firms)
B Other types of businesses (n=248)
C Partnerships between brothers or between a father and his son (n=148) At right (D, E, F), in the same order, are distances between homes of two partners. Sources: Lovell’s Directory for 1881, municipal tax roll compiled in June 1880.
4.7 Corporate enterprise
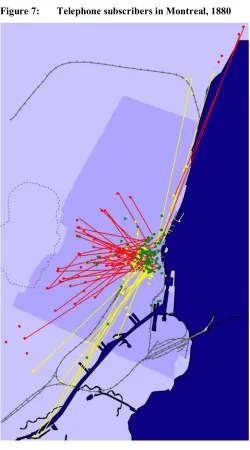
Incorporated firms, by 1880, accounted for 8% of taxable property within the city limits, and their numbers were still small.6 By geocoding the 546 entries in the city’s first telephone directory (1880, see Poitras 2000), we discover connections between corporate head offices in the downtown core, their outlying industrial plants along canal, railway, or riverfront, and their owners and executive officers who resided in properties they owned in the high-rent district (Figure 7) where their presence – to the extent of three dozen millionaires in 1892 – accounts for its later nickname of ‘the Golden Square Mile’. Some of their outlying plants were kernels of working-class neighbourhoods, such as the cotton mills at Hochelaga and St Henri; others were more remote nuisance industries such as slaughterhouses and tanneries.
Figure 7: Telephone subscribers in Montreal, 1880
Colours distinguish residences (red), offices (green), and industrial works (yellow). A line is drawn between home and office of a same party (red), head office and works of a firm (yellow).
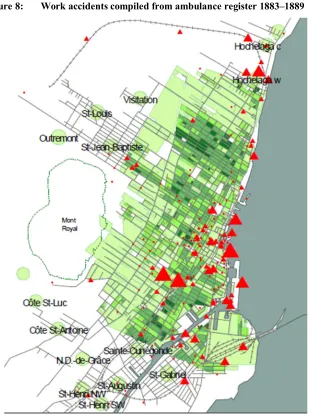
In analysing causes of deaths in 1881 (Thornton and Olson 2011), we noticed that industrial accidents were poorly documented and rates poorly estimated, despite the ‘epidemic’ impact of new steam, gas, electricity, and molten metal technologies, and high-speed machinery. From a register of the city’s first horse-drawn ambulance we transcribed the 1,100 runs (1883‒1889), identified the 700 cases of work accidents, reviewed journalists’ and coroners’ reports, and mapped the pick-up points where the accidents occurred. As shown in Figure 8, the ecology of work accidents is instructive, featuring riverfront docks, the railway yards, and, to the south along the Lachine Canal, the concentration of foundries, nail factories, and locomotive shops: workplaces of the metalworkers mapped in Figure 2. For victims admitted to hospital, their home address confirmed residence in high-density low-rent neighbourhoods, as we might expect from the high-risk jobs of brakeman and ship labourer, with their long hours. Their journeys to work were shorter on average than those of the lawyers and brokers mapped in Figure 4.
If we consider the distribution of ambulance pick-ups with the homes of men in the vulnerable metal trades (Figure 2) we recognize a serious flaw in the overall map of accidents: the distribution reflects more accurately the residences of the English-speaking and leaves a void among the French-English-speaking in the high-density core in the north and east of the city. The geographic bias arises from the location of the hospital and its position as part of the Protestant English-speaking community.7 The exercise, however incomplete, points to changes taking place in employer‒employee relationships. It was the introduction of the telephone that made ambulance service worthwhile, and the corporation officers identified from business and phone directories of 1880 were employers of at least 40% of the work-related ambulance cases of the 1880s. The same employers also appear as lifetime directors of the hospital; an annual donation of $5 entitled the company to a bed. Corporate gifts and strong personal roles of the officers in fundraising for the hospital point to contradictions that were vigorously debated in the 1880s: ‘private’ charity dependent on religious distinctions, absence of legal responsibility for employee accidents, corporations’ handling of employee insurance, absence of regulation of working hours (notably in unloading ships), and neglect of safety devices such as brakes on freightcars.8 Coworkers’ solidarity appears in the hospital’s register as funds raised by passing the hat in the shop or yard of a foundry, and the frequency with which the ambulance driver recorded “Paid by friends.”
7 See Goulet and Keel (1990) for a report of a second ambulance (1885) of the Catholic, French-speaking
Hôpital Notre-Dame, 750 metres east along the riverfront.
8 See for example, Royal Commission on Capital and Labour (Queen’s Printer, 1889), vol. 5, testimony in
Figure 8: Work accidents compiled from ambulance register 1883‒1889
Triangles are proportioned to numbers of accidents recorded at each site (maximum 59). Green backdrop shows population density, households per 1,000 square metres of land.
5. Households in kinship
We turn now to kinship as a factor in couples’ residential choices (section 5.1), and to their management and transmission of property (section 5.2). The assignment of spatial coordinates to census households pegs the entire population to the map, and the map coordinates are the same for populations at several dates. We can therefore trace the individual who leaves one household to found or join another. The strategy of double geocoding allows us to observe pathways in a time space, and to infer joint decision-making.
5.1 Moving through households
To study occupational mobility between generations (father and son, or father and son-in-law) we tracked samples of individuals married in the interval 1881‒1901. Moves to higher-status streets proved as effective as occupational rubrics in demonstrating a net upward mobility (Gauvreau and Olson 2008), and this suggested a broader exploration of the moves arising from the fission and formation of households. From the census population of 1881 I was able to find recorded in the 1901 census 40,000 people from the 1881 census population, estimated as one-quarter of those still living (Olson 2015). In 1881 they were living in 10,000 households; by 1901 they were dispersed in 20,000 different households which could be matched as 10,000 pairs, each pair ‘coupled’ by first-degree kinship of someone in household A to someone in household B. Over the 20-year span nearly all the individuals had moved, and some had made as many as twenty moves, but half of the 10,000 pairs were still situated as close neighbours, living within 500 metres of each other, a six-minute walk. Random moves would not produce this result, nor would moves randomized and constrained to streets of the same ethnic group and status level.
since the same proximity of close kin was expressed year after year for decades, we infer that their neighbouring was strategic.
Since each of the families observed may have had another set of grandparents nearby, or another daughter or sister-in-law, the formal analysis displays only a part of the tangle of kin; and case studies make it clear that genealogies are translated into geographies. In a surname sample that captured all family ties in the paternal line, all of the 12 sons and sons-in-law of William Beattie and his wife Ann Pashby worked in the Grand Trunk Railway shops, and over a half-century the families of 10 of them lived within sight of the parent couple and of one another (Olson and Thornton 2011; see also Lauzon 2015).
The case of two brothers, next-door neighbours, brings into view the multiplicity of kin living within close range, as well as a long-distance reach into seigneuries on the Ottawa and Yamaska rivers. Two of their children married the same year (1880), and the two marriage contracts listed the elegant wedding gifts: walnut dining table, silver eggcups and nutpicks, crystal sugar bowl, porcelain tea service and inkwell. The two brothers were notaries; the daughter of one married the city’s internationally known orchestra conductor, and the son of the other married into another family of judges, lawyers, and notaries.9 Of the 200 people who bestowed gifts, most were relatives, four generations deep, half from out of town. Of those resident in Montreal, half lived within 650 metres (an eight-minute walk) of the brothers. Those two couples belonged to a wealthy élite of distinguished ancestry, but modest families like the Beatties maintained social networks of comparable size.
In other words, the census family was nested within a larger family. While the legal powers of a family council were restricted to men, women were active in the management of social distances and the routines of grooming and protocol that ensured frequency of face-to-face encounters, temporal markers of life trajectories, choices of godparents, and reciprocity of gifts, all of which undergirded the potential for reactivating ties in time of need. We can infer that the overwhelming preference for living as a nuclear family was viable in Montreal only because those nuclear families were coupled as neighbours and embedded in a more extended network.
9 BAnQ, Acts of notary F.J. Durand, 14 May 1881, marriage of Guillaume Couture and Mercédès Papineau,
5.2 Kinship and transmission of property
The intervention of kinship in the development, management, and transmission of real property has long been studied in rural habitats (Plakans and Wetherell 2003; Lemercier 2005) but remains under-researched in North American urban milieux, despite the ready availability of property tax rolls.10 In Montreal, only about 15% of census households owned the dwellings they occupied, but three cases, each extending over a century, offer indications that strategies for establishing a wider kinship into the future were well understood and influential in the structuring of neighbourhoods.
A well-documented expropriation case of 1891 pointed us to property acquisitions a century earlier by two independent couples. After the marriage of a respective son and daughter, their parents signed wills (Pierre Désautels in 1817, baker Charles O’Brien and his wife in 1822) forwarding their property to great-grandchildren not yet born. By 1891 the descendants of O’Brien and Désautels were managing a dozen pieces of real estate (shown in Figure 9), all anchored along a main street in St Mary Ward, the backbone of a neighbourhood (Dufaux and Olson 2009 and 2014). In each case the will required the intervening generation to keep the various properties insured and forbade their alienation. This protected the properties from claims arising from other enterprises,11 and brought them under collective supervision exercised by the executors and parents or guardians of the eventual great-grandchildren.
When the rhythm of investment in Notre Dame Street East was interrupted in July 1852 by a great conflagration, fifty members of the family were called together to authorize the sale of a lot to enable the rebuilding of another; and forty years later eighteen parties (couples or widows) gathered to determine who would negotiate with the city over the street widening. Accounts rendered make it possible to see benefits to each generation.12 The eventual owners (in the third or fourth generation) acquired the capital and indeed capital gains, while the older generation (notably widows and long-lived maiden daughters in the second generation) had enjoyed occupancy and usufructuary income from rentals of the ground-floor commercial façades and second-and third-story dwellings. Thanks to the unbroken collaboration of at least 30 couples over five generations, this family achieved a new status in terms of social class, and we can identify 114 persons involved as usufructuaries, as decision agents, or as heirs.
10 Important exceptions include Halbwachs 1909; Einhorn 2001; Rodger 2001; Nootens 2005; Pfirsch 2009;
Kasakoff, Lawson, and Van Meter 2014; Sweeny 2015.
11 BAnQ, Cour supérieure, Expropriation de la rue Notre Dame Est (TP11, S2, SS2, SSS42, D184-1891-10). 12 For example, BAnQ, Act of notary J.E.O. Labadie, 14 January 1852, Accounting of François Désautels,
Figure 9: A family network of property ownership in a Montreal neighbourhood of 1880
Highlighted are the 12 properties owned by descendants of Désautels and O’Brien along Notre Dame Street East. Rectangles are sized in proportion to the municipal valuation in 1880. The street runs 3.5 km from centre city at bottom, northeast to the city limit at top.
Sources: BAnQ, Cour supérieure, Expropriation de la rue Notre Dame Est, 1891; municipal tax roll of June 1880.
On the other side of town, Joseph Gareau employed the same legal mechanism (‘substitution’) to establish his family of sixteen children.13 Gareau was a man who could not sign his own name, but seems to have done business as an innkeeper, labourer, and trader. Like Désautels and O’Brien, Gareau was subdividing property on
13 BAnQ, Act of notary L-S. Martin. In addition to the will of 26 July 1842, Gareau and his wife, Agathe
the city’s frontier of growth. His arrangements to supply labour and materials for the work of stonemasons and carpenters contributed to construction of liveable dwellings for all of them, but did not stretch to commercial development on the scale of the Désautuels. Observation over five generations and 110 years uncovers a comparable range of neighbouring, two kilometres along the main street of St Antoine Ward, and one of Gareau’s daughters, like O’Brien’s daughter, contracted a strategic marriage with an adjoining landowner.
The horizon of four generations was formalized consistent with a legal tradition reaching back to the 13th-century Custom of Paris. In a rapidly industrializing city, expectations of rising property values motivated Gareau, O’Brien, Desautels, and various of their neighbours to invest in real estate on the growing edge of the city, to constrain their offspring to hold onto their properties, to maintain them, and, if necessary, to rebuild. In the half-century 1850‒1900 Montreal increased its population tenfold and likewise its property valuation. The same expectations of rising values stimulated speculation and motivated the municipal corporation to overvalue the properties, to demand unrealistic standards of reconstruction, and, in each generation, to borrow heavily from the next (Molotch 1976).14 The will of Jean-Louis Beaudry provides further insight into the investment horizon of an urban property owner and the wide range of factors he took into consideration. Worth half a million dollars, socially prominent, mayor of Montreal for a total of nine years, Beaudry had fathered two families of children, four with his wife and four with another woman. In making his will he rejected the legislative (and customary) provision that would exclude his four illegitimate sons from inheriting, and he calculated 13 years into the future, from the drawing up of the document in 1881 to the moment when the last-born would reach the age of 24 years (1894).15 He assigned properties to the two sets of children in separate clusters (near their respective mothers), and preserved the home locations of the four already married. Anticipating overall increase in land values and uneven changes on the various parcels, Beaudry specified that in the last year of their supervision the executors (an architect and a broker) should re-estimate and equalize the legacies. His expectation of erratic changes clarifies his own prior strategy of dispersing acquisitions among business and residential properties, at various distances from the centre (Figure 10). Rising values distinguish the urban context from most rural contexts, and Beaudry himself figured in the collaboration of investors and municipal councillors who constituted the ‘growth machine’ of his generation.
14 Under pressure from the provincial and federal monopolization of most forms of taxation (income, sales,
value added), Ville de Montréal still relies for two-thirds of its annual revenue on the real estate tax.
15 BAnQ, Act of notary A.O. Brousseau, 29 December 1881, will of J.-L. Beaudry, and codicil 14 September
Figure 10: Properties designated in the will of J.-L. Beaudry, Montreal, 1885
Rectangles are proportioned to valuations (land and buildings) in the tax roll of 1880. The grey dashed line surrounds the central business district (“Old Montreal”) and the high-value commercial axis of St Lawrence “Main.”
6. Conclusions
From these experiments, limited though they are to one city, and to case studies cut out and unravelled from larger networks, we rediscover the same structures and strategies as in the countryside. Strategic marriages, business partnerships, and property development were jointly conceived with a horizon of ‘family’ to the third and fourth generations, braiding together personal trajectories, and differentiating their little neighbourhoods. From relations of kinship we observed a structure nested at three levels of interaction across spaces and durations. At each level, the workings of ‘family’ were active within specific coordinates of place and obligation. The geographic cues are stimulating, but each new hypothesis demands careful testing with rigorous samples.
We now enjoy the resources of digital census data, effective techniques for nominal linkage, and snowballing complements of vital data released and digitized by genealogists, parishes, family history sources, and commercial interests. These have not yet stimulated systematic attention to the breadth of family networks in the big cities of North America, but the recent breakthroughs in geocoding and address-matching offer keys to the recovery of the multiple spatial networks in which a ‘census family’ operated. By setting families into the space–time context, we obtain indirect evidence of interactions whose complex motivations have been better recognized by novelists like Dickens and Balzac.
7. Acknowledgements
References
Alfani, G. and Munno, C. (2012). Godparenthood and social networks in an Italian rural community: Nonantola in the sixteenth and seventeenth centuries. In: Alfani, G. and Gourdon, V. (eds.). Spiritual kinship in Europe, 1500‒1900. New York: Palgrave Macmillan: 96‒123.doi:10.1057/9780230362703_4.
Alter, G. (1988).Family and the female life course: The women of Verviers, Belgium, 1849‒1880. Madison: University of Wisconsin Press.
Alter, G. (2013). Generation to generation: Life course, family and community.Social Science History 37(1): 1‒28.doi:10.1215/01455532-1958154.
Andrienko, N. and Andrienko, G. (2006).Exploratory analysis of spatial and temporal data: A systematic approach. Berlin: Springer.
Atkinson, P.D. (2011). Family size and expectations about housing in the later nineteenth century: Three Yorkshire towns.Local Population Studies 87: 13‒28. Bardet, J.-P. (1983). Rouen aux XVIIe et XVIIIe siècles: Les mutations d’un espace
social. Paris: SEDES.
Beck, A.M. (1973).The ecology of stray dogs: A study of free-ranging urban animals. Indianapolis: Purdue University Press.
Bender, J. and Marrinan, M. (2010). The culture of diagram. Stanford: Stanford University Press.
Bernard, C. (1865). Introduction à l’étude de la médecine expérimentale. Paris: Éditions Garnier-Flammarion.
Bischoff, P. (1997). D’un atelier de moulage à un autre: Les migrations des mouleurs originaires des Forges du Saint-Maurice et la segmentation du marché du travail nord-américain, 1851‒1884.Labour/Le travail 40(autumn): 21‒74.
Booth, C. (1898‒1899). Charles Booth’s London: Poverty maps and police notebooks [electronic resource]. London: London School of Economics and Political Science. http://booth.lse.ac.uk/
Brudner, L.A. and White, D.R. (1997). Class, property and structural endogamy: Visualizing networked histories. Theory and Society 26(2/3): 161‒208.
doi:10.1023/A:1006883119289.
Burgess, J. (2004). The Victorian town centre: Commerce and culture. In: Lauzon, G. and Forget, M. (eds.). Old Montreal: History through heritage. Montreal: Les Publications du Québec: 151‒198.
Cheshire, J. and Uberti, O. (2014).London: The information capital. London: Penguin. Darroch, G. (2000). Constructing census families and classifying households:
‘Relationship to head of family or household’ in the 1901 Census of Canada. Historical Methods 33(4): 10‒26.doi:10.1080/01615440009598962.
Devrieze, A. and Vanhaute, E. (2001). Working-class girls: The life-courses of 33
women cotton workers in Ghent around 1900. Revue belge d’histoire
contemporaine 31(3/4): 557‒578.
Diderot, D. (2004). Éléments de physiologie. (Texte établi par P. Quintili.) Paris: Honoré Champion.
Diderot, D. and d’Alembert, J. (1751). Encyclopédie, tome premier, Prospectus [electronic resource]. Chicago: ARTFL Encyclopédie Project (ed. Robert Morrissey), University of Chicago. http://encyclopedie.uchicago.edu/
Drucker, J. (2014). Graphesis: Visual forms of knowledge prediction. Cambridge: Harvard University Press.
Dufaux, F. and Olson, S. (2009). Reconstruire Montréal, rebâtir sa fortune.Revue de Bibliothèque et Archives nationales du Québec 1: 44‒57.
Dufaux, F. and Olson, S. (2014). Rebuilding a neighbourhood of Montreal. In: Bonnell, J. and Fortin, M. (eds.).Historical GIS research in Canada. Calgary: University of Calgary Press: 153‒179.
Einhorn, R.L. (2001). Property rules: Political economy in Chicago, 1833‒1872. Chicago: University of Chicago Press.
Franzosi, R. (2005). From words to number: Narrative, data, and social science. Cambridge: Cambridge University Press.
Frisby, D. (1992).Simmel and since: Essays on Georg Simmel’s social theory. London: Routledge.
Gauvreau, D. and Olson, S. (2008). Mobilité sociale dans une ville industrielle nord-américaine: Montréal, 1880–1900. Annales de démographie historique 1: 89– 114.doi:10.3917/adh.115.0089.
Gilliland, J., Olson, S., and Gauvreau, D. (2011). Did segregation increase as the city expanded? The case of Montreal 1881‒1901.Social Science History 35(4): 465‒ 503.doi:10.1215/01455532-1381823.
Gould, P. (1991). Dynamic structures of geographic space. In: Brunn, S.D. and Leinbach, T.R. (eds.). Collapsing space and time: Geographic aspects of communication and information. London: Harper Collins: 10‒15.
Goulet, D. and Keel, O. (1990). Santé publique, histoire des travailleurs et histoire
hospitalière: Sources et méthodologie. Bulletin du Regroupement des
chercheurs-chercheures en histoire des travailleurs et travailleuses du Québec 16(2–3): 67‒80.
Gribaudi, M. and Blum, A. (1990). Des catégories aux liens individuels: L’analyse statistique de l’espace social. Annales ESC 45(1): 1365‒1402. doi:10.3406/ ahess.1990.278914.
Guzzi-Heeb, S. (2012). Spiritual kinship, political mobilization and social cooperation: A Swiss Alpine valley in the eighteenth and nineteenth centuries. In: Alfani, G. and Gourdon, V. (eds.). Spiritual kinship in Europe, 1500‒1900. New York: Palgrave Macmillan: 183‒203.doi:10.1057/9780230362703_7.
Hägerstrand, T. (1982). Diorama, path and project. Tijdschrift voor economische en sociale geografie73(6): 323‒339.doi:10.1111/j.1467-9663.1982.tb01647.x. Hägerstrand, T. (2004). The two vistas. Geografiska Annaler 86 (B-4): 315‒323.
doi:10.1111/j.0435-3684.2004.00170.x.
Halbwachs, M. (1909).Les expropriations et le prix des terrains à Paris (1860‒1900). Paris: Rieder-Comély.
Hansen, D., Shneiderman, B., and Smith, M.A. (2010). Analyzing social media networks with NodeXL: Insights from a connected world. Burlington: Elsevier. Henry, L. and Blum, A. (1988). Techniques d’analyse en démographie historique.
Hentschel, K. (2014).Visual cultures in science and technology: A comparative history. Oxford: Oxford University Press. doi:10.1093/acprof:oso/9780198717874.001. 0001.
Hillier, B. (1996).Space is the machine: A configurational theory of architecture. New York: Cambridge University Press.
Hoskins, R. (1989). Workers at the Grand Trunk Railway shops.Cahiers de géographie du Québec 33(90): 323‒344.doi:10.7202/022052ar.
Kasakoff, A.B., Lawson, A.B., and Van Meter, E.M. (2014). A Bayesian analysis of the spatial concentration of individual wealth in the US North during the nineteenth century.Demographic Research30(36): 1035‒1074.doi:10.4054/DemRes.2014. 30.36.
Kok, J. and Mandemakers, K. (2010). A life-course approach to co-residence in the Netherlands, 1850–1940.Continuity and Change 25(2): 285‒312.doi:10.1017/S 0268416010000160.
Kwan, M.-P. (2002). Feminist visualization: Re-envisioning GIS as a method in
feminist geographic research. Annals of the Association of American
Geographers92(4): 645‒661.doi:10.1111/1467-8306.00309.
Laslett, P. and Wall, R. (eds.) (1972).Household and family in past time: Comparative studies in the size and structure of the domestic group over the last three centuries. Cambridge: Cambridge University Press.doi:10.1017/CBO97805115 61207.
Latour, B. (1990). Drawing things together. In: Lynch, M. and Woolgar, S. (eds.). Representation in scientific practice. Cambridge: MIT Press: 19‒68.
Lauzon, G. (2015). Pointe-Saint-Charles: L’urbanisation d’un quartier ouvrier de Montréal, 1840‒1930. Montreal: Septentrion.
Lemercier, C. (2005). Analyse de réseaux et histoire de la famille: Une rencontre encore à venir?Annales de démographie historique 1: 7‒31.doi:10.3917/adh.109.07. Long, J. (2005). Rural‒urban migration and socioeconomic mobility in Victorian
Britain. Journal of Economic History 65(1): 1‒34. doi:10.1017/S0022050705 050011.
Mandemakers, K. (1993). Basic elements of a scheme for a successful classification of occupational titles in an interdisciplinary, historical and international perspective. In: Schürer, K. and Diederiks, H. (eds.). The use of occupations in historical analysis. St. Katharinen: Ascripta Mercaturae: 41‒48.
Marttila, J. (2010). Beyond the family and the household: Occupational family networks. Journal of Family History 35(2): 128‒146. doi:10.1177/0363199009 353562.
Moles, A. and Rohmer, E. (1972).Psychologie de l’espace. Paris: Casterman.
Molotch, H. (1976). The city as a growth machine: Toward a political economy of place.American Journal of Sociology 82(2): 309‒332.doi:10.1086/226311. Neven, M. (2002). The influence of the wider kin group on individual life-course
transitions: Results from the Pays de Herve (Belgium), 1846‒1900. Continuity and Change 17(3): 405‒435.doi:10.1017/S026841600200440X.
Nootens, T. (2005). ‘What a misfortune that poor child should have married such a being as Joe’: Les fils prodigues de la bourgeoisie montréalaise, 1850‒1900. Canadian Historical Review 86(2): 225‒256.doi:10.3138/chr/86.2.225.
Olson, S. (2015). Ladders of mobility in a fast-growing industrial city. In: Baskerville, P. and Inwood, K. (eds.). Lives in transition, longitudinal analysis from historical sources.Montreal: McGill-Queen’s University Press: 189‒210. Olson, S. and Thornton, P. (2011).Peopling the North American city: Montreal 1840‒
1900.Montreal: McGill-Queen’s University Press.
Oris, M. and Alter, G. (2001). Paths to the city and roads to death: Mortality and migration in east Belgium during the industrial revolution. Revue belge d’histoire contemporaine 31(3/4): 453‒495.
Palsky, G. (1996). Des chiffres et des cartes: Naissance et développement de la cartographie quantitative française au XIXe siècle. Paris: Ministère de l’enseignement supérieur et de la recherches.
Perrenoud, A. (1979).La population de Genève du seizième au début du dix-neuvième siècle: Étude démographique. Paris: Champion.
Pinol, J.-L. and Garden, M. (2009). Atlas des Parisiens de la Révolution à nos jours. Paris: Parigramme.
Plakans, A. and Wetherell, C. (2003). Households and kinship networks: The cost and benefits of contextualization.Continuity and Change 18(1): 49‒76.doi:10.1017/ S0268416003004454.
Poitras, C. (2000). La cité au bout du fil: Le téléphone à Montréal de 1879 à 1930. Montreal: Presses de l’Université de Montréal.
Pred, A. (1981). Production, family, and free-time projects: A time-geographic perspective on the individual and societal change in nineteenth-century US cities. Journal of Historical Geography 7(1): 3‒36. doi:10.1016/0305-7488(81) 90082-7.
Rodger, R. (2001). The transformation of Edinburgh, land, property and trust in the nineteenth century. Cambridge: Cambridge University Press.
Rosenthal, P.-A. (1999).Les sentiers invisibles: Espace, familles et migrations dans la France du 19e siècle. Paris: EHESS.
Rueck, D. (2014). ‘I do not know the boundaries of this land, but I know the land which I worked’: Historical GIS and Mohawk land practices. In: Bonnell, J. and Fortin, M. (eds.). Historical GIS research in Canada. Calgary: University of Calgary Press: 129‒152.
Ruggles, S. and Brower, S. (2003). Measurement of household and family composition in the United States, 1850‒2000. Population and Development Review 29(1): 73‒101.doi:10.1111/j.1728-4457.2003.00073.x.
Schürer, K. (2004). Leaving home in England and Wales 1850–1920. In: Van Poppel, F., Oris, M., and Lee, J. (eds.). The road to independence: Leaving home in western and eastern societies, 16th–20th centuries. Bern: Peter Lang: 33‒84.
Schwartzman, K., Brassard, P., Gilliland, J., Dufaux, F., Henry, K., Buckeridge, D., and Olson, S. (2012). Geomatics as a tool for bridging the cultures of research. In: Chrisman, N. and Wachowicz, M. (eds.). The added value of scientific networking: Perspectives from the GEOIDE Network Members 1998–2012. Quebec: GEOIDE: 75–100. https://era.library.ualberta.ca/files/tq57nr288/GEOI DE_BookVF_Web.pdf.
Seung, S. (2012). Connectome: How the brain’s wiring makes us who we are. New York: Houghton Mifflin Harcourt.
Simmel, G. (2009).Sociology: Inquiries into the construction of social forms. Leiden: Brill.
Southall, H. (2011). Rebuilding the Great Britain historical GIS. Historical Methods 44(3): 149‒159 (Part 1); 45(3): 119‒134 (Part 2); 47(1): 31‒44 (Part 3).
Sweeny, R.C.H. (2015). Why did we choose to industrialize? Montreal, 1819–1849. Montreal: McGill-Queen’s University Press.
Sweeny, R.C.H. and Olson, S. (2003). MAP: Montréal l’avenir du passé: sharing geodatabases yesterday, today and tomorrow.Geomatica 57(2): 145‒154. Szreter, S. (1996). Fertility, class, and gender in Britain, 1860‒1940. Cambridge:
Cambridge University Press.doi:10.1017/CBO9780511582240.
Thornton, P. and Olson, S. (2011). Mortality in late nineteenth-century Montreal: Geographic pathways of contagion. Population Studies 65(2): 157‒181.
doi:10.1080/00324728.2011.571385
Tufte, E.R. (1983).The visual display of quantitative information. Cheshire: Graphics Press.
Tufte, E.R. (1990).Envisioning information. Cheshire: Graphics Press.
Unwin, A. (2006). Interacting with graphics. In: Unwin, A., Theus, M., and Hofmann, H. (eds.).Graphics of large datasets: Visualizing a million. New York: Springer: 73‒101.doi:10.1007/0-387-37977-0_4.
Van Leeuwen, M., Maas, I., and Miles, A. (2004). Creating an historical international standard classification of occupations (HISCO): An exercise in multi-national, interdisciplinary co-operation.Historical Methods 37(4): 186‒197.doi:10.3200/ HMTS.37.4.186-197.
Villareal, C., Bettenhausen, B., Hanss, E., and Hersh, J. (2014). Historical health conditions in major US cities: The HUE data set.Historical Methods 47(2): 67‒ 80.doi:10.1080/01615440.2013.874005.
Wrigley, E.A. (1997). English population history from family reconstitution, 1580– 1837. Cambridge: Cambridge University Press. doi:10.1017/CBO978051166 0344.