VOLUME 37, ARTICLE 7, PAGES 147,188
PUBLISHED 25 JULY 2017
http://www.demographic-research.org/Volumes/Vol37/7/ DOI: 10.4054/DemRes.2017.37.7
Research Article
Childbearing trends in Iceland, 1982–2013:
Fertility timing, quantum, and gender
preferences for children in a Nordic context
Ari Klængur Jónsson
© 2017 Ari Klængur Jónsson.
This open-access work is published under the terms of the Creative Commons Attribution NonCommercial License 2. 0 Germany, which permits use, reproduction & distribution in any medium for non-commercial purposes, provided the original author(s) and source are given credit.
1 Introduction 148
2 Background 150
2.1 The Nordic fertility regime 150
2.2 The Icelandic saga: A short introduction 151
2.3 Female labour force participation, educational attainment, and
postponement of family formation 152
2.4 The TFR and different components of fertility 153
3 Data and methodology 154
3.1 Method 154
3.2 Data 155
3.3 Models and variables 156
4 Results 157
4.1 First births 157
4.1.1 Tempo or quantum: Progression to parity one by decade 157 4.1.2 The force of fertility: Annual index of first birth 158
4.1.3 Annual indices of first birth by age groups 160
4.2 Second and third births 162
4.2.1 Tempo or quantum: Progression to parities two and three by decade 162 4.2.2 The force of fertility: Annual indices of second and third births
rates 163
4.2.3 Changes in birth spacing over time 165
4.2.4 Second- and third-birth rates relative to higher-order births 167
4.3 Gender preferences 168
4.3.1 Progression to parity three by sex of previously born children 168 4.3.2 Annual indices of third births by sex of previously born children 169
5 Summary and discussion 170
6 Acknowledgements 172
References 173
Childbearing trends in Iceland, 1982–2013: Fertility timing,
quantum, and gender preferences for children in a Nordic context
Ari Klængur Jónsson1
Abstract
BACKGROUND
Iceland is one of the most gender-equal countries in the world, but one that does not seem to have experienced the same fertility fluctuations as most other countries, following the enhanced role of women in society.
OBJECTIVE
In this study we examine the childbearing trends in Iceland during 1982–2013 by analysing the progressions to parities one, two, and three. We also investigate whether there is evidence of gender preferences for children among Icelandic parents.
METHODS
Official individual longitudinal register data is used, covering the total female population born in Iceland between 1941 and 1997. The data is analysed by means of event history analysis.
RESULTS
We find evidence of tendencies to postpone motherhood during the period, with increases in fertility for women in their 30s and 40s. The propensity to have a second and a third child has not declined; on the contrary, these birth intensities have increased since the mid-1980s. Estimates suggest that Icelandic parents prefer to have daughters.
CONCLUSIONS
During a period of increased educational attainment and postponed family formation, the resilience of Icelandic fertility is intriguing.
CONTRIBUTION
The study provides the first comprehensive overview of fertility trends in Iceland.
1. Introduction
The aim of the following analyses is to provide the first comprehensive overview of the childbearing trends in Iceland during the last three decades. Iceland is a modern yet insular country with a population of about 330,000. The island is located in the middle of the North Atlantic Ocean, some 1,000 kilometres from the nearest coast of Scandinavia. In many respects it shares the same history and culture, has a similar policy setup, and has experienced many of the same societal changes as in the other Nordic countries: Denmark, Finland, Norway, and Sweden. In some aspects, Iceland can be seen as an ultra-Nordic country. It has fertility levels that exceed those of its Scandinavian neighbours, and is simultaneously a vanguard in terms of childbearing outside of marriage. The latter feature has been a salient attribute of childbearing behaviour for centuries (Björnsson 1969). Around two out of every three births today occur outside marriage, compared to roughly two in five in the early 1980s, and roughly one in four in the 1960s. Nevertheless, the majority of children are born into coresidential unions due to the large proportion of people living in nonmarital cohabitation, another prevailing and long-lasting aspect of family formation in Iceland (Statistical Series 2014; Statistics Iceland 2016; Björnsson 1969).
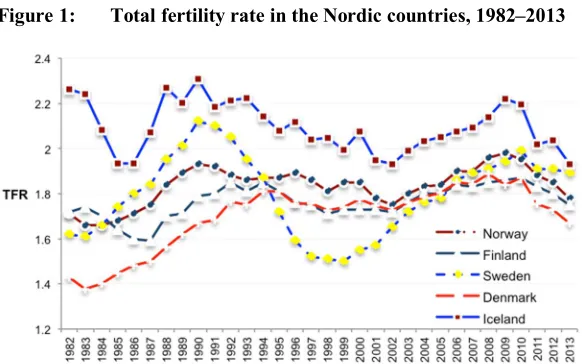
Figure 1: Total fertility rate in the Nordic countries, 1982–2013
Sources: Statistics Norway (2016), Statistics Finland (2016), Statistics Sweden (2016), Statistics Denmark (2016), Statistics Iceland (2016)
2008). While all of the other Nordic countries have displayed a total fertility rate (TFR) below 1.7 at some point during the last 30 years, and Denmark and Sweden have even experienced a TFR below 1.5, as of 2013 the Icelandic TFR has never fallen below 1.9. In fact, the country’s TFR has flirted with a replacement level of 2.1 children per woman throughout the investigation period, as Figure 1 shows, either just below the mark or just above it. This stability is interesting in light of the many societal and family-related changes that took place during the period and the concurrent postponement of parenthood which is assumed, at least periodically, to be captured by a sizable decrease in the TFR.
In this study, more sophisticated methods than those associated with the TFR will be utilized. As a first in relation to Iceland, we will apply an event history analysis on Icelandic longitudinal individual register data with the purpose of presenting parity-specific childbearing trends. The data covers the total population of women born in Iceland during 1941–1997. This will enable us to produce annual indices of first, second, and third births, presented as the relative risks of giving birth by calendar year, standardized for age and, where appropriate, duration since previous birth. This allows us to investigate the underlying childbearing behaviour – or in other words, to estimate changes in the “force of fertility” over calendar years without many of the shortcomings associated with the TFR (Andersson 1999: 4). Furthermore, on the basis of synthetic cohorts we will estimate whether childlessness has increased over time and investigate whether the proportion of mothers giving birth to a second and a third child has changed. We will also analyse changes in birth spacing patterns over time, which allows us to provide better insight into changes in tempo as well. Finally, we will look for evidence of gender preferences in Iceland. In a fully egalitarian society the gender system should be neutralized, and as a result we should not be able to find daughter or son preferences (Pollard and Morgan 2002). However, the trends observed in Scandinavia suggest that “the role […] the societal gender system plays in the formation of sex preference for children” is not altogether straightforward (Andersson et al. 2006: 265). Examining gender preferences in Iceland will offer insight into this puzzle.
deliberation on the data and method, results are presented. Finally, we summarize and reflect upon the main findings.
2. Background
2.1 The Nordic fertility regime
The Nordic countries, i.e., Iceland, Sweden, Norway, Denmark, and Finland, are commonly grouped together as belonging to the same welfare state regime – the social democratic regime – which, in relative terms, promotes high standards of equality with regard to social rights, state services, and benefits to its citizens (Esping-Andersen 1990). In addition to a shared cultural and historical heritage, all the Nordic countries maintain strong welfare systems promoting social and gender equality. Women’s labour force participation is almost the same as men’s, public support to families is generous, and standards of living are relatively high (Andersen and Korpi 1987; Esping-Andersen 1990; Korpi and Palme 1998; Esping-Esping-Andersen 2002a, 2002b; Eydal and Gíslason 2011). Although each country has its own characteristics, the parental leave schemes, including employment security after childbirth, the education systems, the availability of highly subsidized childcare, and flexible employment opportunities in general, are all important attributes of the Nordic welfare regime (Esping-Andersen 2002b; Eydal and Gíslason 2011).
In light of the relatively high fertility in the region and the high labour force participation among women, an association between the institutions of the welfare regime and fertility outcomes has been suggested on numerous occasions – working both directly and indirectly through other related factors (e.g., Esping-Andersen and Billari 2015; Goldscheider, Bernhardt, and Lappegård 2015; McDonald 2000, 2013; Duvander, Lappegård, and Andersson 2010; Andersson 2008; Garðarsdóttir 2008; Rønsen and Skrede 2008). Several studies have established an association between the social policies in the Nordic countries and childbearing behaviour (e.g., Hoem 1993a; Andersson 1999; Duvander, Lappegård, and Andersson 2010), while others have assessed the impact of the labour market on fertility, often in conjunction with social policies (e.g., Hoem and Hoem 1996; Andersson 2000; Vikat 2002, 2004). To a large extent, this is still uncharted territory in Iceland, but the similarities in timing of family policy reforms2 and the turning points in the TFR in Figure 1 (e.g., in the late 1980s and at the beginning of the 2000s) suggest that family policies could be associated with childbearing trends – in addition to the covariation with the business cycle during the
period (Duvander et al. 2016; Jónsson 2016). Moreover, the recent stability in fertility at ‘highest-low’ levels in the Nordics, albeit with some differences between countries over time (Andersson 2004), the stability in completed fertility over cohorts (Andersson et al. 2009), and the evidence of daughter preferences in fertility (Andersson et al. 2006) have led to the notion of a “common Nordic fertility regime” at the turn of the century (Andersson et al. 2009: 339).
A shared finding among three of the four Nordic countries outside Iceland is a development of a preference to have daughters. In the Nordics in general, parents of same-sex children have been shown to have a 20–25% higher propensity to have a third child compared to parents of a boy and a girl, indicating that most parents opt to have at least one child of each sex (Andersson et al. 2006). In the late 1970s in Denmark and the early to mid-1980s in Sweden and Norway, parents of two sons showed a higher propensity to have a third child than did parents of either a son and a daughter or two daughters – which is interpreted as evidence of daughter preferences. In Finland, on the other hand, son preferences have remained stronger; although there were indications of changes in this pattern in the mid- to late 1990s (Andersson et al. 2006; Saarela and Finnäs 2014).
2.2 The Icelandic saga: A short introduction
According to the Economic Forums Global Gender Gap Index, Iceland is one of the most gender-equal countries in the world (Hausmann et al. 2006–2014). Its modern family policies are constructed as to allow parents to combine work and family, and are targeted at increasing gender equality (Eydal 2008). However, over the past decades the Icelandic welfare system has deviated in some important aspects from the welfare systems of the other Nordic countries, and the concept of ‘family policy’ was hardly used in public debate until the 1990s (Eydal and Gíslason 2008). The social expenditure in Iceland, as a percentage of the country’s gross national product, has been lower than the OECD average during most of the period under investigation (OECD 2016a). When it comes to expenditures on benefits and services specifically targeted at families and children, Iceland scores relatively high in an OECD comparison (OECD 2016b); but in a Nordic context, these expenditures were relatively low until the beginning of the 2000s (Nordic Statistics 2016; Ólafsson 1993; Eydal and Gíslason 2008).
Then, during the 1990s and early 2000s, new childcare policies were implemented that allowed Iceland to catch up to its neighbours (Eydal 2008; see Eydal and Gíslason 2011 for an overview of Nordic childcare policies). Nevertheless, even after 2000 the childcare gap – the period from the end of paid parental leave until the child is enrolled in preschool – was still larger in Iceland than in the other Nordics, making it harder for parents to coordinate family life and work (Eydal 2008).
2.3 Female labour force participation, educational attainment, and postponement of family formation
With regard to the lag in implementing institutions that support childbearing and childrearing, the high fertility in Iceland is intriguing (Garðarsdóttir 2008). Female labour force participation increased around the same time here as in the other Nordic countries, with strong increases during the 1960s (Garðarsdóttir 2008). At the beginning of the 1970s, roughly every second woman was active on the labour market. In the 1980s the female employment rate was around 65–70%, and in the 2000s it was around 80% (Statistical Series 2005a; Garðarsdóttir 2008; Statistics Iceland 2016). Furthermore, around 40% of all university students were women in the late 1970s, a figure that had risen to 50% by the mid- to late 1980s and that has remained at roughly 60% since the 2000s. During the period of interest (1982–2013), the absolute number of female university students roughly quadrupled while the number of male students doubled (Statistics Iceland 2016; Statistical Series 2005a).3 At the same time, aggregate fertility remained high.
Increased educational attainment among women should entail postponement effects on parenthood (Gustafsson 2005; Billari, Liefbroer, and Philipov 2006). In line with expectations, statistics show that people have postponed family formation during the period of interest, when it comes to both entering marriage and becoming a parent. People are marrying later in life, and in the post-2000 decade couples entered marriage in their early to mid-30s, compared to their mid-20s in the 1980s. As with mean age at first marriage, the mean age of women at childbirth increased between 1982 and 2013, the first and last years of our study period. In 1982 the mean age at childbirth, regardless of parity, was 26 years, while in 2013 it was 30. A similar trend is visible when we focus on only primiparas. The mean age of women when becoming a mother for the first time was 22 in 1982 and 27 in 2013. The mean age of fathers has followed a similar pattern during the period, with the men’s age two to three years higher than
3 For a more detailed account of crude fertility trends, educational attainment, and female labor force
that of the women (Statistical Series 2005b; Garðarsdóttir 2008; Statistics Iceland 2016).
2.4 The TFR and different components of fertility
The postponement of parenthood described above and the stability in the TFR over time do constitute somewhat of an interesting conundrum, as the postponement of first births is expected to result in a decreased TFR (Goldstein, Sobotka, and Jasilioniene 2009; Frejka and Sobotka 2008). As the average age at birth increases, the decrease in the TFR should be proportional to the pace of postponement. An increase by three months per year in the average age at childbirth is estimated to decrease the TFR by 25% from what it would have been if there had been no postponement (Goldstein, Sobotka and Jasilioniene 2009: 673). Between 1987 and 1992 the Icelandic TFR increased by 0.14 points (2.07→2.21), while simultaneously the mean age at first birth increased by almost 15 months (an average of about 3 months per year).4 The general stability in the TFR over calendar time thus indicates that the fertility recuperation at older ages has mitigated the effects of postponement on the TFR and/or that developments in higher-order birth intensities have counteracted the effects of women’s declining propensity to become a mother depending on their age.
The convolution narrated above highlights the lack of transparency associated with the TFR. The TFR does not take into account intervals between births or provide information about parity-specific trends, which ultimately give a more detailed picture of childbearing trends (Ní Bhrolcháin 1992; Hoem 1993b; Andersson 1999; Sobotka and Lutz 2010). The period TFR produces an estimate of how many children a woman is expected to have over her lifetime based on the accumulated age-specific rates in a given time period, usually a calendar year, and is thus based on a synthetic cohort of women (Schoen 2004). As a result, the TFR is sensitive to episodic changes in fertility – i.e., postponements of births and changes in the duration between births – and as a consequence does not reflect or capture the real changes women face over the life course, or take into an account that trends can differ between groups or be caused by compositional changes in the population (Andersson 1999; Hoem 2000; Garðarsdóttir 2008).
Distinguishing between timing and quantum aspects of fertility is pivotal when making assumptions about present trends and future outcomes. Part of the decline in fertility in Europe over the past decades has sometimes been explained as being based on a misinterpretation of childbearing data, stemming from the postponement of births
4 The mean age at birth, regardless of parity, increased by roughly 13 months between 1987 and 1992
rather than the outright abandonment of having children (Goldstein, Sobotka, and Jasilioniene 2009). Postponement effects can ‘distort’ the TFR, if it is not taken for what it is, and be incorrectly regarded as a cohort indicator instead of a cross-sectional measurement (Ní Bhrolcháin 1992; Sobotka and Lutz 2010). In the same way, recuperations at older ages can have boosting effects on the TFR and lead to a misinterpretation of the efficiency and real effects of, for example, pronatalist policy measures on fertility (Sobotka and Lutz 2010). Furthermore, without adjusting for compositional factors such as age, parity, and duration since previous birth, fertility comparison over time becomes less accurate, the actual group under exposure becomes distorted, and past fertility is allowed to influence future fertility (Ní Bhrolcháin 1987).
3. Data and methodology
3.1 Method
3.2 Data
Icelandic authorities have a long history of gathering information about the country’s population and vital events. The first census was conducted in 1703 and as such was the first (preserved) census in the world to cover the entire population of a country. Throughout the 18th, 19th, and 20th centuries several censuses were conducted on an irregular basis, over 20 in total (Statistical Series 2014). Since 1981 no traditional censuses have been conducted, and demographic events are registered as they occur. The current National Registry is largely rooted in the 1981 census.
The Icelandic National Registry records all major demographic events, including all births, deaths, and changes in marital status (including registered cohabitation), as well as any immigration or emigration of each individual ever receiving an identification number in Iceland. Hence, this data source gives access to the complete vital life event history of the Icelandic population with great precision. Demographic events can be combined with other administrative records, such as data from the tax registry, records on educational qualifications, and various other data, which offers great opportunities for demographic research in Iceland.
The data for our calculations is based on longitudinal individual register data derived from the Population Register, Migration Register, and Birth Register of the Icelandic National Registry. The dataset consists of reliable information with monthly accuracy on the demographic events of birth, death (where applicable), and migration history. The data contains information on the sex and birth order of each child. To be included in the study, the subjects had to be women born in Iceland between 1941 and 1997; each woman is followed from when she turns 15 years old until she turns 46. The small population of Iceland makes it possible to include the entire female population in the analyses. This ensures that observed differences are less dependent on statistical power; sampling biases and errors are of no concern.
3.3 Models and variables
The birth intensities in the following section are presented as relative risks of giving birth. The risk is dependent on both the number of births and the exposure time at risk. Changes in the relative risk over time can thus reflect changes in either quantum or timing of births, or both. In order to distinguish between the two, we also investigate the developments in birth intervals during our study period, and synthetic cohort measures of the progressions to parities one, two, and three.
In most of the models the birth intensities are given relative to the intensities in 1986 and, where appropriate, to a specific age group. There is no specific reason to choose 1986 over some other year, as the general trends would come out the same regardless of the year of reference. The birth intensities are interchangeably referred to as birth rate or risk in subsequent sections.
Unless otherwise specified, when it comes to first births, the ‘clock’ is set to zero at age 15 and women enter the analysis in 1982 or the month they turn 15, whichever comes last. The main duration variable is the woman’s age, and the time unit is measured in woman-months. We follow childless women until they give birth or are censored – i.e., if they emigrate, die, turn 46, or reach the end of the study period on December 31, 2013, whichever comes first. Women who had their first child before age 15 or before 1982 are excluded from the analyses, as well as everyone who emigrated before 1982 and did not return before their 15th birthday.
For second and third births the clock starts at the time of the previous birth. Women enter the analyses at that time or in 1982, whichever comes last, and the main duration variable is measured in months from the previous birth. The duration from the previous birth is categorized into nine groups: The first six years are given in six single-year groups; a duration of 73–96 months is categorized into one group; 97–120 months in another; and 121 months and more in another. The mother’s age is categorized into 12 groups, but the categories differ by parity. Mothers are right-censored on the same grounds as for first births and precensored if they gave birth a second/third time before 1982, had multiple births the first/second time, were older than 45 when they had their previous child, or emigrated before giving birth to their first or second child – depending on parity. Calendar year is a time-varying covariate included in 32 single-year categories in all parity-specific models (1982–2013).
acquired the desired gender composition among their children will be more likely to continue their childbearing (see Hank and Kohler 2000; Pollard and Morgan 2002; Andersson et al. 2006 for discussion). Background statistics on the distribution of live births and exposure times under risk by variable and parity are available in the Appendix.
4. Results
4.1 First births
4.1.1 Tempo or quantum: Progression to parity one by decade
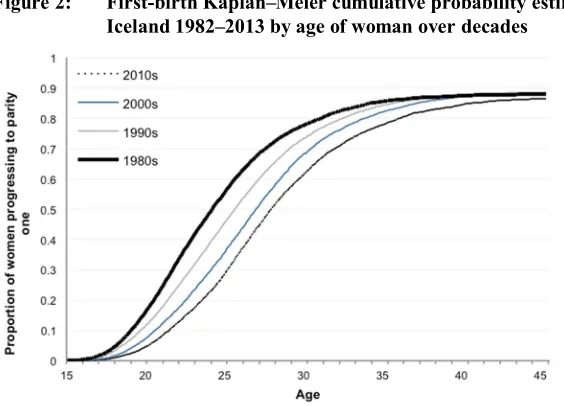
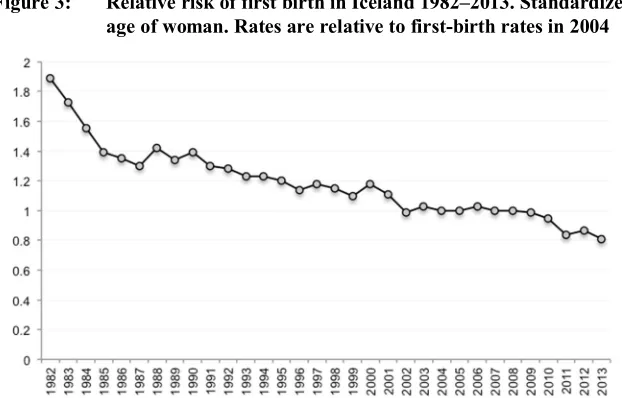
Figure 2 presents a graph of Kaplan–Meier (nonparametric) estimates displaying the cumulative probabilities of synthetic cohorts of childless Icelandic women progressing to parity one before turning 46, by decade: the 1980s, 1990s, 2000s, and 2010s. The estimates indicate that childlessness has not increased in Iceland during the period; at age 45 it ranges between 11 and 13% depending on the decade5. However, there are signs of continuous postponement as the estimates suggest that the age at which half of the women have progressed to motherhood has increased from one decade to the next. In the 1980s half of the women had given birth at age 24, while during 2010–2013 half had become mothers at age 27 (and 9 months). Hence, Icelandic women have delayed motherhood by more than a year per decade, but approximately the same number of women gave birth. Nevertheless, as illustrated in Figure 3, the postponement over time results in a decrease in the estimated first-birth rate.
5 The cumulative probability estimates should be taken with a grain of salt as they are not standardized for
Figure 2: First-birth Kaplan–Meier cumulative probability estimates in Iceland 1982–2013 by age of woman over decades
Source:Icelandic register data, author’s calculations
4.1.2 The force of fertility: Annual index of first birth
Figure 3: Relative risk of first birth in Iceland 1982–2013. Standardized for age of woman. Rates are relative to first-birth rates in 2004
Source:Icelandic register data, author’s calculations
Figure 4: First-birth rates in Iceland by age of woman 1982–2013. Rates are relative to first-birth rates of 25–26-olds in the 1980s
Source:Icelandic register data, author’s calculations
4.1.3 Annual indices of first birth by age groups
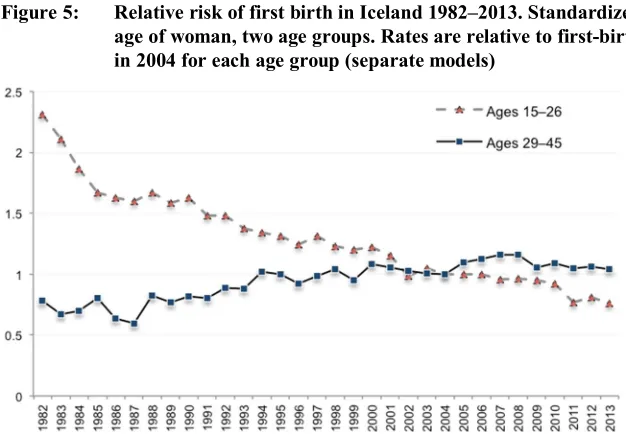
Figure 5 describes this scenario in more detail. Due to the multiplicative nature of the age specific trends, separate models were used for each of the two age groups displayed in the figure: 15–26 years and 29–45 years. The birth intensities at ages 27 and 28 developed differently than the age-specific birth risks in any of these two age groups. As a result they do not belong to either of the model specifications and are excluded from the presentation. As before, the rates are standardized for variation in age (within models) and are relative to the rates in each age group in 2004.6
In Figure 5 we can see the same trend of declining birth intensities for ages 15–26 throughout the period like in Figure 3, but with more force. The rate fell sharply between 1982 and 1986. After a relatively stable period between 1987 and 1990 it continued to fall at a somewhat slower rate until 2002, when the declining trend decelerated even further. The first-birth rate was approximately 130% higher in 1982 but around 25% lower in 2013 compared to 2004, indicating a vast decrease in the propensity to become a mother at ages 15 to 26.
6 The choice of baseline year is entirely arbitrary, but the magnitude of intensities in this year were quite
Figure 5: Relative risk of first birth in Iceland 1982–2013. Standardized for age of woman, two age groups. Rates are relative to first-birth rates in 2004 for each age group (separate models)
Source:Icelandic register data, author’s calculations
4.2 Second and third births
4.2.1 Tempo or quantum: Progression to parities two and three by decade
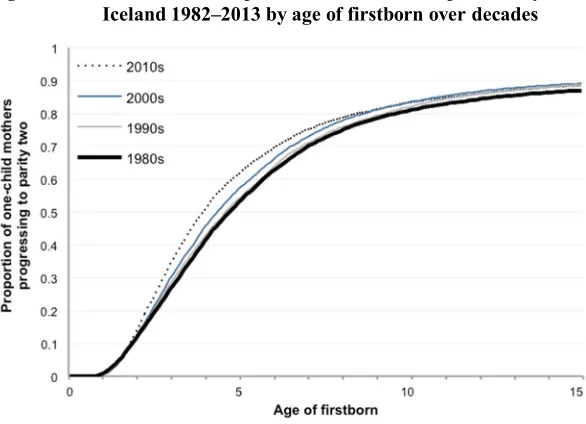
As with first births, the second-birth Kaplan–Meier cumulative probability estimates, derived from synthetic cohorts of Icelandic women, do not suggest much change in the final progression rate over the period. According to the estimates, between 87 and 89% of one-child mothers will have a second child by the time their firstborn turns 15, depending on decade (Figure 6). However, the estimates also suggest that the interval between first and second births was smaller in 2010–2013 than in previous decades. Half of the women had given birth to a second child by the time their first child was four years old during 2010–2013, compared to almost five years old in the 1980s.
Figure 6: Second-birth Kaplan–Meier cumulative probability estimates in Iceland 1982–2013 by age of firstborn over decades
Source:Icelandic register data, author’s calculations
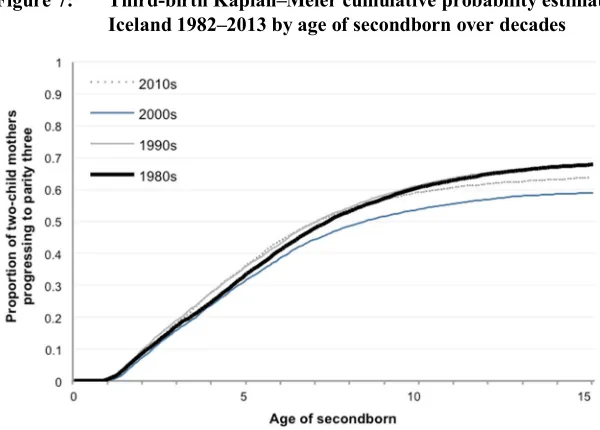
relatively small differences in the final levels of women giving birth for the third time – another indication of stability in fertility over time, as measured based on synthetic cohorts. Nevertheless, to compare similar groups over time we will need to apply standardization in order to depict changes in the force of fertility during the period.
Figure 7: Third-birth Kaplan–Meier cumulative probability estimates in Iceland 1982–2013 by age of secondborn over decades
Source:Icelandic register data, author’s calculations
4.2.2 The force of fertility: Annual indices of second and third births rates
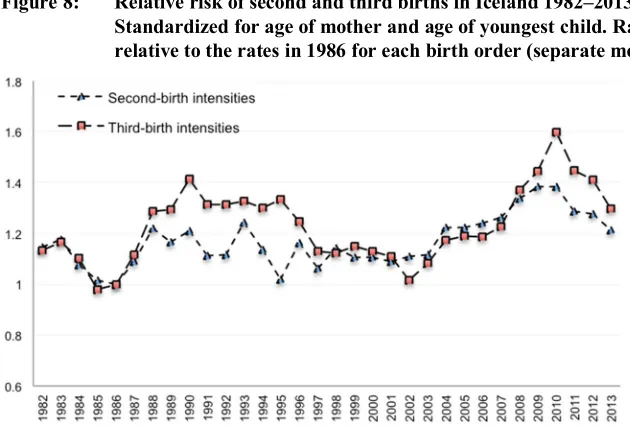
Figure 8 features the standardized annual indices of second- and third-birth rates between 1982 and 2013 derived from two separate models. The rates are presented as birth intensities relative to the year 1986 for each parity, and are standardized for the mother’s age and the duration since the previous birth over calendar years. Hence, both are annual indices only comparable to the specific birth order, but do not tell us the absolute differences in the propensity to give birth to a second and a third child.
than those at comparable ages in 1986. During the period from 2004 to 2013 the birth intensities were on average more than 20% higher than in 1986, with a gradual increase from one year to the next between 2003 and 2010. In 2011 the second-birth rate started to fall, but the propensity to have a second child was still 20% higher in 2013 than in 1986.
Figure 8: Relative risk of second and third births in Iceland 1982–2013. Standardized for age of mother and age of youngest child. Rates are relative to the rates in 1986 for each birth order (separate models)
Source:Icelandic register data, author’s calculations
In order to get a better understanding of these developments, we will look at changes in birth spacing over time. This gives us more insight into whether the increased birth rates are related to changes in the timing of births or changes in levels.
4.2.3 Changes in birth spacing over time
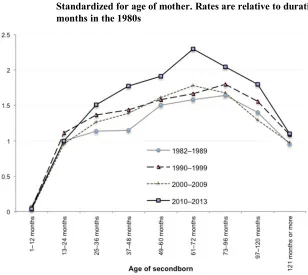
When we examine the birth spacing patterns and their development by decade between 1982 and 2013 (standardized for the age of mother, Figure 9a), we observe an earlier arrival of the second child in the last years of our study period.
Figure 9a: Second-birth rates in Iceland 1982–2013 by time since previous birth. Standardized for age of mother. Rates are relative to duration 13–24 months in the 1980s
Source:Icelandic register data, author’s calculations
in the last years of observation. In other words, the interval between first and second births was smaller in 2010–2013 than in previous decades.
Figure 9b: Third-birth rates in Iceland 1982–2013 by time since previous birth. Standardized for age of mother. Rates are relative to duration 13–24 months in the 1980s
Source:Icelandic register data, author’s calculations
the second birth during this period. To a large extent, this increase in third-birth rates corresponds to a shift in the age distribution of two-child mothers to higher ages.7
4.2.4 Second- and third-birth rates relative to higher-order births
Figure 10: Relative risk of second, third, fourth, and fifth births in Iceland 1982–2013. Standardized for age of mother and age of youngest child. Rates are relative to second-birth rates in 1986
Source:Icelandic register data, author’s calculations
An overview of the combined annual indices of second, third, fourth, and fifth births, standardized for the mother’s age and the duration since the previous birth over calendar year, reveals striking similarities in trends among the different parities of mothers. All rates are relative to the second-birth intensities in 1986, and in Figure 10 we can see how the third- and fourth-birth rates covary with the second-birth rate over time. There is more random variation in the fifth-birth rate, but it more or less follows suit. This observation is not unique to Iceland, as a similar trend has been observed in
7 The estimations derived from the third-birth multivariate model in the graph in Figure 9b have been
the case of Sweden, where the fluctuations in the third- and fourth-birth rates correspond closely to those in the second-birth rate (Andersson and Kolk 2015).
On average during the period, in relation to the second-birth rate, the third-birth rate was 43% lower, the fourth-birth rate was 68% lower, and the fifth-birth rate was 71% lower. The third-birth intensities are thus between those for second and fourth births, while the fourth and fifth birth intensities are at the same levels. Naturally, the populations under risk become increasingly small with increasing parity.
4.3 Gender preferences
4.3.1 Progression to parity three by sex of previously born children
Figure 11: Third-birth Kaplan–Meier cumulative probability estimates in Iceland 1982–2013 by age of secondborn over sex composition of previously born children
Source:Icelandic register data, author’s calculations
previous birth, there are indications that mothers of a boy and a girl progress more slowly to parity three than do mothers of same-sex children. Furthermore, at the end of the follow-up, fewer women with one child of each sex have had a third child. The lines do not converge, indicating that there is a difference not only in timing but in ultimate fertility as well.
When it comes to mothers of two daughters on the one hand and those of two sons on the other, a higher percentage of mothers of two sons have a third child. In the first six to seven years from the birth of the second child, both groups of women progress at a similar rate to parity three, but after this the two lines diverge. By the time the secondborn turns 15, 63% of mothers with a son and a daughter have had a third child, compared to 66% of mothers of two girls and 67.5% of mothers of two sons.
4.3.2 Annual indices of third births by sex of previously born children
Multivariate analyses support these indications of mixed-sex and daughter preferences. Figure 12 captures the trend over time with rates relative to those of a mother with a boy and a girl in 1986.
Figure 12: Relative risk of third births in Iceland 1982–2013 by sex composition of previous children. Standardized for age of mother and age of secondborn. Rates are relative to mothers of a boy and a girl in 1986
Figure 12 describes an underlying pattern of mixed-sex and daughter preferences throughout the period, but with a great deal of random variation. On average during 1982 and 2013, mothers of two girls had a 10% higher risk of having a third child compared to mothers of a boy and a girl, while mothers of two boys had a 14% higher risk. In other words, if we look at the propensity to have a third child among mothers of two boys on the one hand and those of two girls on the other, relative to one another, mothers of two boys showed an almost 4% higher risk than did mothers of two girls. Hence, we can assert that there is evidence of mixed-sex as well as slight daughter preferences for children in Iceland at the turn of the century.
5. Summary and discussion
In European demography, Iceland is an outlier with a fertility rate that far exceeds that of most countries on the continent. In times of low and declining fertility levels in many regions of the world, Iceland’s stability in fertility patterns across three decades makes the country an interesting case to study.
After changes in age schedules and past fertility have been accounted for, we do not observe any dramatic changes in the underlying childbearing behaviour across calendar time. What we do observe is a change in timing, especially with regard to first births. The propensity to become a mother has declined for women in their early and mid-20s – depicting a trend of gradual postponement of motherhood over time. During a period of increased educational attainment and postponement of family formation in general this is expected. The decline in first-birth intensities at the early ages is paralleled with increases for women in their 30s and 40s: an indication that fertility recuperation is taking place. We find no indications of increased childlessness. The cumulative probability estimates for synthetic cohorts of Icelandic women indicate that nine out of ten women become a mother, regardless of decade.
At the same time, the standardized second- and third-birth rates have fluctuated around remarkably stable averages of progression to parities two and three, and there are no obvious indications that the force of fertility has declined over the period when we compare similar groups over time. On the contrary, the second- and third-birth intensities have not only maintained their levels, but when we compare the early years of the study period to the last, we find that birth intensities were somewhat stronger in the latter.
have a third child at almost all durations since the second birth. Overall, the stability in second- and third-birth rates, also when estimated based on synthetic cohorts, is compelling: On average during the period, the estimates show that almost nine out of ten one-child mothers have a second child, and two out of three two-child mothers have a third child.
Although we have refrained from assessing any relationships, it is not unlikely that the timing of policy reforms has helped stabilize fertility trends and even helped increase fertility. We find strong indications of period effects in the late 1980s to the early 1990s, and also during most of the 2000s. The increases in the standardized second- and third-birth rates between 1987–1990, and again between 2004–2010, correspond to the timing of reforms made to the parental leave scheme. We observe a similar trend for fourth- and fifth-birth as well, and even a slight increase in the first-birth rate during the former period. The extent to which certain social and family policies have influenced the parity-specific birth intensities are topics for future research (cf. working paper by Duvander et al. 2016). The same holds for the role of any influence of the business cycle on the childbearing trends (cf. working paper by Jónsson 2016). Indeed, the economic shock that hit Iceland in 2008 is likely to have affected the behaviour in the very last years of observation – depicted by the declining birth intensities after 2010 (Figures 3 and 8).
We speculated earlier that possible explanations for the conundrum surrounding the stability of the TFR, given the increase in the average age at first birth, were that higher-order birth intensities had compensated for the postponement effects on the TFR, and that a process of recuperation in first-birth fertility was also underway. The analyses offer some support for these claims, although we should be careful when comparing different fertility measures, as the two methods are not fully comparable. Our period measures, stemming from regression models, are standardized for compositional changes in the actual population under risk.
Nordic welfare model and the emergence of daughter preferences, as we do not know the onset of these preferences.
Nevertheless, with all things considered – the postponement of motherhood in tandem with increased fertility at older ages, the persistently strong second- and third-birth intensities, the overall stability in the childbearing trends over time, and the evidence of daughter preferences – we believe we are safe in locating Iceland at the higher end of a common Nordic fertility regime. Iceland deviates from its Nordic neighbours in terms of its higher fertility, but most of the basic parameters of its childbearing dynamics appear to be similar to those in the other Nordic countries. However, it remains for the future to tell whether Iceland will remain a high-fertility country in the decades to come.
6. Acknowledgements
References
Andersson, G. (1999). Childbearing trends in Sweden, 1961–1997. European Journal of Population 15(1): 1–24.doi:10.1023/A:1006145610780.
Andersson, G. (2000). The impact of labour-force participation on childbearing behaviour: Pro-cyclical fertility in Sweden during the 1980s and the 1990s.
European Journal of Population 16(4): 293–333.
doi:10.1023/A:1006454909642.
Andersson, G. (2004). Childbearing developments in Denmark, Norway, and Sweden from the 1970s to the 1990s: A comparison. Demographic Research, Special Collection 3(7): 155–176.doi:10.1023/A:1006454909642.
Andersson, G., Hank, K., Rønsen, M., and Vikat, A. (2006). Gendering family composition: Sex preferences for children and childbearing behavior in the Nordic countries.Demography 43(2): 255–267.doi:10.1353/dem.2006.0010. Andersson, G. (2008). A review of policies and practices related to the ‘highest-low’
fertility of Sweden. Vienna Yearbook of Population Research 6(1): 89–102.
doi:10.1553/populationyearbook2008s89.
Andersson, G., Rønsen, M., Knudsen, L.B., Lappegård, T., Neyer, G., Skrede, K., Teschner, K., and Vikat, A. (2009). Cohort fertility patterns in the Nordic
countries. Demographic Research 20(14): 313–352.
doi:10.4054/DemRes.2009.20.14.
Andersson, G. and Kolk, M. (2015). Trends in childbearing, marriage and divorce in Sweden: An update with data up to 2012. Stockholm: Stockholm University, Department of Sociology (Stockholm Research Reports in Demography 2015: 20).
Billari, F.C., Liefbroer, A.C., and Philipov, D. (2006). The postponement of childbearing in Europe: Driving forces and implications. Vienna Yearbook of Population Research 4: 1–17.
Björnsson, B. (1969). Trúlofunarsambúð og samfélagsleg áhrif hennar. Reykjavík: Fræðslumálaskrifstofan (Fyrirlestur fluttur við Lagadeild Háskóla Íslands 25. nóvember 1968).
Brockmann, H. (2001). Girls preferred? Changing patterns of sex preferences in the two
German states. European Sociological Review 17(2): 189–202.
Duvander, A.-Z., Lappegård, T., and Andersson, G. (2010). Family policy and fertility: Fathers’ and mothers’ use of parental leave and continued childbearing in
Norway and Sweden. Journal of European Social Policy 20(1): 45–57.
doi:10.1177/0958928709352541.
Duvander, A.-Z., Lappegård, T., Andersen, S.N., Garðarsdóttir, Ó., Neyer, G., and Viklund, I. (2016). Gender equal family policy and continued childbearing in Iceland, Norway, and Sweden. Stockholm: Stockholm University, Department of Sociology (Stockholm Research Reports in Demography 2016: 02).
Esping-Andersen, G. and Korpi, W. (1987). From poor relief to institutional welfare states: The development of Scandinavian social policy. International Journal of Sociology 16(3–4): 39–74.
Esping-Andersen, G. (1990). The three political economies of the welfare state.
International Journal of Sociology 20(3): 92–123.
doi:10.1080/15579336.1990.11770001.
Andersen, G. (2002a). Towards the good society once again? In: Esping-Andersen, G., Gallie, D., Hemerijck, A., and Myles, J. (eds.). Why we need a new welfare state. Oxford: Oxford University Press: 1–25.
doi:10.1093/0199256438.003.0001.
Esping-Andersen, G. (2002b). A new gender contract. In: Esping-Andersen, G., Gallie, D., Hemerijck, A., and Myles, J. (eds.). Why we need a new welfare state. Oxford: Oxford University Press: 68–95.doi:10.1093/0199256438.003.0003. Esping-Andersen, G. and Billari, F.C. (2015). Re-theorizing family demographics.
Population and Development Review 41(1): 1–31.
doi:10.1111/j.1728-4457.2015.00024.x.
Eydal, G.B. and Gíslason, I.V. (2008). Paid parental leave in Iceland – history and context. In: Eydal, G.B. and Gíslason, I.V. (eds.).Equal rights to earn and care: Parental leave in Iceland. Reykjavík: Félagsvísindastofnun Íslands: 45–63. Eydal, G.B. (2008). Policies promoting care from both parents – the case of Iceland. In:
Eydal, G.B. and Gíslason, I.V. (eds.). Equal rights to earn and care: Parental leave in Iceland. Reykjavík: Félagsvísindastofnun Íslands: 111–148.
Frejka, T. and Sobotka, T. (2008). Overview chapter 1: Fertility in Europe: Diverse,
delayed, and below replacement. Demographic Research 19(3): 15–46.
doi:10.4054/DemRes.2008.19.3.
Garðarsdóttir, Ó. (2008). Fertility trends in Iceland in a Nordic comparative perspective. In: Eydal, G.B. and Gíslason, I.V. (eds.).Equal rights to earn and care: Parental leave in Iceland. Reykjavík: Félagsvísindastofnun Íslands: 15– 44.
Goldscheider, F., Bernhardt, E., and Lappegård, T. (2015). The Gender Revolution: A framework for understanding changing family and demographic behaviour.
Population and Development Review 41(2): 207–239.
doi:10.1111/j.1728-4457.2015.00045.x.
Goldstein, J.R., Sobotka, T., and Jasilioniene, A. (2009). Tempo effects, postponement transitions, and the duration of lowest-low fertility.Population and Development Review 35(4): 663–699.doi:10.1111/j.1728-4457.2009.00304.x.
Gustafsson, S. (2005). Having kids later: Economic analysis for industrialized
countries. Review of Economics of the Household 3(1): 5–16.
doi:10.1007/s11150-004-0977-x.
Hank, K. and Kohler, H.-P. (2000). Gender preferences for children in Europe: Empirical results from 17 FFS countries.Demographic Research 2(1): 255–267.
doi:10.4054/demres.2000.2.1.
Hausmann, R., Tyson, L.D., and Zahidi, S. (2006–2013). The Global Gender Gap Report (respective year). Geneva: World Economic Forum.
Hausmann, R., Tyson, L.D., Bekhouche, Y., and Zahidi, S. (2014). The Global Gender Gap Report 2014. Geneva: World Economic Forum.
Hoem, B. (2000). Entry into motherhood in Sweden: The influence of economic factors on the rise and fall in fertility, 1986–1997. Demographic Research 2(4).
doi:10.4054/DemRes.2000.2.4.
Hoem, B. and Hoem, J.M. (1996). Sweden’s family policies and roller-coaster fertility.
Jinko Mondai Kenkyu (Journal of Population Problems) 52(3–4): 1–22.
Hoem, J.M. (1993a). Public policy as fuel of fertility: Effects of a policy reform on the pace of childbearing in Sweden in the 1980s. Acta Sociologica 36(1): 19–31.
doi:10.1177/000169939303600102.
Stockholm University, Department of Sociology (Stockholm Research Reports in Demography 75).
Jónsson, A.K. (2016). Fertility at the dawn of a new millennium: The interplay of family policy, economic crisis, and childbearing in Iceland. Stockholm: Stockholm University, Department of Sociology (Stockholm Research Reports in Demography 2016: 22).
Korpi, W. and Palme, J. (1998). The paradox of redistribution and strategies of equality: Welfare states institutions, inequality, and poverty in the Western countries.American Sociological Review 63(5): 661–687.doi:10.2307/2657333. McDonald, P. (2000). Gender equity, social institutions, and the future of fertility.
Journal of Population Research 17(1): 1–16.doi:10.1007/BF03029445.
McDonald, P. (2013). Social foundations for explaining low fertility: Gender equity.
Demographic Research28(34): 981–994.doi:10.4054/DemRes.2013.28.34. Ní Bhrolcháin, M. (1987). Period parity progression ratios and birth intervals in
England and Wales, 1941–1971: A synthetic life table analysis. Populations Studies 41(1): 103–125.doi:10.1080/0032472031000142556.
Ní Bhrolcháin, M. (1992). Period paramount? A critique of the cohort approach to
fertility. Population and Development Review 18(4): 599–629.
doi:10.2307/1973757.
Nordic Statistics (2016). The statistical database of the Nordic Council [electronic resource]. Copenhagen: The Nordic Council. http://91.208.143.100/pxweb/norden/pxweb/en/Nordic%20Statistics/
OECD (2016a). Social Expenditure Database (SOCX) [electronic resource]. Paris: Organisation for Economic Co-operation and Development. http://www.oecd.org/els/soc/expenditure.htm
OECD (2016b). OECD. Stat [electronic resource]. Paris: Organisation for Economic Co-operation and Development. https://stats.oecd.org/Index.aspx?DataSetCode= SOCX_AGG
Ólafsson, S. (1993). Þróun velferðarríkisins. In: Hálfdánarson, G. and Kristjánsson, S.
(eds.). Íslensk Þjóðfélagsþróun, 1880–1990 Ritgerðir. Reykjavík:
Félagsvísindastofnun Íslands: 399–430.
Rønsen, M. and Skrede, K. (2008). Fertility trends and differentials in the Nordic countries – footprints of welfare policies and challenges on the road ahead.
Vienna Yearbook of Population Research 6(1): 103–123.
doi:10.1553/populationyearbook2008s103.
Saarela, J. and Finnäs, F. (2014). Sex composition of children, parental separation, and
parity progression. Demographic Research 30(2): 49–70.
doi:10.4054/DemRes.2014.30.2.
Schoen, R. (2004). Timing effects and the interpretation of period fertility.Demography
41(4): 801–819.doi:10.1353/dem.2004.0036.
Sobotka, T. and Lutz, W. (2010). Misleading policy messages derived from the period TFR: Should we stop using it?Comparative Population Studies 35(3): 637–664. Statistical Series (2005a). Health, social affairs, justice. Reykjavík: Statistics Iceland. Statistical Series (2005b). Population. Reykjavík: Statistics Iceland.
Statistical Series (2014). Population. Reykjavík: Statistics Iceland.
Statistics Denmark (2016). StatBank Denmark [electronic resource]. Copenhagen: Statistics Denmark. http://www.statbank.dk
Statistics Finland (2016). Statistics Finland [electronic resource]. Helsinki: Statistics Finland. http://tilastokeskus.fi
Statistics Iceland (2016). Statistics Iceland databank [electronic resource]. Reykjavík: Statistics Iceland. https://hagstofa.is
Statistics Norway (2016). Statistisk sentralbyå [electronic resource]. Oslo: Statistics Norway. https://www.ssb.no
Statistics Sweden (2016). Statistics Sweden [electronic resource]. Stockholm: Statistics Sweden. http://www.scb.se
Vikat, A. (2002). Fertility in Finland in the 1980s and 1990s: Analysis of fertility trend by age and parity.Yearbook of Population Research in Finland 38: 159–178. Vikat, A. (2004). Women’s labor force attachment and childbearing in Finland.
Appendix
Background statistics
Table A-1: Background statistics: Distribution of live births and exposure times under risk by variables and parity
Variable First births Variable
First-birth model
Age Live births
Woman-months count
% Calendar year Live births Woman-months count
%
15 100 685,163 8.5 1982 1,631 214,935 2.7 16 449 754,679 9.4 1983 1,530 217,729 2.7 17 1,170 743,233 9.2 1984 1,419 220,256 2.7 18 2,100 719,152 8.9 1985 1,330 223,822 2.8 19 2,825 681,899 8.5 1986 1,320 225,177 2.8 20 3,521 628,016 7.8 1987 1,310 229,349 2.8 21 3,810 561,551 7.0 1988 1,462 233,842 2.9 22 3,773 494,818 6.1 1989 1,411 236,095 2.9 23 3,741 429,704 5.3 1990 1,484 237,707 2.9 24 3,563 366,526 4.5 1991 1,402 240,140 3.0 25 3,387 307,652 3.8 1992 1,422 242,159 3.0 26 2,996 255,421 3.2 1993 1,387 243,470 3.0 27 2,541 210,917 2.6 1994 1,407 247,164 3.1 28 2,124 173,545 2.2 1995 1,388 250,725 3.1 29 1,563 143,663 1.8 1996 1,328 252,412 3.1 30 1,278 119,624 1.5 1997 1,383 253,941 3.1 31 969 100,246 1.2 1998 1,378 255,764 3.2 32 774 86,246 1.1 1999 1,317 257,508 3.2 33 588 74,531 0.9 2000 1,444 257,779 3.2 34 443 65,612 0.8 2001 1,361 257,055 3.2 35 352 58,715 0.7 2002 1,230 256,979 3.2 36 293 52,975 0.7 2003 1,291 258,988 3.2 37 193 48,405 0.6 2004 1,249 261,842 3.2 38 161 45,043 0.6 2005 1,265 266,770 3.3 39 144 42,276 0.5 2006 1,307 271,007 3.4 40 82 40,550 0.5 2007 1,284 273,480 3.4 41 69 38,661 0.5 2008 1,305 277,411 3.4 42 37 36,465 0.5 2009 1,298 279,874 3.5 43 19 34,698 0.4 2010 1,268 280,709 3.5 44 12 33,157 0.4 2011 1,130 281,445 3.5 45 19 31,646 0.4 2012 1,206 283,997 3.5 2013 1,149 275,258 3.4
Table A-1: (Continued)
Variables Second and third births
Second-birth model Third-birth model++
Age groups Live births Woman-months count
% Live births Woman-months
count
%
<=18/<=20* 126 50,592 1.6 40 12,918 0.3 19–21/21–23* 2,035 299,977 9.3 589 113,636 2.9 22–24/24–26* 6,300 574,791 17.9 2,321 333,943 8.4 25–26 5,898 443,073 13.8 2,892 358,891 9.1 27–28 6,506 413,365 12.9 3,699 429,449 10.8 29–30 5,690 337,240 10.5 4,033 451,494 11.4 31–32 4,162 253,112 7.9 3,628 429,960 10.9 33–34 2,647 191,357 6.0 2,748 389,715 9.8 35–36 1,516 152,770 4.8 1,522 359,554 9.1 37–38 915 130,009 4.0 794 338,893 8.6 39–40 434 117,511 3.7 275 315,673 8.0 41–45 278 251,114 7.8 119 427,422 10.8
Duration from birth
1–12 months 192 506,763 15.8 140 437,638 11.0 13–24 months 4,799 478,846 14.9 2,946 418,946 10.6 25–36 months 6,957 401,281 12.5 3,212 377,130 9.5 37–48 months 6,256 318,426 9.9 2,972 338,285 8.5 49–60 months 4,793 248,304 7.7 2,899 299,234 7.6 61–72 months 3,688 196,077 6.1 2,590 263,179 6.6 73–96 months 4,754 278,617 8.7 3,796 434,189 11.0 97–120 months 2,315 193,021 6.0 2,074 349,176 8.8 +120 months 2,753 593,576 18.5 2,031 1,043,771 26.3
Sex composition
Boy and girl 10,990 2,040,536 51.5
Two boys 6,215 1,007,939 25.5
Two girls 5,430 911,013 23.0
Calendar year
Table A-1: (Continued)
Variables Second and third births
Second-birth model Third-birth model++
Calendar year Live births Woman-months count
% Live births Woman-months
count
%
1994 1,168 105,253 3.3 792 129,550 3.3 1995 1,051 105,388 3.3 800 127,517 3.2 1996 1,199 104,709 3.3 724 125,919 3.2 1997 1,081 102,986 3.2 643 125,287 3.2 1998 1,150 102,703 3.2 634 125,087 3.2 1999 1,097 101,731 3.2 638 125,029 3.2 2000 1,097 101,682 3.2 617 124,696 3.1 2001 1,078 102,197 3.2 596 123,805 3.1 2002 1,100 100,700 3.1 537 123,277 3.1 2003 1,0,90 98,448 3.1 568 123,015 3.1 2004 1,165 96,869 3.0 606 122,995 3.1 2005 1,132 94,469 2.9 605 122,497 3.1 2006 1,113 92,904 2.9 596 121,828 3.1 2007 1,100 91,424 2.8 605 121,285 3.1 2008 1,126 89,356 2.8 662 120,579 3.0 2009 1,138 88,063 2.7 682 118,593 3.0 2010 1,104 86,150 2.7 732 115,908 2.9 2011 1,015 84,711 2.6 648 112,376 2.8 2012 998 82,404 2.6 625 109,852 2.8 2013 933 81,497 2.5 563 107,217 2.7
Second births, no. of subjects: 51,103 No. of woman-months: 3,214,911 No. of live births: 36,507
Third births, no. of subjects: 45,824 No. of woman-months: 3,961,548 No. of live births: 22,660
Variables Fourth and fifth births
Fourth-birth model Fifth-birth model
Age groups Live births Woman-months count
% Live births Woman-months
count
%
19–21 5 1,388 0.0 – – –
22–24 92 19,317 0.6 7 1,358 0.1
Table A-1: (Continued)
Variables Fourth and fifth births
Fourth-birth model Fifth-birth model
Duration from birth
Live births Woman-months count
% Live births Woman-months
count
%
1–12 months 89 274,744 9.2 28 91,200 9.4 13–24 months 1,214 267,906 8.9 357 89,866 9.2 25–36 months 1,190 252,319 8.4 302 86,120 8.9 37–48 months 933 237,933 7.9 220 82,779 8.5 49–60 months 791 223,484 7.5 182 79,245 8.2 61–72 months 704 210,736 7.0 149 75,839 7.8 73–96 months 1,058 385,907 12.9 225 138,839 14.3 97–120 months 627 337,884 11.3 126 116,923 12.0 +120 months 674 805,880 26.9 134 211,233 21.7
Calendar year
Table A-1: (Continued)
Variables Fourth and fifth births
Fourth-birth model Fifth-birth model
Calendar year Live births Woman-months count
% Live births Woman-months
count
%
2011 150 77,923 26.0 27 19,187 2.0 2012 151 76,543 2.5 34 18,451 1.9 2013 142 75,711 2.5 26 17,740 1.8
Fourth births, no. of subjects: 9,216 No. of live births: 7,302
No. of woman-months: 3,003,142
Fifth births, no. of subjects: 9,605 No. of live births: 1,723
No. of woman-months: 972,044
Source:Icelandic register data, author’s calculations.
Notes: * Third-birth age grouping. ++There are marginal differences between the analyses of third-birth and gender preferences due to 31 missing values in the variable ‘Sex composition’ (first or second).
Results from models presented in paper
Table A-2: Results from main effects models
Relative risk of giving birth to a first child by calendar year standardized for age of mother. Rates relative to 1986
Relative risk of giving birth to a first child by calendar year standardized for age of mother. Rates relative to 1986. Ages 15–26
Calendar year Haz. ratio P>z Calendar year Haz. ratio P>z
Table A-2: (Continued)
Relative risk of giving birth to a first child by calendar year standardized for age of mother. Rates relative to 1986
Relative risk of giving birth to a first child by calendar year standardized for age of mother. Rates relative to 1986. Ages 15–26
Calendar year Haz. ratio P>z Calendar year Haz. ratio P>z
2001 1.11 0.008 2001 1.15 0.003 2002 1.00 0.903 2002 0.98 0.760 2003 1.04 0.361 2003 1.04 0.370
2004 1.00 – 2004 1.00 –
2005 1.01 0.896 2005 1.00 0.000 2006 1.03 0.489 2006 1.00 0.000 2007 1.00 0.960 2007 0.95 0.000 2008 1.00 0.903 2008 0.97 0.000 2009 0.99 0.796 2009 0.95 0.000 2010 0.96 0.268 2010 0.92 0.000 2011 0.84 0.000 2011 0.77 0.000 2012 0.87 0.001 2012 0.81 0.000 2013 0.82 0.000 2013 0.76 0.000
Age Age
15 0.03 0.000 15 0.03 0.000
16 0.11 0.000 16 0.10 0.000
17 0.28 0.000 17 0.28 0.000
18 0.52 0.000 18 0.52 0.000
19 0.74 0.000 19 0.73 0.000
20 1.00 – 20 1.00 –
21 1.22 0.000 21 1.22 0.000
22 1.37 0.000 22 1.38 0.000
23 1.58 0.000 23 1.59 0.000
24 1.77 0.000 24 1.78 0.000
25 2.01 0.000 25 2.03 0.000
26 2.15 0.000 26 2.33 0.000
Table A-2: (Continued)
Relative risk of giving birth to a first child by calendar year standardized for age of mother. Rates relative to 1986
Relative risk of giving birth to a first child by calendar year standardized for age of mother. Rates relative to 1986. Ages 15–26
Age Haz. ratio P>z Age Haz. ratio P>z
40 0.37 0.000 41 0.32 0.000 42 0.19 0.000 43 0.10 0.000 44 0.07 0.000 45 0.11 0.000
Relative risk of giving birth to a first child by calendar year standardized for age of mother. Rates relative to 1986. Ages 29–45
Relative risk of having a second child by calendar year standardized for age of mother and age of firstborn. Rates relative to 1986
Calendar year Haz. ratio P>z Calendar year Haz. ratio P>z
1982 0.78 0.038 1982 1.16 0.000 1983 0.67 0.001 1983 1.18 0.000 1984 0.70 0.003 1984 1.08 0.079 1985 0.80 0.052 1985 1.02 0.722
1986 0.64 0.000 1986 1 –
1987 0.60 0.000 1987 1.09 0.040 1988 0.82 0.063 1988 1.22 0.000 1989 0.77 0.012 1989 1.17 0.000 1990 0.82 0.053 1990 1.21 0.000 1991 0.80 0.029 1991 1.11 0.011 1992 0.89 0.227 1992 1.12 0.009 1993 0.88 0.185 1993 1.24 0.000 1994 1.02 0.845 1994 1.13 0.002 1995 1.00 0.986 1995 1.02 0.665 1996 0.92 0.389 1996 1.16 0.000 1997 0.98 0.848 1997 1.06 0.149 1998 1.04 0.667 1998 1.14 0.001 1999 0.95 0.565 1999 1.11 0.017 2000 1.08 0.390 2000 1.11 0.017 2001 1.05 0.553 2001 1.09 0.043 2002 1.03 0.768 2002 1.11 0.013 2003 1.01 0.927 2003 1.11 0.011
2004 1.00 – 2004 1.22 0.000
Table A-2: (Continued)
Relative risk of giving birth to a first child by calendar year standardized for age of mother. Rates relative to 1986. Ages 29–45
Relative risk of having a second child by calendar year standardized for age of mother and age of firstborn. Rates relative to 1986
Calendar year Haz. ratio P>z Calendar year Haz. ratio P>z
2010 1.09 0.300 2010 1.38 0.000
2011 1.05 0.579 2011 1.29 0.000
2012 1.06 0.494 2012 1.28 0.000
2013 1.04 0.621 2013 1.21 0.000
Age Age group
29 1.80 0.000 <=18 0.47 0.000
30 1.78 0.000 19–21 0.64 0.000
31 1.61 0.000 22–24 0.77 0.000
32 1.50 0.000 25–26 0.86 0.000
33 1.32 0.000 27–28 1.00 –
34 1.13 0.097 29–30 1.08 0.000
35 1.00 – 31–32 1.10 0.000
36 0.92 0.324 33–34 0.99 0.691
37 0.67 0.000 35–36 0.76 0.000
38 0.60 0.000 37–38 0.58 0.000
39 0.57 0.000 39–40 0.32 0.000
40 0.34 0.000 41–45 0.11 0.000
41 0.30 0.000 Duration from last birth
42 0.17 0.000 1–12 months 0.04 0.000 43 0.09 0.000 13–24 months 1.00 – 44 0.06 0.000 25–36 months 1.69 0.000 45 0.10 0.000 37–48 months 1.89 0.000 49–60 months 1.83 0.000 61–72 months 1.76 0.000 73–96 months 1.58 0.000 97–120 months 1.14 0.000 121 months or more 0.73 0.000
Relative risk of having a third child by calendar year standardized for age of mother and age of secondborn. Rates relative to 1986
Relative risk of having a second, third, fourth, and fifth child by calendar year standardized for age of mother and age of youngest born. Rates relative to second-birth rates in 1986
Calendar year Haz. ratio P>z Calendar year Haz. ratio P>z
1982 1.13 0.018 1982 1.14 0.000
1983 1.17 0.003 1983 1.16 0.000
1984 1.10 0.061 1984 1.08 0.012
1985 0.98 0.706 1985 0.99 0.833
1986 1.00 – 1986 1.00 –
Table A-2: (Continued)
Relative risk of having a third child by calendar year standardized for age of mother and age of secondborn. Rates relative to 1986
Relative risk of having a second, third, fourth, and fifth child by calendar year standardized for age of mother and age of youngest born. Rates relative to second-birth rates in 1986
Calendar year Haz. ratio P>z Calendar year Haz. ratio P>z
1988 1.29 0.000 1988 1.24 0.000
1989 1.29 0.000 1989 1.21 0.000
1990 1.41 0.000 1990 1.29 0.000
1991 1.33 0.000 1991 1.21 0.000
1992 1.30 0.000 1992 1.21 0.000
1993 1.33 0.000 1993 1.28 0.000
1994 1.30 0.000 1994 1.19 0.000
1995 1.33 0.000 1995 1.13 0.000
1996 1.25 0.000 1996 1.19 0.000
1997 1.13 0.025 1997 1.09 0.005
1998 1.12 0.034 1998 1.12 0.000
1999 1.15 0.011 1999 1.10 0.002
2000 1.13 0.028 2000 1.10 0.002
2001 1.11 0.061 2001 1.09 0.009
2002 1.02 0.787 2002 1.07 0.027
2003 1.08 0.153 2003 1.08 0.012
2004 1.17 0.004 2004 1.18 0.000
2005 1.19 0.002 2005 1.19 0.000
2006 1.19 0.002 2006 1.19 0.000
2007 1.23 0.000 2007 1.23 0.000
2008 1.37 0.000 2008 1.32 0.000
2009 1.44 0.000 2009 1.38 0.000
2010 1.60 0.000 2010 1.44 0.000
2011 1.45 0.000 2011 1.31 0.000
2012 1.41 0.000 2012 1.29 0.000
2013 1.30 0.000 2013 1.21 0.000
Relative risk of having a third child by calendar year standardized for age of mother and age of secondborn. Rates relative to 1986
Relative risk of having a second, third, fourth, and fifth child by calendar year standardized for age of mother and age of youngest born. Rates relative to second-birth rates in 1986
Age group Haz. ratio P>z Age group Haz. ratio P>z
<=20 1.12 0.485 <=18 0.44 0.000 21–23 1.07 0.121 19–21 0.66 0.000 24–26 1.01 0.597 22–24 0.81 0.000
27–28 1.00 – 25–26 0.89 0.000
29–30 0.97 0.212 27–28 1.00 –
Table A-2: (Continued)
Relative risk of having a third child by calendar year standardized for age of mother and age of second–born. Rates relative to 1986
Relative risk of having a second, third, fourth, and fifth child by calendar year standardized for age of mother and age of youngest born. Rates relative to second-birth rates in 1986
Age group Haz. ratio P>z Age group Haz. ratio P>z
33–34 0.85 0.000 31–32 0.99 0.716 35–36 0.71 0.000 33–34 0.88 0.000 37–38 0.44 0.000 35–36 0.71 0.000 39–40 0.25 0.000 37–38 0.47 0.000 41–42 0.10 0.000 39–40 0.27 0.000 43–45 0.03 0.000 41–45 0.08 0.000
Duration from last birth Duration from last birth
1–12 months 0.04 0.000 1–12 months 0.05 0.000 13–24 months 1.00 – 13–24 months 1.00 – 25–36 months 1.26 0.000 25–36 months 1.44 0.000 37–48 months 1.35 0.000 37–48 months 1.54 0.000 49–60 months 1.57 0.000 49–60 months 1.58 0.000 61–72 months 1.71 0.000 61–72 months 1.60 0.000 73–96 months 1.71 0.000 73–96 months 1.53 0.000 97–120 months 1.43 0.000 97–120 months 1.21 0.000 121 months or more 1.00 0.887 121 months or more 0.83 0.000
Sex composition* Birth order
Boy and girl 1.00 – Second 1.00 – Two boys 1.14 0.000 Third 0.57 0.000 Two girls 1.10 0.000 Fourth 0.32 0.000 Fifth 0.29 0.000
Source: Icelandic register data, author’s calculations.