Open Access
Research article
Left hemispheric dominance during auditory processing in a noisy
environment
Hidehiko Okamoto
1,2,3, Henning Stracke
1, Bernhard Ross
2, Ryusuke Kakigi
3and Christo Pantev*
1,2Address: 1Institute for Biomagnetism and Biosignalanalysis, University of Muenster, Muenster, Germany, 2Rotman Research Institute at Baycrest
Centre, University of Toronto, Ontario, Canada and 3Department of Integrative Physiology, National Institute for Physiological Sciences, Okazaki,
Japan
Email: Hidehiko Okamoto - [email protected]; Henning Stracke - [email protected]; Bernhard Ross - [email protected]; Ryusuke Kakigi - [email protected]; Christo Pantev* - [email protected]
* Corresponding author
Abstract
Background: In daily life, we are exposed to different sound inputs simultaneously. During neural encoding in the auditory pathway, neural activities elicited by these different sounds interact with each other. In the present study, we investigated neural interactions elicited by masker and amplitude-modulated test stimulus in primary and non-primary human auditory cortex during ipsi-lateral and contra-ipsi-lateral masking by means of magnetoencephalography (MEG).
Results: We observed significant decrements of auditory evoked responses and a significant inter-hemispheric difference for the N1m response during both ipsi- and contra-lateral masking. Conclusion: The decrements of auditory evoked neural activities during simultaneous masking can be explained by neural interactions evoked by masker and test stimulus in peripheral and central auditory systems. The inter-hemispheric differences of N1m decrements during ipsi- and contra-lateral masking reflect a basic hemispheric specialization contributing to the processing of complex auditory stimuli such as speech signals in noisy environments.
Background
In most day to day situations, we are exposed to many dif-ferent sound inputs simultaneously. During encoding and perception, these concurring sound inputs interact with each other. A well known phenomenon in this regard is the elevation of the hearing threshold for a test sound in presence of a competing sound. This phenomenon, called 'simultaneous masking' [1], can be divided into two cate-gories depending on whether test signal and competing sound are presented to the same ear ('ipsi-lateral mask-ing') or to different ears ('contra-lateral maskmask-ing'). In humans, simultaneous masking has been investigated in
a series of psychoacoustical experiments [2]. However, the underlying neurophysiological mechanisms remain unclear.
In the case of ipsi-lateral masking, interactions already take place at the cochlear level, thus this type of masking is often referred to as 'peripheral masking' [3]. The traveling wave induced by a test signal overlaps with the deflection pattern produced by the masker on the basilar membrane. Thus, the simultaneously presented masker distorts the auditory nerve discharges elicited by the test signal. A magnetoencephalography (MEG) study [4]
Published: 15 November 2007
BMC Biology 2007, 5:52 doi:10.1186/1741-7007-5-52
Received: 7 June 2007 Accepted: 15 November 2007
This article is available from: http://www.biomedcentral.com/1741-7007/5/52
© 2007 Okamoto et al; licensee BioMed Central Ltd.
BMC Biology 2007, 5:52 http://www.biomedcentral.com/1741-7007/5/52
investigated the auditory evoked responses elicited by the test tone presented together with continuous band-elimi-nated noises characterized by different elimiband-elimi-nated fre-quency sections centered around test tone frefre-quency during ipsi-lateral masking. Band-eliminated noises with relatively narrow eliminated bands caused smaller N1m (the most prominent negative deflection of the slow audi-tory evoked field) responses as compared to band-elimi-nated noises with wider elimiband-elimi-nated bands; the N1m response was interpreted as reflection of the ipsi-lateral masking effect.
During contra-lateral simultaneous masking, signal and masker are presented to opposite ears; therefore, interac-tions can only take place in the central auditory pathway. Thus, this type of masking is referred to as 'central mask-ing' [3]. The threshold shift produced by contra-lateral masking is much smaller compared to ipsi-lateral mask-ing. A maximal shift was observed when a tonal masker similar in frequency to the test tone was presented to the contra-lateral ear [5]. An electroencephalographic experi-ment [6] showed that the auditory steady state response (ASSR), which is considered to have a primary auditory cortex origin [7,8], became smaller when contra-laterally presented continuous maskers became louder. These results indicated that contra-lateral masking effects can be observed also in primary auditory cortex. However, an MEG study [9] showed that contra-laterally presented continuous noise did not cause a significant N1m decre-ment in response to the test tone. Both studies adopted similar broadband noises as maskers, but test stimuli dif-fered. In the former study, 0.1 ms square pulses at a rate of 39 Hz were presented, whereas the latter study used a 500 Hz square wave tone. Hence, the different contra-lateral masking effects observed between studies might have been caused by the different generators of ASSR (in the primary auditory cortex; [7,10,11]) and the N1m (in lat-eral aspects of Heschl's gyrus and the posterior temporal plane; [7,12]) as well as by the different spectral and tem-poral features of the test stimuli.
Both spectral and temporal features of test stimuli and maskers might play an important role for simultaneous masking effects. In a psychoacoustical experiment, Fletcher [13] presented a test pure tone stimulus simulta-neously with a narrow-band noise characterized by a pass-band centered at the pure tone frequency. The hearing threshold for the test tone increased until the pass-band of the narrow-band noise reached a certain bandwidth (the 'critical band'): beyond that bandwidth, the hearing threshold remained constant. Fletcher concluded that only those parts of the noise close in spectral content to the test tone frequency could have contributed to the ele-vation of the hearing threshold irrespective of temporal sound features. However, temporal features of sound
sig-nals might also influence the simultaneous masking effect [14].
Recent neuroimaging techniques revealed functional hemispheric asymmetries of spectral and temporal neural processing. A left hemispheric dominance for temporal processing and a right hemispheric dominance for spec-tral processing were observed by means of positron emis-sion tomography (PET; [15]) and functional magnetic resonance imaging (fMRI; [16]). In psychoacoustical experiments [2,14], it has been shown that both temporal and spectral processing are important for the encoding of the test stimulus during simultaneous masking. Thus, according to the results of PET and fMRI [15,16], simulta-neous masking effects might differ between left and the right hemispheres. However, the exact underlying neural mechanisms and the hemispheric differences related to simultaneous masking remain elusive.
The goals of the present study were: (1) to investigate interactions between auditory neurons characterized by similar or different receptive fields during both ipsi- and contra-lateral masking, and (2) to investigate the hemi-spheric differences in neural activities in human auditory cortex during both ipsi- and contra-lateral masking by means of MEG. The results of this study were expected to yield new information about underlying neural mecha-nisms and hemispheric differences for the processing of complex sound stimuli during simultaneous masking.
Results
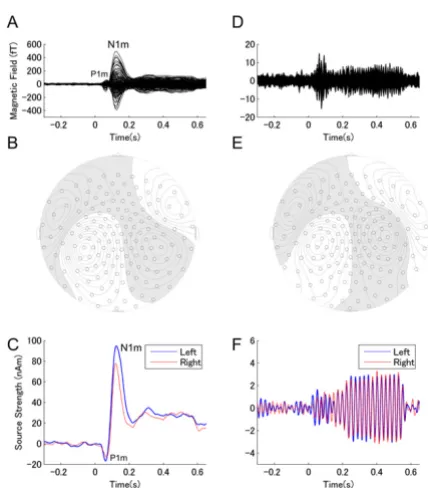
An example of individual magnetic field waveforms (30 Hz low-pass filtered) for the no masking condition (Fig-ure 1A) demonstrates the N1m response peaking approx-imately 100 ms after the onset of the test stimulus (TS) as most pronounced component of the auditory evoked fields. P1m waves (preceding the N1m) were also visible, but small and variable across subjects. Thus, in the present study, we focused on the N1m response. The source wave-forms also exhibited the P1m-N1m response complex to the onset of the TS (Figure 1C). An example of individual magnetic field waveforms (same subject) for the ASSR (band-pass filtered between 30 to 50 Hz) for the no mask-ing condition is displayed in Figure 1D. The signals exhibit the transient evoked gamma-band response and the development of the ASSR after TS onset (Figure 1D,F). The waveforms show clear polarity reversal. Even though the field amplitudes were smaller compared to the N1m, the iso-contour plots of the magnetic field distribution demonstrates a pattern typically resulting from dipolar sources (Figure 1B,E).
source locations (Figure 2) in y-z-plane (medial-lateral and inferior-superior directions) and y-x-plane (medial-lateral and posterior-anterior directions) demonstrated a significant separation between N1m and ASSR sources in the medial-lateral (y) direction (left hemisphere: t(9) = 4.01, p < 0.01, right hemisphere: t(9) = 2.96, p = 0.016). In both hemispheres, ASSR sources were located signifi-cantly more medial than N1m sources, and both ASSR and N1m sources were located more anterior in the right hemisphere (N1m: t(9) = 2.39, p = 0.041, ASSR: t(9) = 2.19, p = 0.056).
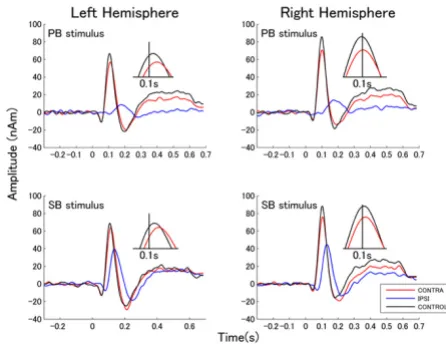
The grand averaged source strength waveforms elicited by TS presented to left and right ears for each masking condi-tion across all subjects are shown in Figures 3 and 4, respectively. The figures exhibit the P1m-N1m response complexes to the onset of the TS for the contra-lateral and
the control condition. In case of ipsi-lateral masking, N1m responses were small and delayed.
Ipsi-lateral masking
The means of the normalized N1m and ASSR source strength decrements obtained in the ipsi-lateral condition are displayed in Figure 5 with lower and upper 95% con-fidence limits. A repeated measures analysis of variance (ANOVA) applied to normalized N1m source strength decrements during ipsi-lateral masking resulted in signifi-cant main effects for TS-TYPE (F (1, 9) = 179, p < 0.0001) and HEMISPHERE (F (1, 9) = 12.3, p < 0.01), as well as a significant interaction between TS-TYPE and HEMI-SPHERE (F (1, 9) = 6.6, p = 0.030). The stimulation side had no effect on these significant differences. These find-ings indicate that larger normalized N1m decrements were obtained for the pass-band stimulus (PB) compared to the stop-band stimulus (SB), and for the right hemi-sphere compared to the left. This result means that the ipsi-lateral masking effect on the N1m was more effective when stimulus and masker shared spectral content, and less effective when stimulus and masker were different in spectrum. In addition, the ipsi-lateral masking effect on N1m was stronger in the right hemisphere, and this hem-ispheric difference was independent of stimulation side. The significant interaction between TS-TYPE and
HEMI-Source locations
Figure 2
Source locations. Grand averaged localization of N1m sources (square filled symbols) and ASSR sources (open cir-cles) in the y-x plane (medial-lateral direction vs posterior-anterior direction, upper graph) and y-z plane (medial-lateral direction vs inferior-superior direction, lower graph). The solid line starting at each dipole location represents the mean orientation of the equivalent current dipole. The ellipses around ASSR dipole locations denote the 95% confidence intervals for the distance between ASSR and N1m sources.
Representative single subject results
Figure 1
BMC Biology 2007, 5:52 http://www.biomedcentral.com/1741-7007/5/52
SPHERE shows that this hemispheric difference was mainly caused by SB.
A repeated measures ANOVA applied to normalized ASSR source strength decrements during ipsi-lateral masking resulted in a significant main effect for TS-TYPE (F (1, 9) = 14.3, p < 0.01) and STIMULATION-SIDE (F (1, 9) = 11.3, p < 0.01); however, neither a significant main effect for HEMISPHERE nor an interaction was found. These findings indicate that similar N1m and ASSR decrement patterns were obtained for TS-TYPE. However, contrary to the N1m decrement pattern, ASSR decrements did not show a significant hemispheric difference, but a signifi-cant difference for STIMULATION-SIDE. This result means that the ipsi-lateral masking effect on the ASSR was stronger when stimulus and masker were presented to the left ear, and this stimulation-side difference was not hem-isphere specific.
Contra-lateral masking
The means of the normalized N1m and ASSR source strength decrements across subjects for the contra-lateral masking condition are presented in Figure 6. A repeated measures ANOVA applied to the normalized N1m source
strength decrements during contra-lateral masking resulted in significant main effects for TS-TYPE (F (1, 9) = 7.8, p = 0.021) and HEMISPHERE (F (1, 9) = 6.0, p = 0.036), as well as a significant interaction between TS-TYPE and HEMISPHERE (F (1, 9) = 8.0, p = 0.020). These findings indicated that the N1m decrement pattern observed during contra-lateral masking was identical to the N1m decrement pattern observed during ipsi-lateral masking, even though the masking effects during contra-lateral masking were far smaller than during ipsi-contra-lateral masking. Contra-lateral masking effects were larger for the test sound of similar frequency and for the right hemi-sphere. This hemispheric difference was independent of stimulation side.
The normalized ASSR decrement during contra-lateral masking was significantly different from zero (no mask-ing effect) in all conditions (Figure 6). This means that the ASSR was significantly smaller during contra-lateral mask-ing compared to the control condition, even though the contra-lateral masking effect was far smaller compared to ipsi-lateral masking. A repeated measures ANOVA applied to the ASSR ratios during contra-lateral masking revealed neither a significant main effect nor a significant interac-tion.
Threshold shift
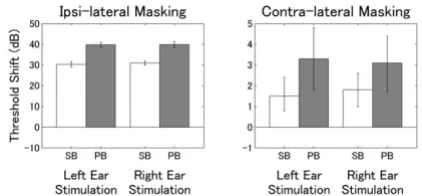
The means of the threshold shifts obtained during ipsi-and contra-lateral masking are displayed in Figure 7. A repeated measures ANOVA applied to ipsi-lateral masking resulted in a significant main effect for TS-TYPE (F (1, 9) = 127, p < 0.0001). No significant main effect for STIMU-LATION-SIDE and no significant interaction were found.
Source waveforms elicited by left ear stimulation
Figure 3
Source waveforms elicited by left ear stimulation. Grand averages of source space projection waveforms for left ear stimulation. The upper graphs show the responses to the PB. The lower graphs show the responses to SB. Left and right graphs denote the responses from left and right hemi-sphere. The responses elicited by different conditions are represented by different colored lines (see box in the right lower corner). The insets show the peaks of the N1m responses for the contra-lateral and the control condition on an enlarged time scale around a latency of 0.1 s. As the N1m responses during ipsi-lateral masking were small and delayed, they are not shown in the insets.
Source waveforms elicited by right ear stimulation
Figure 4
The ipsi-lateral masking effect was stronger for PB. A repeated measures ANOVA applied to contra-lateral masking also resulted in a significant main effect for TS-TYPE (F (1, 9) = 12.6, p < 0.01), but neither a significant effect for STIMULUS-SIDE nor an interaction were found. The contra-lateral masking effects were far smaller than the ipsi-lateral masking effects; however, masking patterns were similar.
Discussion
By using a complex stimulus design and by combining 40 Hz amplitude-modulated test stimuli of different spectral characteristics (PB and SB) with a comb-filtered noise (CFN) masker, in this study we were able to simultane-ously examine both ASSR (primary auditory cortex origin) and N1m (non-primary auditory cortex origin). The results offer new insights into auditory neural interactions and hemispheric differences during simultaneous mask-ing. These interactions depended on: (1) the frequency components of the stimuli, (2) level of the auditory sys-tem (peripheral or central), and (3) the hemisphere. There were two main findings. First, we observed that N1m and ASSR decrements during both ipsi- and contra-lateral masking depended on spectral differences between masker and test stimulus. Second, we obtained an
inter-hemispheric difference for N1m response during both ipsi- and contra-lateral masking.
Ipsi- and contra-lateral masking
In case of ipsi-lateral masking, both peripheral and central auditory pathways contribute to the masking effect. By contrast, in the case of contra-lateral masking, only neural interactions in the central auditory pathway contribute to the masking effect. Consequently, stronger masking effects should be expected for ipsi-lateral masking. Our MEG and behavioral results indeed confirm this hypothe-sis: significantly stronger masking effects on N1m and ASSR were found for ipsi-lateral compared to
contra-lat-Threshold shifts
Figure 7
Threshold shifts. Threshold shifts during ipsi- and contra-lateral masking. The left graph denotes the threshold shift during ipsi-lateral masking, the right graph denotes the shift during contra-lateral masking. The error bars represent the 95% confidence limits for the mean threshold shifts (the scale of the y-axis of the left graph is multiplied by a factor of 10 compared to the right graph).
Normalized source strength decrements for ipsi-lateral masking
Figure 5
Normalized source strength decrements for ipsi-lat-eral masking. Normalized N1m and ASSR source strength decrements for the ipsi-lateral condition (normalized decre-ment = (source strengthunmasked-source strengthipsi-lateral)/ source strengthunmasked) representing the masking effects between 0 (no masking) and 1 (complete extinction). The upper graphs denote the normalized N1m decrements and the lower graphs denote the normalized ASSR decrements for the left and the right hemisphere during left (left column) or right ear (right column) stimulation. The error bars denote the 95% confidence limits.
Normalized source strength decrements for contra-lateral masking
Figure 6
BMC Biology 2007, 5:52 http://www.biomedcentral.com/1741-7007/5/52
eral masking. During ipsi-lateral masking, displacements of the basilar membrane interact due to simultaneous presentation of TS and CFN, and such interactions along the basilar membrane are primarily responsible for N1m and ASSR decrements. However, overlapping basilar membrane displacements cannot explain the N1m and ASSR decrements observed during contra-lateral masking as masker and test sounds were presented to different ears. Therefore, we assume that these decrements were caused by neural interactions in the central auditory pathway. The significant ASSR decrements during contra-lateral masking imply that inhibitory neural interactions had already taken place in primary auditory cortex. However, it is possible that the central masking effects occurred at lower level, as anatomical studies in cat have shown that the superior olivary complex is the primary binaural inter-fering station [17].
Influence of spectral components
N1m and ASSR decrements were more pronounced for PB compared to SB during both ipsi- and contra-lateral mask-ing. In case of ipsi-lateral masking, these different decre-ments between PB and SB could be explained by the critical band concept suggested by Fletcher [13]. Those parts of the basilar membrane corresponding to the PB frequencies were already displaced by the continuous CFN overlapping in frequency content with the PB stimu-lus. This overlap resulted in smaller evoked responses elic-ited by PB compared to SB, which had less overlapping frequencies with the CFN. These findings support the results of a previous MEG study showing that N1m ampli-tude became smaller with increasing frequency overlap between masker and test tone [4].
During contra-lateral masking, binaural interactions between auditory neurons activated by left and right ear stimulations contributed to the significant N1m decre-ments. Our results showed significantly different N1m decrements between PB and SB. This result indicates that inhibitory neural interactions also depended on the fre-quency similarities between masker and test stimulus dur-ing contra-lateral maskdur-ing. In accordance with previous psychoacoustical work [5], our MEG and behavioral data showed that the strongest masking effect was observed when a similar frequency sound was presented as masker to the opposite ear.
Hemispheric differences
Normalized N1m decrements were significantly smaller in the left hemisphere during both ipsi- and contra-lateral masking. This result indicated that the left hemisphere might play a dominant role for sound processing in noisy environments. Recent neuroimaging studies [15,16] sug-gested a left hemispheric dominance for temporal and a right hemispheric dominance for spectral processing. The
left hemispheric dominance for temporal processing can be considered as important during ipsi- and contra-lateral masking because temporal processing is essential for the segregation of target sounds from non-target sounds [18]. The temporal structure of the test signals might play an important role for sound detection. In the present study, test stimuli were characterized by a modulation envelope similar to a speech signal, whereas the masker was not. Hence, temporal cues might play an important role for the perception and the segregation of the test stimuli during both ipsi- and contra-lateral masking. Temporal cues are likely dominantly processed in the left hemisphere. That would lead to larger neural activities and smaller masking effects in the left hemisphere.
The hemispheric difference in auditory neural activities might be also explained by the 'asymmetric sampling in time' concept as suggested by Poeppel [19]. The author assumed that the left human auditory cortex has shorter temporal integration windows (25–50 ms), whereas the auditory cortex of the right hemisphere needs longer time windows (200–300 ms) to extract auditory information from the signal. An fMRI study [20] supported the hypothesis by demonstrating that the activities in the higher-order superior temporal sulci of left and right hem-isphere depended on the modulation rate of the sound signals. Under natural circumstances, the quick analysis of deviant sound signals in noisy environments is essential for survival (i.e. the footfalls of predators). Therefore, the finer temporal resolution in the left hemisphere would play an important role for the monitoring and the detec-tion of deviant sound signals in noisy situadetec-tions. The results also showed that hemispheric differences during both ipsi- and contra-lateral masking were mainly caused by SB. Therefore, spectral cues seem to be helpful for the left hemisphere to separate signal from noise. This might indicate that spectral differences between signal and noise allow quick and rough segregation of sound signals in noisy environments in the left hemisphere by applying short temporal integration windows at the expense of slow and fine frequency analysis, which is dominantly accomplished in the right hemisphere. Thus, these results support the 'asymmetric sampling in time' concept by demonstrating that the masker affects the N1m response less in the left hemisphere compared to the right.
the control condition in left and right hemispheres indi-vidually. Hence, the contra-lateral N1m dominance and the right hemispheric ASSR laterality, which were obtained in the control condition, do not contribute to the hemispheric differences reported here.
N1m decrements during contra-lateral masking
We observed N1m decrements during contra-lateral masking, whereas in another MEG study [9] this effect did not reach significance. Several explanations for this appar-ent discrepancy appear conceivable: first, in the previous study [9], a shorter time interval between stimulus onsets was used (0.8–1.0 s). Our longer time interval of 2.0–3.0 s is expected to result in larger N1m source strengths, which in turn might have lead to the observed higher sen-sitivity of the N1m decrements during contra-lateral masking. Second, we used complex stimuli consisting of several frequency components (Figure 8B,C) instead of the pure tone used in the previous MEG study [9]. These comparably complex stimuli might have also contributed to the increment in N1m source strength, because com-plex sounds activate more neurons in non-primary audi-tory cortex than pure tones [23]. Third, we used a CFN composed of narrowly defined band-passed noises as masker. Compared to the broadband noise used in the previous MEG study [9], the CFN might selectively have activated neurons that correspond to the pass-band fre-quencies of the CFN. Such frequency specific neural activ-ities elicited by the contra-laterally presented CFN might have more efficiently contributed to the significant N1m decrements we have observed here. Fourth, in the present study, we used amplitude-modulated sounds character-ized by specific temporal structures causing temporal encoding corresponding to the stimulus envelopes. Tem-poral neural activities elicited by the amplitude-modu-lated sounds might have caused the significant N1m decrements observed in the present study, as Galambos and Makeig [6] showed significant contra-lateral masking effects by presenting a sound with a specific temporal fea-ture.
Right ear advantage
ASSR decrements were significantly different between ears during ipsi-lateral masking: decrements were more pro-nounced for left compared to right ear stimulation. The less pronounced ASSR decrements during ipsi-lateral masking might reflect the so-called 'right ear advantage' suggested by a previous study [24]. The author proposed that the right ear advantage was due to the amount of efferent inhibition, which is relatively small in right com-pared to left ear stimulation. Thus, the smaller number of inhibitory efferent neurons in the right ear might cause the less pronounced ASSR decrements during ipsi-lateral masking.
Conclusion
In the present study, we have observed smaller N1m dec-rements in the left hemisphere during both ipsi- and con-tra-lateral masking. This suggests left hemispheric dominance for auditory processing in noisy environ-ments. As test stimuli, we used amplitude-modulated sounds characterized by 'fine structure' and 'envelope' at the same time. These sounds are similar to speech signals, but do not carry speech information [25]. Therefore, our results may be interpreted as reflection of basic
hemi-Stimuli and experimental design
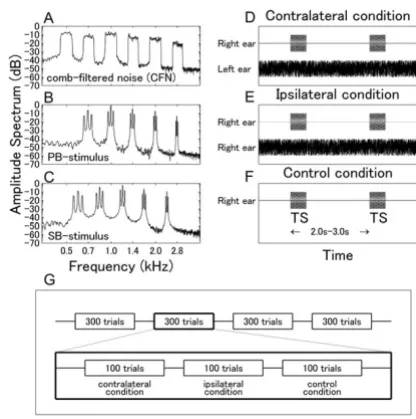
Figure 8
BMC Biology 2007, 5:52 http://www.biomedcentral.com/1741-7007/5/52
spheric specialization contributing to higher-level audi-tory analysis such as speech processing in noisy environments.
Methods
SubjectsTen subjects (two females; mean age 29 years, range 19– 37 years) with no history of otological or neurological dis-orders participated in the present study. All subjects were strongly right-handed (assessed via "Edinburgh Handed-ness Inventory" [26]). They had normal hearing thresh-olds within the frequency range of 250 and 8000 Hz as tested by means of clinical pure tone audiometry. The sub-jects consented for participation after having been informed about the nature of the study. The Research Eth-ics Board of Baycrest Centre approved all experimental procedures, which were in accordance with the Declara-tion of Helsinki.
Masker and test stimuli
To investigate neural interactions between similar and dif-ferent frequencies, we used a comb-filtered noise (CFN) derived from white noise by applying multiple band-pass filters with widths of a quarter of an octave as masker (Fig-ure 8A) and two kinds of 40 Hz amplitude-modulated complex tones as test stimuli (TS). The first TS was a pass-band stimulus (PB) composed of five spectral compo-nents corresponding to the centers of the pass-band sec-tions (0.7, 1.0, 1.4, 2.0, 2.8 kHz) of the CFN (Figure 8B). The second TS was a stop-band stimulus (SB) containing the center frequencies of the stop-band sections (0.59, 0.83, 1.19, 1.66, and 2.39 kHz) of the CFN (Figure 8C). Both TS with duration of 500 ms were 100% amplitude modulated with a 40 Hz sinusoid. To examine possible sound distortions due to the sound delivery system, we measured the amplitude spectra of the CFN and the TS at the earpiece; the results are displayed in Figure 8A–C. The simultaneous presentation of CFN and TS allowed the examination of interactions between auditory neurons activated by either similar (PB) or different frequencies (SB) in primary as well as non-primary auditory cortices [27,28].
Experimental design
Three experimental conditions were applied: contra-lat-eral masking, ipsi-latcontra-lat-eral masking, and no masking con-trol condition (Figure 8D–F). Two sessions were performed for each subject. Within each session, the TS were presented either to the left or to the right ear. The CFN masker was presented either to the contra-lateral ear (Figure 8D) or to the ipsi-lateral ear (Figure 8E) in each session. No CFN was presented in the control condition (Figure 8F). Hence, the ear of TS presentation did not dif-fer between ipsi-lateral and contra-lateral masking condi-tions within a session, but the masker presentation sides
did. The time interval between stimulus onsets was rand-omized between 2.0 and 3.0 s. A schematic illustration of the time course of a session is given in Figure 8G. Three blocks containing 100 trials for each masking condition were repeated four times in one session in randomized order. We adopted a block design to avoid masker-onset effects.
Both CFN and TS were presented at 45 dB SL (sensation level) in order to avoid interaural cross talk. The intensi-ties of stimuli and masker were individually adjusted at the beginning of each experimental session. TS were pre-pared as sound files and presented via STIM software (NeuroScan Inc., Charlotte, NC, USA) using ER30 trans-ducers (Etymotic Research, Elk Grove Village, IL, USA), plastic tubes of 2.5 m length and silicon ear pieces fitting to the subject's ears. The CFN was played from a CD player and superimposed on the TS.
Data acquisition
Auditory evoked magnetic fields were recorded with a hel-met-shaped 151-channel whole cortex neurogradiometer (OMEGA, CTF Systems, VSM MedTech Inc., Coquitlam, British Columbia, Canada) in a quiet, magnetically shielded room. The subjects were seated comfortably and watched a silent movie of their choice during the MEG measurement in order to keep them in a stable alert state. The magnetic field signals were 200 Hz low-pass filtered online and sampled at a rate of 625 Hz.
Data analysis
Epochs of magnetic field data starting 300 ms before the onset of the TS and ending 200 ms after the offset of the TS (in total: 1.0 s) were averaged after artifact rejection (threshold: 3.0 picotesla). After 30 Hz low-pass filtering and baseline correction based on the 300 ms pre-stimulus interval, spatiotemporal equivalent current dipoles (ECDs; one for each hemisphere) were estimated for the averaged magnetic field distribution of the N1m response in the control condition. A 10 ms time window prior to the maximal global field power, measured as root mean square across all sensors around 100 ms after TS onset, was used for estimation of the transient N1m source. ECD locations and orientations in each hemisphere were deter-mined in a head based Cartesian coordinate system with the origin set to the midpoint of the medial-lateral axis (y-axis) between the entrances of the left and right ear-canals: the posterior-anterior axis (x-axis) ran between nasion and the origin; the inferior-superior axis (z-axis) ran through the origin perpendicularly to the x-y-plane.
applied to the averaged magnetic field of each condition. This method combines the magnetic field waveforms obtained from each sensor weighted by the sensitivity of each sensor for a source at the specified location into a sin-gle waveform of the dipole moment. ASSR was analyzed in a similar way. The model of ECD was applied to the averaged magnetic field data (band-pass filtered between 30 and 50 Hz) within the 300 ms time interval starting 200 ms after TS onset until the end of the stimulus. N1m and ASSR source strength decrements observed in ipsi- or the contra-lateral masking conditions were normalized with respect to the source strength obtained in the control condition for each hemisphere of each subject (normal-ized decrement = (source strength unmasked-source strength masked)/source strength unmasked). Those nor-malized decrements are then interpreted as masking effects between 0 (no masking) and 1 (complete extinc-tion). In order to evaluate the normalized N1m and ASSR decrements, repeated measures analyses of variance (ANOVAs) were performed to evaluate three factors (STIMULUS-SIDE × TS-TYPE × HEMISPHERE) for ipsi-and contra-lateral masking independently. The source locations of N1m and ASSR were analyzed by paired t-test with respect to each axis in each hemisphere. P values smaller than 0.05 were accepted as significant.
Behavioral measurement
In addition, we carried out psychoacoustical measure-ments to assess the threshold shifts during ipsi- and con-tra-lateral masking. Ten right-handed subjects (four females, mean age 28 years, range 24–32 years) with no history of otological or neurological disorders partici-pated in the behavioral study. All measurements were per-formed in an acoustically shielded room. As the sound signals used for the MEG measurements were low-pass fil-tered due to the transfer characteristic of the sound deliv-ery system, we used the CFN and the TS recorded at the earpiece in the magnetically shielded room for the behav-ioral measurements in order to make behavbehav-ioral measure-ment and MEG measuremeasure-ment comparable. Thus, the sound signals used for MEG and behavioral measure-ments had identical amplitude spectra (Figure 8A–C). The TS were prepared as sound files and presented via audi-ometer (AA-71, Rion Co. Ltd., Tokyo, Japan) by means of headphones. The CFN was played from a CD player and superimposed on the TS under control of the audiometer. We first measured the threshold for the CFN for each ear (left or right, in random order) individually and then we measured the thresholds for PB and SB for ipsi-lateral, contra-lateral and control conditions (order randomized between subjects). Sensitivity evaluations were made in 1 dB steps. The CFN was presented at the intensity level of 45 dB SL during ipsi-lateral and contra-lateral masking. To evaluate threshold shifts, repeated measures ANOVAs
were calculated using two factors (STIMULUS-SIDE × TS-TYPE) for ipsi-lateral and contra-lateral masking.
Authors' contributions
HO conceived of the study, HO and CP designed the experimental setup. HO acquired the data and drafted the manuscript. All authors participated the data evaluation and interpretation and approved the final version of the manuscript.
Acknowledgements
This work has been supported by BMBF/DLR grant 01GW0520, Canadian Institutes of Health Research (Operating and NET), the Ontario Innovation Trust, and the Canadian Foundation for Innovation. We thank Andreas Wollbrink for technical assistance and Patrick Bermudez for reading the manuscript and helpful discussions.
References
1. Zwicker E: Temporal Effects In Simultaneous Masking And Loudness. The Journal of the Acoustical Society of America 1965,
38:132-141.
2. Zwicker E, Fastl H: Psychoacoustics: facts and models. 2nd edi-tion. Berlin; New York: Springer; 1999.
3. Wegel RL, Lane CE: The auditory masking of one pure tone by another and its probable relation to the dynamics of the inner ear. Phys Rev 1924, 23:266-285.
4. Sams M, Salmelin R: Evidence of sharp frequency tuning in the human auditory cortex. Hear Res 1994, 75(1–2):67-74. 5. Zwislocki JJ, Buining E, Glantz J: Frequency distribution of central
masking. J Acoust Soc Am 1968, 43(6):1267-1271.
6. Galambos R, Makeig S: Physiological studies of central masking in man. I: The effects of noise on the 40-Hz steady-state response. J Acoust Soc Am 1992, 92(5):2683-2690.
7. Engelien A, Schulz M, Ross B, Arolt V, Pantev C: A combined func-tional in vivo measure for primary and secondary auditory cortices. Hear Res 2000, 148(1–2):153-160.
8. Pantev C, Roberts LE, Elbert T, Ross B, Wienbruch C: Tonotopic organization of the sources of human auditory steady-state responses. Hear Res 1996, 101(1–2):62-74.
9. Hari R, Makela JP: Modification of neuromagnetic responses of the human auditory cortex by masking sounds. Exp Brain Res 1988, 71(1):87-92.
10. Makela JP, Hari R: Evidence for cortical origin of the 40 Hz audi-tory evoked response in man. Electroencephalogr Clin Neurophysiol 1987, 66(6):539-546.
11. Pantev C, Elbert T, Makeig S, Hampson S, Eulitz C, Hoke M: Rela-tionship of transient and steady-state auditory evoked fields.
Electroencephalogr Clin Neurophysiol 1993, 88(5):389-396.
12. Pantev C, Bertrand O, Eulitz C, Verkindt C, Hampson S, Schuierer G, Elbert T: Specific tonotopic organizations of different areas of the human auditory cortex revealed by simultaneous mag-netic and electric recordings. Electroencephalogr Clin Neurophysiol 1995, 94(1):26-40.
13. Fletcher H: Auditory patterns. Rev Mod Phys 1940, 12:47-65. 14. Wakefield GH, Viemeister NF: Temporal interactions between
pure tones and amplitude-modulated noise. The Journal of the Acoustical Society of America 1985, 77(4):1535-1542.
15. Zatorre RJ, Belin P: Spectral and temporal processing in human auditory cortex. Cereb Cortex 2001, 11(10):946-953.
16. Jamison HL, Watkins KE, Bishop DV, Matthews PM: Hemispheric specialization for processing auditory nonspeech stimuli.
Cerebral cortex 2006, 16(9):1266-1275.
17. Irvine DRF: Progress in sensory physiology. Berlin; New York: Springer-Verlag; 1986.
18. Barbour DL, Wang X: Temporal coherence sensitivity in audi-tory cortex. J Neurophysiol 2002, 88(5):2684-2699.
Publish with BioMed Central and every scientist can read your work free of charge "BioMed Central will be the most significant development for disseminating the results of biomedical researc h in our lifetime."
Sir Paul Nurse, Cancer Research UK
Your research papers will be:
available free of charge to the entire biomedical community
peer reviewed and published immediately upon acceptance
cited in PubMed and archived on PubMed Central
yours — you keep the copyright
Submit your manuscript here:
http://www.biomedcentral.com/info/publishing_adv.asp
BioMedcentral
BMC Biology 2007, 5:52 http://www.biomedcentral.com/1741-7007/5/52
20. Boemio A, Fromm S, Braun A, Poeppel D: Hierarchical and asym-metric temporal sensitivity in human auditory cortices. Nat Neurosci 2005, 8(3):389-395.
21. Pantev C, Lutkenhoner B, Hoke M, Lehnertz K: Comparison between simultaneously recorded auditory-evoked mag-netic fields and potentials elicited by ipsilateral, contralat-eral and binaural tone burst stimulation. Audiology 1986,
25(1):54-61.
22. Ross B, Herdman AT, Pantev C: Right hemispheric laterality of human 40 Hz auditory steady-state responses. Cereb Cortex 2005, 15(12):2029-2039.
23. Rauschecker JP: Cortical processing of complex sounds. Curr Opin Neurobiol 1998, 8(4):516-521.
24. McFadden D: A speculation about the parallel ear asym-metries and sex differences in hearing sensitivity and otoa-coustic emissions. Hear Res 1993, 68(2):143-151.
25. Joris PX, Schreiner CE, Rees A: Neural processing of amplitude-modulated sounds. Physiol Rev 2004, 84(2):541-577.
26. Oldfield RC: The assessment and analysis of handedness: the Edinburgh inventory. Neuropsychologia 1971, 9(1):97-113. 27. Okamoto H, Ross B, Kakigi R, Kubo T, Pantev C: N1m recovery
from decline after exposure to noise with strong spectral contrasts. Hear Res 2004, 196(1–2):77-86.