DEMOGRAPHIC RESEARCH
A peer-reviewed, open-access journal of population sciences
DEMOGRAPHIC RESEARCH
VOLUME 35, ARTICLE 5, PAGES 117–138
PUBLISHED 20 JULY 2016
http://www.demographic-research.org/Volumes/Vol35/5/ DOI: 10.4054/DemRes.2016.35.5
Research Article
Spatial attraction in migrants’ settlement
patterns in the city of Catania
Angelo Mazza
Antonio Punzo
c
2016 Angelo Mazza & Antonio Punzo.
1 Introduction 118
2 Methodology 120
2.1 Spatial inhomogeneity and spatial dependence 120
2.2 The inhomogeneousK-function 120
2.3 Confounding between spatial inhomogeneity and spatial attraction 121
2.4 Inferential framework 122
3 Foreign migration in the city of Catania 122
4 Migrant settlement patterns in the city of Catania 125
4.1 Estimate of spatial intensities 125
4.2 Estimate of the spatial attraction 128
5 Conclusions 132
Spatial attraction in migrants’ settlement patterns in the city of
Catania
Angelo Mazza1
Antonio Punzo2
Abstract
BACKGROUND
In broad terms, and apart from ethnic discriminatory rules enforced in some places and at some times, residential segregation may be ascribed both to economic inhomogeneities in the urban space (e.g., in the cost of rents, or in occupation opportunities) and to spatial attraction among individuals sharing the same group identity and culture.
OBJECTIVE
Traditional indices of spatial segregation do not distinguish between these two sources of clustering. Furthermore, they typically rely on census tracts, a scale that does not allow for fine-grained analysis. Also, the use of alternative zoning often leads to conflicting results. The aim of this paper is to measure spatial attraction among groups of foreign migrants in Catania (Italy) using individual household data.
METHODS
We apply a version of Ripley’sK-function specially conceived for assessing spatial at-traction while adjusting for the effects of spatial inhomogeneity. To avoid the risk of confounding the two sources of clustering, spatial inhomogeneity is estimated following a case-control approach.
RESULTS
Different parts of the city exhibit different suitabilities for migrants of different nation-alities, with groups mainly involved in housekeeping and caregiving being more spread than the ones specialized in peddling and retailing. A significant spatial attraction has been found for Sri Lankan, Mauritians, Senegalese, and Chinese. Conversely, the settle-ment patterns of Tunisians and Moroccans comply with random allocation. These results
1Department of Economics and Business, University of Catania, Corso Italia, 55, 95128 Catania, Italy.
Tel. (39) 0957537736, E-Mail: [email protected].
2Department of Economics and Business, University of Catania, Corso Italia, 55, 95128 Catania, Italy.
seem consistent with the hypothesis of a relevant correlation between chain migration and spatial attraction.
1. Introduction
Residential location influences individuals’ proximity to important resources (such as schools, hospitals, child care facilities, labor markets, and employment opportunities) and to potential risks, including environmental threats and social hazards (such as ex-posure to crime and violence) (Reardon 2006). Furthermore, it impacts access to social networks and other forms of social capital; overall, it shapes human interaction and the demographic processes that originate from it, such as mortality, fertility and mobility (Almquist and Butts 2012).
A minority ethnic group is spatially clustered when the spatial arrangement of minor-ity households departs from expectations based upon a random spatial allocation (Free-man, Pilger, and Alexander 1971).
In broad terms, and apart from ethnic discriminatory rules enforced by law or tra-ditions in some places and at some times, we may distinguish between two sources of spatial clustering. One source is spatial inhomogeneity or apparent contagion. Typically, the different parts of a city exhibit large variations in the price of residential property, in the accessibility of low cost public infrastructures, and in the availability of certain types of jobs; these inhomogeneities may lead to a mostly economically induced segregation. As Schelling (1971) observes, ethnicity is often correlated with income, and income with residence; so even if residential choices were unconstrained by ethnic discrimination, the different ethnic groups would not be randomly distributed among residences.
The second source is spatial attraction or true contagion. Survey data on the ideal neighborhood composition for different ethnic groups in the USA, reported in Clark and Fossett (2008), show that all groups prefer living in areas where their group is a majority or near-majority. These preferences have complex origins and may reflect attachment to group identity and culture (e.g., language, religion, customs, etc.). Newly arrived minor-ity migrants may benefit from positive spillovers in settling close to their compatriots, in terms of reciprocal acceptance, common language, and support. Transnational social net-works play an important role in channeling arriving migrants into specific neighborhoods and also into particular occupations (Gelderblom and Adams 2006).
members of other groups. In other words, the presence of a household in a given area increases the probability of others of the same group to locating nearby.
It is relevant in social research to be able to distinguish between these two sources of clustering. Whereas economic induced segregation might explain some initial degree of segregation and raises questions of social equity, the Schelling model highlights the importance of individually motivated segregation and posits that even mild preferences for living with similar neighbors carry the potential of being strong determinants for res-idential segregation (Clark and Fossett 2008).
The spatial distribution of households may be represented by a point pattern, i.e., a set of points in a map. Ripley’s K-function (Ripley 1981) is widely used to detect clustering in point processes. The inhomogeneousK-function is a version of Ripley’s K-function conceived for assessing the effects of spatial attraction (or inhibition), while adjusting for the effects of spatial inhomogeneity. In other words, this approach allows us to distinguish between the two sources of clustering, by assessing clustering above and beyond that due to apparent contagion.
Traditional studies of segregation rely on data aggregated by areal units, typically census tracts. However, analysis at the scale of the tract is unable to take into account geo-graphic proximity at the level of the individual household and social scientists have begun to recognize the importance of the individual level analysis (Kumar 2007; Almquist and Butts 2012; Matthews and Parker 2013; Kumar, White, and Singh 2013). Furthermore, alternative zoning or a different scale often yields different results. This “modifiable area unit problem” is a well-known issue (Openshaw 1984, Wong 2009). In contrast, theK -function provides an explicitly spatial approach and an egocentric measure of clustering that takes into account questions of proximity as well as scale.
2. Methodology
2.1 Spatial inhomogeneity and spatial dependence
The spatial distribution of households may be represented by a point pattern, i.e. a set of points in a map, where each point corresponds to the location of a single event. The use of the term “event” has become standard in spatial analysis, as a means of distinguishing the location of an observation (a household location in our case) from any other arbitrary location within the study regionR.
The homogeneous Poisson process (HPP) is the simplest theoretical model of spatial point pattern. In this model, the number of eventsN(U)in any regionU ⊆Rfollows a Poisson distribution with mean
E[N(U)] =|U|λ
proportional to the area|U|of U, whereλdenotes the intensity of the process, which is assumed to be constant overR. Furthermore, in HPPs the number of events in non-overlapping sub-regions are independent random variables, thus there are no interactions among the events.
In applications, the HPP is often used as a benchmark model; the logic is that if a point pattern is completely random, then there is nothing “interesting” happening; in other words, the HPP is used as the “null model” of a statistical analysis (Baddeley 2010). However, population and its associated socio-economic and demographic attributes vary significantly across the geographic space and the constant intensity of the HPP is not suitable for representing the spatial distribution of the human phenomena (Kumar, White, and Singh 2013).
The inhomogeneous point process (IPP) is a generalization of the HPP obtained by replacing the constant intensityλwith a spatially varying intensity functionλ(u); so, we have
E[N(U)] =
Z
U
λ(u)du.
An IPP typically exhibits more variation in the location of events than the HPP does; clustered patterns occur, with regions where intensities are higher, receiving a higher number of events.
2.2 The inhomogeneousK-function
Ripley’sK-function, usually denoted withK(d), is widely used to detect clustering (or inhibition) in point processes with constant intensity; at every spatial distanced,λK(d)
dsurrounding an arbitrary eventx. TheK-function is commonly used in testing for HPP, and its asymptotic distributions under simple point process models are known (Heinrich 1991; Ripley 1981).
Baddeley, Møller, and Waagepetersen (2000) generalized Ripley’s K-function to non-homogeneous point processes, by weighting each event xbyw = 1/λ(x). The inhomogeneousK-function is defined as
Kinhom(d) =E
" X
x∈X 1
λ(x)1(0<ku−xk ≤d)
u∈X
#
, (1)
whereku−xkis the Euclidean distance between eventsuandxand1(·)is the indicator function. Note that ifλ(u)is constant across space,Kinhom(d)reduces to the usualK(d)
function.
For estimatingKinhom, Baddeley and Turner (2000) proposed the estimator
b
Kinhom(d) =
1 |R|
X
i
X
j6=i
1(kxi−xjk ≤d)
b
λ(xi)bλ(xj)
e(xi,xj;d), (2)
wheree(xi,xj;d)is an edge correction weight (Ripley 1991, p. 22), and bλ(u) is an
estimate of the intensity functionλ(u).
2.3 Confounding between spatial inhomogeneity and spatial attraction
In real cases, clusters are most often generated by the joint action of both spatial inhomo-geneity and spatial attraction. To distinguish between these two sources of clustering is challenging, as many spatial processes are “equifinal” and hence unidentifiable (Harvey 1966), i.e., one realization of a point process may be consistent with underlying pro-cesses involving clustering due to either spatial inhomogeneity or spatial attraction, as demonstrated in Bartlett (1963).
The risk of confounding the two sources of clustering is a fundamental limitation on the scope of statistical inference from a spatial point pattern, assuming we have access to only a single realization of the underlying process (Diggle et al. 2007; Baddeley 2010; Baddeley, Rubak, and Turner 2015) .
controlsdrawn at random from the population at risk. Assuming that the size of the pop-ulation at risk tends to infinity and the sampling fraction to zero, the controls constitute a realization of an IPP with intensityλ∗(u); the cases form a second, independent, point
process – which may or may not be a Poisson process – with intensityλ(u). The ques-tion of interest is whether the cases form an IPP with intensity proporques-tional to that of the controls, i.e.,λ(u) =ρλ∗(u), or whether they exhibit additional spatial structure. Diggle et al. (2007) propose that the ratio between the intensity functions may be modeled to depend on a vector ofmspatially referenced covariatesz(u) = (z1(u),. . .,zm(u))0, i.e.
λ(u) =λ∗(u)f(z(u);θ) , (3)
wheref(·)is any nonnegative function, either nonlinear parametric with parameters θ
as in (3), or nonparametrically specified. Note that within this approach, the estimate of λ(u)depends on the case locations only through the valuesz(u)of the covariates at those locations, a feature that is critical in separating heterogeneity from clustering of the case point process (Diggle et al. 2007).
2.4 Inferential framework
Generally, onlyKbinhom(d), the estimated counterpart ofKinhom(d), is known and, to test
the usual null hypothesis of absence of spatial interaction, a proper inferential framework needs to be introduced.
Because the exact distribution of Kbinhom is unknown, to obtain the distributional
information needed, in the following we will consider Monte Carlo simulations from the null hypothesis. Roughly speaking, givennreplications of the fitted IPP, a different value, sayKb
j
inhom(d),j = 1,. . .,n, may be computed for each replication. Pointwise
confidence envelopes
L(d) =Kb
(k)
inhom(d)
U(d) =Kb
(n−k)
inhom (d)
of sizeα= 2k/(n+ 1)are obtained, whereKb
(k)
inhom(d)denotes thek-th order statistic.
Observed values ofKbinhom(d)falling, for some value ofd, outside the envelopes indicate
a significant departure from the null hypothesis at levelα.
3. Foreign migration in the city of Catania
domes-tic work, catering, peddling and low qualification services. Migrants’ work fulfilled a structural demand for cheap, flexible, and often off-the-books unprotected labor, a type of work that natives tend to avoid, even if unemployed.
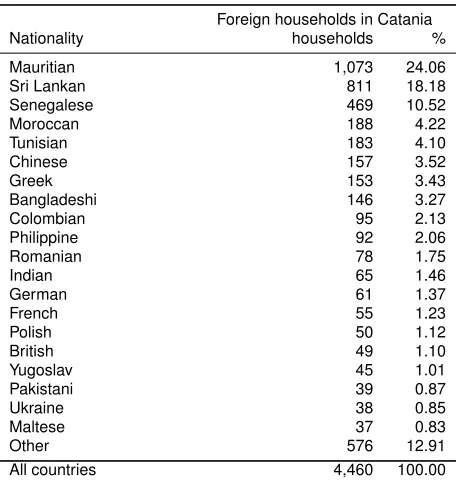
These flows originate from all continents. Table 1 reports the distribution by na-tionality of households of foreign immigrants in the city of Catania (source: Catania Population Register Office on August 30, 2005). According to the Italian laws regulat-ing cities’ population registers (art. 4 of Presidential Decree 223/1989), a household is a group of people linked by marriage, affinity, adoption, guardianship or affective bonds who live together. Single person households are allowed.
Table 1: Households of foreign immigrants in the city of Catania on August 30, 2005 (Catania Population Register)
Foreign households in Catania Nationality households %
Mauritian 1,073 24.06 Sri Lankan 811 18.18 Senegalese 469 10.52
Moroccan 188 4.22
Tunisian 183 4.10
Chinese 157 3.52
Greek 153 3.43
Bangladeshi 146 3.27
Colombian 95 2.13
Philippine 92 2.06
Romanian 78 1.75
Indian 65 1.46
German 61 1.37
French 55 1.23
Polish 50 1.12
British 49 1.10
Yugoslav 45 1.01
Pakistani 39 0.87
Ukraine 38 0.85
Maltese 37 0.83
Other 576 12.91
All countries 4,460 100.00
espe-cially males from Tunisia, Morocco, and Senegal perceive housework as “female” and degrading, and prefer to work as street vendors. They sell different types of – most of-ten fake branded – goods, such as handbags, sunglasses, jewelry, and other inexpensive seasonal objects, along streets in the central shopping district, at open-air markets, at ma-jor road intersections and, in summer, along the nearby beaches. Finally, Chinese are mostly employed in import-export business and retailing. Such specializations, given the different logistic needs related to the occupational typologies and given the different inte-gration possibilities, have favored the differentiation of the spatial distribution (Altavilla and Mazza 2012).
Figure 1: Immigrants’ households locations
Mauritian SriLankan Senegal Moroccan Tunisia Chinese 8
7
3
2 4
1 6
0 0.001 0.01
(a)
Mauritian SriLankan Senegal Moroccan Tunisia Chinese 8
7
3
2 4
1 6
1.9 2.5 3 3.5 4 4.5 5.6
(b)
Note: Foreign immigrants’ households locations for the top six nationalities in the city of Catania on August 30, 2005 (source: Catania Population Register). Ordinal numbers identify municipalities. In the background: (a) Smooth pycnophylactic interpolation (Tobler 1979) of population counts for census tracts (2001 General Population Census, http://dawinci.istat.it). (b) Minimum rent cost per square meter for private residential properties (Italian Revenue Agency - OMI database, http://www.agenziaentrate.gov.it/geopoi/omi/).
a heterogeneous urban fabric, comprises the city’s historic and political-administrative center and hosts the central business district as well as the largest outdoor market of the city, where native Italians and immigrants share the same space to sell their goods. The remaining areas, in the north portion of the 1stMunicipality, for the most part host the middle or middle-high classes; they are mainly buildings erected in the 1950s and 1960s, characterized by decent multi-level apartment blocks and by higher building densities.
4. Migrant settlement patterns in the city of Catania
In this section we estimate the intensity functionsλi(u), withi = 1,. . .,p, related to immigrants of thep = 6 most numerous nationalities. Then, the inhomogeneousK -function is used to describe and compare their settlement patterns.
Data at hand come from the office of the Catania population register, as recorded on August 30, 2005. The analysis includes households of immigrants and native-born children/grandchildren of immigrants who at birth only acquired the (foreign) citizenship of their parents. Register data have been integrated within a geographical information system (GIS), and all the residential addresses have been geocoded. For the estimation of λi(u), other geographically referenced covariates have been used, such as census tracts data from the 2001 General Population Census and data on rent cost per square meter for private residential properties, collected for the different areas of the city by the Italian Revenue Agency (OMI database).
4.1 Estimate of spatial intensities
Different areas of the city have different suitabilities for different socio-economic groups of migrants, with the availability of a job being the single most important factor. In Sec-tion 3 we menSec-tioned that a work specializaSec-tion among migrants of different naSec-tionalities has developed, so that the different logistic needs led to a differentiation of the settlement patterns. Here we consider two occupationally related groups of nationalities: “domes-tic workers” and “vendors”. The first group includes houseworkers and care givers and is made up of immigrants originating from Mauritius, Sri Lanka, Colombia, Philippines, Romany, India, Poland, and Ukraine. The second group includes street vendors and retail-ers and is made up of migrants from Senegal, Morocco, Tunisia, China, and Bangladesh. Figure 1 shows that whereas common workplaces for domestic workers are found in the wealthier and often peripheral residential neighborhoods, vendors benefit from locations that are close to the area surrounding the central business district. We deem it reasonable to assume that the environmental constraints within each occupational group are similar.
be, in turn, households belonging to each nationalityithat we are researching, while the controls will be all households belonging to the nationalities of the same occupational group ofibut with the exception ofi.
Our data are not strictly case–control data; however, in epidemiological studies, the limited availability of data for non diseased persons often leads to the use of the cases of a second disease, different from the disease under investigation, as controls (Waller and Gotway 2004). In the spatial econometric field, a similar approach is applied in Arbia et al. (2012).
We use kernel smoothing to estimate the intensity λ∗(u) of the controls, as im-plemented in thedensity()function of thespatstatpackage (Baddeley and Turner 2005) for theRcomputing environment (R Core Team 2014). Bandwidth is selected us-ing cross-validation. Then, the intensityλ(u)of the cases is estimated by a parametric model of the form
λ(u) =λ∗(u) exp{α+z(u)0β}, (4)
whereβ= (β1,. . .,βm)0is the vector of regression coefficients.
LetYj be equal to 1 or 0 according to whether thejth household is a case or a con-trol; under the assumption that both cases and controls are mutually independent IPPs, and conditional on their locations, we have
P(Yj= 1|zj) =
exp(α+zj0β)
1 + exp(α+zj0β)
, (5)
withzj being the vector of spatial covariates on the location of the jth household. As equation (5) is a logistic regression model, its coefficientsαandβcan be estimated by maximum likelihood (Diggle et al. 2007).
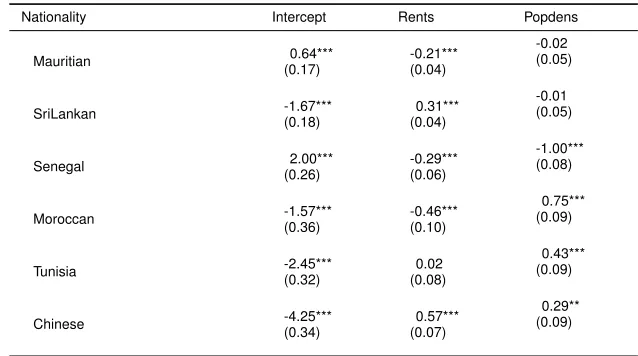
We consider the following spatially referenced explanatory variables for model (4):
• popdens, the overall population density. Data used are the population counts for each of the 2,425 city’s census tracts, as surveyed in the 2001 General Population Census (http://dawinci.istat.it/). Smooth population density has been estimated us-ing Tobler’s pycnophylatic interpolation algorithm (Tobler 1979).
• rent, minimum rent cost per square meter for private residential properties; these data are collected by the Italian Revenue Agency when rental contracts are regis-tered. For the city of Catania, data are provided grouped within 28 homogenous ge-ographical areas (Italian Revenue Agency - OMI database, http://www.agenziaentra te.gov.it/geopoi/omi/).
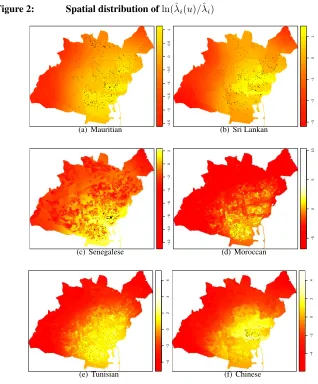
Fig-ure 2 shows the spatial distribution ofln(bλi(u)/bλi), wherebλiis the average intensity of
nationalityi, i = 1,. . ., 6; we use relative intensities to allow the comparison among the different nationalities. Furthermore, the log scale is used to make fractional changes equivalent.
Table 2: Estimated regression coefficients and standard errors forln(^λi(u)).
Nationality Intercept Rents Popdens
Mauritian 0.64***
(0.17)
-0.21*** (0.04)
-0.02 (0.05)
SriLankan -1.67***
(0.18)
0.31*** (0.04)
-0.01 (0.05)
Senegal 2.00***
(0.26)
-0.29*** (0.06)
-1.00*** (0.08)
Moroccan -1.57***
(0.36)
-0.46*** (0.10)
0.75*** (0.09)
Tunisia -2.45***
(0.32)
0.02 (0.08)
0.43*** (0.09)
Chinese -4.25***
(0.34)
0.57*** (0.07)
0.29** (0.09)
Figure 2: Spatial distribution ofln(ˆλi(u)/ˆλi)
−2.5
−2
−1.5
−1
−0.5
0
0.5
1
(a) Mauritian
−3
−2
−1
0
1
(b) Sri Lankan
−12
−10
−8
−6
−4
−2
0
2
(c) Senegalese
−5
0
5
10
(d) Moroccan
−4
−2
0
2
4
6
(e) Tunisian
−4
−2
0
2
4
(f) Chinese
4.2 Estimate of the spatial attraction
Having obtained the estimatesbλi(u),i= 1,. . .,p, for thep= 6nationalities considered, we can now compute the estimates for the inhomogeneousK-functionKbinhom,i(d).
me-ters. Plots also report the confidence envelopes referred to the null hypothesis of absence of interaction (see Section 2.4), at a significance levelα= 0.05and based onn= 999
Monte Carlo simulations. As in Diggle et al. (2007), each simulation is obtained by ran-domly relabeling cases and controls, with spatially varying probabilities given by (5). Distances corresponding to the peaks ofKbinhom,i(d)outside the envelopes are those at which there is significant spatial concentration or dispersion.
In Section 1 we mentioned the prominent role of social networks in attracting ar-riving migrants into specific neighborhoods and, also, channeling them into particular occupations (Gelderblom and Adams 2006).
MacDonald and MacDonald (1964) define the process in which “prospective mi-grants learn of opportunities, are provided with transportation, and have initial accommo-dation and employment arranged by means of primary social relationships with previous migrants” as chain migration. Chain migration subsidies the costs of migration; if the costs of migration are low, both economically and in terms of cultural distance, we may expect networks to play a less important role, and hence there is more individual migra-tion. Empirical studies suggest that the willingness to help aspiring migrants is related to the lack of assimilation of the previous migrants into the new environment and to their desire of reestablishing, in the new town, social ties with co-villagers and relatives; fur-thermore, the plan of moving back to their country of origin in a short time can make migrants warier of refusing to help when approached (Banerjee 1983). So, it seems rea-sonable to expect that nationalities with stronger relational ties with the country of origin, and a more prominent intention to migrate back, may show a stronger chain migration and higher degrees of spatial attraction.
Mauritians show a significant spatial attraction at almost all the distances considered (Figure 3). Mauritian migration in Italy is concentrated in a few southern cities, of which Catania accounts for the highest portion, thus denoting a strong chain migration effect (King and Andall 1999). Mauritians perceive their stay in Italy as economically motivated and temporary, with an intention to migrate back to their home country as soon as they accumulated enough money (Crane 2004).
Figure 3: Estimated inhomogeneousK-functions −4e+05 −2e+05 0e+00 2e+05 4e+05 6e+05 8e+05 d K
^inho
m , i ( d ) − Ei ( d ) 0 500 10001000 (a) Mauritian 0e+00 5e+05 1e+06 d K
^inho
m , i ( d ) − Ei ( d ) 0 500 10001000
(b) Sri Lankan
−2e+06 0e+00 2e+06 4e+06 6e+06 8e+06 1e+07 d K
^inhom
, i ( d ) − Ei ( d ) 0 500 10001000 (c) Senegalese −2e+06 −1e+06 0e+00 1e+06 2e+06 3e+06 d K
^inhom
, i ( d ) − Ei ( d ) 0 500 10001000 (d) Moroccan −2e+06 0e+00 2e+06 4e+06 6e+06 d K
^inhom
, i ( d ) − Ei ( d ) 0 500 10001000 (e) Tunisian −3e+06 −2e+06 −1e+06 0e+00 1e+06 2e+06 3e+06 4e+06 d K
^inhom
, i ( d ) − Ei ( d ) 0 500 10001000 (f) Chinese
Senegalese show a significant interaction at any distance. Most Senegalese migrants in Italy belong to the Mouride Sufi brotherhood, whose vertical and horizontal ties are reproduced in transnational networks, which help migrants to organize their business ac-tivities as well as their temporary settlement within the receiving contexts (Riccio 2008). Compared with other migrant communities, they show more mobility, following paths shaped by social, kinship and religious networks (Caritas Italiana, Fondazione Migrantes, and Caritas Diocesana di Roma 2004). Proofs of these mobility paths are on the Register Office database, which shows, over time, many Senegalese settling in and then leaving the same houses.
Tunisians show a settlement pattern consistent with random allocation. They are among the first immigrants who came to Sicily, with large communities settling in west-ern Sicily in the second half of the sixties, due to geographical proximity and maritime linkages. Tunisians are widely distributed in Italy, with a variety of labor market roles in different parts of Italy: mostly in the primary sector (fishing, farming) and peddling in Sicily, in the service sector in central Italy and in factories in the north of Italy (King and Andall 1999). One reason for the absence of spatial attraction may be the low rele-vance of migratory chains in Tunisian migration to Sicily, which is reported to be mainly dictated by individual choice (Daly 2001, p. 193).
Moroccans’ settlement pattern is also consistent with random allocation. As Tunisians, Moroccans also are a long-established group and they are widely dispersed in Italy, with different work specializations in different areas (King and Andall 1999). Moroccan mi-gration to Italy began in the mid-1970s, but levels of mimi-gration remained marginal until the 1980s and grew significantly in the 1990s, when Moroccans became the largest for-eign community in the country, before being overtaken by the Albanian and Romanian communities in recent years (Devitt 2013).
Chinese show a significant interaction at all distances less than d = 750meters. The very high spatial attraction at lower distances might be explained with the fact that the most part of Chinese are settled in the buildings surrounding the open market area where they now run most of the stores; this area is starting being referred by the press as a local “Chinatown”. Chang (2012, p. 181) reports Chinese migration in Italy to be a “calculated choice, made in the best interests of the family” and being characterized by “chain migration, ethnic enclave and familial duty”. In addition to a great linguistic distance, Chinese live rather secluded (Mazza and Punzo 2016).
5. Conclusions
Traditional indices of spatial segregation rely on data aggregated by areal unit, typically census tracts (Mazza and Punzo 2015); see Matthews and Parker (2013) for a review of new spatially derived techniques to analyze segregation. These indices generally suf-fer from the modifiable area unit problem and do not allow us to distinguish between economically induced segregation, typically due to spatial inhomogeneity in the cost of living and job availability within different parts of the city, from spatial attraction among individuals of the same ethnicity. Schelling (1971) pinpoints the importance of this dis-tinction, positing that even mild preferences for living with similar neighbors carry the potential to be strong determinants for residential segregation. In the case of minority migrants, spatial attraction may be stronger when the cost of settling is higher, either eco-nomically or in terms of cultural distance, and social networks may play an important role in channeling arriving migrants into specific neighborhoods and particular occupations.
We applied point-pattern analysis to analyze the settlement patterns of foreign mi-grants in the city of Catania (Italy); this approach was motivated by Almquist and Butts (2012) and Matthews and Parker (2013). We used the inhomogeneous K-function to assess spatial attraction among migrants while adjusting for spatial inhomogeneity.
To avoid the risk of confounding the two sources of clustering, spatial inhomogene-ity is estimated following a case-control approach. We considered two groups, according to a work specialization that has developed among nationalities: domestic workers and vendors. The first group includes nationalities devoted to house work and care giving, the second group nationalities committed to peddling and retailing. We deemed it reasonable to assume that the environmental constraints within each occupational group are similar. We analyzed the six nationalities with the highest number of households.
Data at hand came from the population register, as recorded on August 30, 2005, and included individual residential addresses for all foreign residents. For each of the six nationalities analyzed, we considered the set of all the other nationalities of the same oc-cupational group as a control group. Spatial inhomogeneity has been estimated for each nationality by means of a parametric model of the spatial intensity of the controls and two explanatory variables related to the overall population density and to the minimum rent cost per square meter. The spatial intensities of the controls has been estimated nonpara-metrically. All nationalities share a spatial trend, with higher values in the more central parts of the city and in the central business district, and lower in the more peripheral ar-eas. However, this spatial trend is much stronger for the vendors group than it is for the domestic workers group.
References
Almquist, Z.W. and Butts, C.T. (2012). Point process models for household dis-tributions within small areal units. Demographic Research S13(22): 593–632.
doi:10.4054/DemRes.2012.26.22.
Altavilla, A.M. and Mazza, A. (2012). On the analysis of immigrant settlement patterns using quadrat counts: The case of the city of Catania (Italy). Advances and Applica-tions in Statistics29(2): 111–123.
Arbia, G., Espa, G., Giuliani, D., and Mazzitelli, A. (2012). Clusters of firms in an inhomogeneous space: The high-tech industries in Milan. Economic Modelling29(1): 3–11.doi:10.1016/j.econmod.2011.01.012.
Baddeley, A. (2010). Analysing spatial point patterns in R. Tech. rep., CSIRO. www. csiro. au/resources/pf16h.html.
Baddeley, A.J., Møller, J., and Waagepetersen, R. (2000). Non- and semi-parametric es-timation of interaction in inhomogeneous point patterns.Statistica Neerlandica54(3): 329–350.doi:10.1111/1467-9574.00144.
Baddeley, A., Rubak, E., and Turner, R. (2015). Spatial point patterns: Method-ology and applications with R. London: Chapman and Hall/CRC Press. http://www.crcpress.com/Spatial-Point-Patterns-Methodology-and-Applications-with-R/Baddeley-Rubak-Turner/9781482210200/.
Baddeley, A. and Turner, R. (2000). Practical maximum pseudolikelihood for spa-tial point patterns. Australian and New Zealand Journal of Statistics 42: 283–322.
doi:10.1111/1467-9574.00144.
Baddeley, A. and Turner, R. (2005). Spatstat: An R package for analyzing spatial point patterns.Journal of Statistical Software12(6): 1–42. http://www.jstatsoft.org/v12/i06/. Banerjee, B. (1983). Social networks in the migration process: Empirical evidence on
chain migration in India.The Journal of Developing Areas17(2): 185–196.
Bartlett, M. (1963). The spectral analysis of point processes.Journal of the Royal Statis-tical Society. Series B25(2): 264–296.
Busetta, A., Mazza, A., and Stranges, M. (2016). Residential segregation of foreigners: an analysis of the Italian city of Palermo.Genus71(2–3): 177–198.
Caritas Italiana, Fondazione Migrantes, and Caritas Diocesana di Roma (2004). Immi-grazione, Dossier Statistico 2004. XIV Rapporto. Rome: Idos.
doi:10.1111/j.1478-0542.2011.00833.x.
Clark, W.A. and Fossett, M. (2008). Understanding the social context of the Schelling segregation model. Proceedings of the National Academy of Sciences105(11): 4109– 4114.
Crane, K. (2004). Governing migration: Immigrant groups’ strategies in three Italian cities – Rome, Naples and Bari. Tech. rep., Psychoanalytic Institute for Social Re-search, Rome.
Daly, F. (2001). The double passage. In: King, R. (ed.).The Mediterranean passage: Migration and new cultural encounters in Southern Europe. Liverpool: Liverpool Uni-versity Press.
Devitt, C. (2013). Circular economic migration between Italy and Morocco. In: Triandafyllidou, A. (ed.). Circular migration between Europe and its neighbourhood: Choice or necessity? Oxford: Oxford University Press.
doi:10.1093/acprof:oso/9780199674510.003.0005.
Diggle, P.J., G´omez-Rubio, V., Brown, P.E., Chetwynd, A.G., and Gooding, S. (2007). Second-order analysis of inhomogeneous spatial point processes using case-control data.Biometrics63(2): 550–557. doi:10.1111/j.1541-0420.2006.00683.x.
Freeman, L., Pilger, J., and Alexander, W. (1971). A measure of segregation based upon spatial arrangements. University of Hawaii.
Gelderblom, D. and Adams, W. (2006). The limits and possibilities of migrant networks. In: Kok, P., Gelderblom, D., Oucho, J.O., and Van Zyl, J. (eds.).Migration in South and Southern Africa: Dynamics and determinants. Cape Town: HSRC Press: 227–248. Harvey, D. (1966). Geographic processes and the analysis of point patterns: Testing models of diffusion by quadrat sampling. Transactions of the Institute of British Ge-ographers XL81–95.doi:10.2307/621570.
Heinrich, L. (1991). Goodness-of-fit tests for the second moment function of a stationary multidimensional Poisson process. Statistics 22(2): 245–268.
doi:10.1080/02331889108802308.
King, R. and Andall, J. (1999). The geography and economic sociology of recent immi-gration to Italy.Modern Italy4(2): 135–158.doi:10.1080/13532949908454826. Kumar, N. (2007). Spatial sampling design for a demographic and health survey.
Popula-tion Research and Policy Review26(5-6): 581–599.doi:10.1007/s11113-007-9044-7. Kumar, N., White, M.J., and Singh, G. (2013). Multi-group individual level measures of
Licciardello, O. and Damigella, D. (2011). Immigrants and natives: Ways of constructing new neighbourhoods in Catania, Sicily. In: Armbruster, H. and Meinhof, U.H. (eds.).
Negotiating multicultural Europe: Borders, networks, neighbourhoods. London: Pal-grave Macmillan: 141–158.doi:10.1057/97802303464757.
MacDonald, J.S. and MacDonald, L.D. (1964). Chain migration, ethnic neighborhood formation and social networks. The Milbank Memorial Fund Quarterly42(1): 82–97.
doi:10.2307/3348581.
Matthews, S. and Parker, D.M. (2013). Progress in spatial demography. Demographic Research28(10): 271–312.
Mazza, A. and Punzo, A. (2015). On the upward bias of the dissimilarity index and its corrections.Sociological Methods and Research44(1): 80–107.
Mazza, A. and Punzo, A. (2016). Dealing with omitted answers in a survey on social integration of immigrants in Italy.Mathematical Population Studies.Forthcoming. Møller, J. and Waagepetersen, R.P. (2003).Statistical inference and simulation for spatial
point processes. London: CRC Press.
Openshaw, S. (1984).The modifiable areal unit problem. Norwich: Geobooks.
R Core Team (2014).R: A language and environment for statistical computing. R Foun-dation for Statistical Computing, Vienna. http://www.R-project.org/.
Reardon, S.F. (2006). A conceptual framework for measuring segregation and its asso-ciation with population outcomes. In: Oakes, J. and Kaufman, J. (eds.).Methods in social epidemiology. San Francisco: Jossey-Bass: 169–192.
Riccio, B. (2008). West African transnationalisms compared: Ghanaians and Senegalese in Italy. Journal of Ethnic and Migration Studies 34(2): 217–234.
doi:10.1080/13691830701823913.
Ripley, B.D. (1981). Spatial statistics. New York: John Wiley & Sons.
doi:10.1002/0471725218.
Ripley, B.D. (1991). Statistical inference for spatial processes. Cambridge: Cambridge University Press.
Schelling, T.C. (1971). Dynamic models of segregation. Journal of Mathematical Soci-ology1(2): 143–186.doi:10.1080/0022250X.1971.9989794.
Tobler, W.R. (1979). Smooth pycnophylactic interpolation for geographical re-gions. Journal of the American Statistical Association 74(367): 519–530.
doi:10.1080/01621459.1979.10481647.
vol. 368. New York: John Wiley & Sons.doi:10.1002/0471662682.