Copyright © 2016 IJECCE, All right reserved
Grading of Apples and Oranges by Image Processing
Osama A. Alhashi
Lecturer Assistant, College of ElectronicTechnology, Libya osamahashi@yahoo.com
Fathey S. Almahjob
Lecturer Assistant, College of ElectronicTechnology, Libya almahjob@ymail.com
Abdelsalam A. Almarimi
Associate Professor, College of Electronic TechnologyBaniwalid, Libya belgasem2000@yahoo.com
Abdosllam M. Abobaker
Associate Professor, College of Electronic Technology Baniwalid, Libyaalmahjub11@yahoo.com
Abstract – The aim of this paper is to assess and determine
the ripeness and quality of apples. To meet the goals, we propose and implement certain methodologies and algorithms that are based on digital fuzzy image processing, content predicated analysis, and statistical analysis. We found that the proposed algorithm is an efficient one as it is able to detect and sort the apples with more accuracy in grading compared to human expert sorting. The textures on apple skin are captured using digital camera. These images are filtered using image processing technique. All the information gathered is processed using MATLAB to determine the apple ripeness accuracy. In MATLAB, first we find the RGB component of a good apple and a ripen apple. Then, the image is converted to a grayscale image in order to obtain the histogram graph for analyzing the results. Besides, we also apply the same algorithm to orange fruit to verify the validity. The results presented in this paper corroborate that the automated grading system helps to minimize the processing time as well as the assessment error.
Keywords – Digital Image Processing, RGB Components,
Histogram, Apple Ripeness.
I.
I
NTRODUCTIONIt is impossible to overestimate the importance of the agricultural products as they form the basic requirements for living beings, more specifically, human beings. In the previous years, the grading of the agricultural products was carried out by humans. Therefore, it has become the need of the hour to propose an automated grading to speed up the grading system of the agricultural products to fulfil the demands posed by the society in the recent years [1], [2]. In this line, in the recent past, researchers have proposed several models using image processing techniques [3],[4], [5], [6].
Over the last two centuries, fruit categorizations in agriculture have changed from traditional grading by humans to automatic grading. Many companies have started moving to automated grading in many crops such as grading on peaches, oranges, etc. In order to classify apples, we need to be aware of the apple grading standard. Color and size are the most significant criteria that are used to sort out the fruits. However, for sorting of apples, the skin texture of apples is another major factor that could improve the accuracy of the classification system.
Traditional methods for assessing fruit ripeness are unfortunately destructive. Hence, they cannot be so readily applied, particularly in mass production. This paper presents a non-destructive method for determining the ripeness of apple based on its color. We take into account the RGB components of good and ripened apples. Then, the image is converted to grayscale image to obtain the
histogram graph with which the results are analyzed [7], [8].
The objective of this work is to classify between the ripeness indexes of the apples based on RGB and histogram process. The significance of this study is to determine the ripeness stages by using color space of the apples.
II.
P
ROPOSEDM
ETHOD:
A
PPLEG
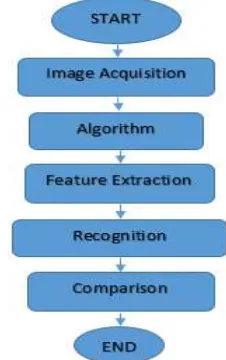
RADINGThis study proposes an apple grading method for classifying the quality of apples by using image analysis. The algorithm of the proposed method consists of the following five steps.
Step 1: Detect the color of an apple by determining the mean of three color arrays for red, green and blue.
Mean image = [Red value (Find size image) + Green value
(Find size image) + Blue value (Find size image)]/3 Step 2: Determine the size of the apple by calculating the area of image object.
Step 3: Apply edge detection algorithm to determine the skin of image apple.
Mean skin = [edge (Red value) + edge (Green value) + edge (Blue value)].
Step 4: Histogram results are compared using size, color and skin for grading the apples.
Step 5: Rank the quality of apples based on apple grade. The flow and framework of this study are shown in Figs. 1 and 2.
Fig. 2. Frame work of the proposed work.
III.
Q
UALITYD
ETERMINATION OFA
PPLES USINGI
MAGEP
ROCESSINGAs the main objective of this work is to determine the automated quality of apples using image processing technique, in this section, we discuss general representation of the images with 8- and 16-bits [9].
A.
Representation of 8-Bit and 16-Bit RGB Images:
It is obvious that any image is represented by a set of numeric data. Here, the color components of an 8-bit RGB image are represented by a set of integers in the range [0, 255] instead of the floating-point values in the range [0, 1]. A pixel is displayed as white if its color components are represented by (255,255,255). The following command in MATLAB displays an RGB image correctly [9].
image (RGB);
Now, we multiply by 255 in order to convert an RGB image from double to uint8.
RGB8 = uint8 (round (RGB64*255));
Then, we divide by 255 to convert RGB8 (a uint8 RGB) image into double. We use the following command
RGB64 = double (RGB8)/255
As a next step, we multiply by 65535 for converting an RGB image from double to uint16. The following command is used.
RGB16 = uint16 (round (RGB64*65535));
As has been done in the previous step, we divide by 65535 for converting a uint16 RGB image into double and the following command is used.
RGB64 = double (RGB16)/65535;
B.
Converting an 8-Bit RGB Image to Grayscale:
Now, we proceed to perform arithmetic operations on integer data for generating a grayscale image. According to NTSC standard, we calculate the monochrome luminance by combining the RGB values. The following expression clearly relates the eye's sensitivity to RGB colors.
I = .2989*rgb_img(:,:,1)... +.5870*rgb_img(:,:,2)... +.1140*rgb_img(:,:,3);
Here, I is an intensity of image which is represented by a set of integer values ranging from a minimum of zero. The following commands are used to display the minimum and maximum values.
min(I(:)) ans = 0
to a maximum of 255: max(I(:))
ans = 255
Now, we use a grayscale colormap with 256 values for displaying the image. One can also use the ‘imagesc’ function. By using appropriate function (the grey colormap), we display the image in a new figure.
figure; colormap(grey(256)); image(I).
IV.
I
MAGEP
ROCESSING OFG
OODA
PPLESHaving discussed the necessary flow charts and detailed programming analysis, now, we turn to look at the procedures involved in identifying good apples by the method of image processing.
Fig. 3. Image of a good apple.
Step 1: To start with, we capture the image of a good apple which is shown in Fig. 3.
Step 2: Converting real image into grayscale image. In the second step, the captured original digital image is converted into grayscale digital image wherein the value of each pixel is a single sample that carries the desired intensity information. It is established that the grayscale image is composed of shades of gray. That is, it varies from black at the weakest intensity to white at the strongest. Fig. 4 represents the typical image of a good apple in the grayscale.
Copyright © 2016 IJECCE, All right reserved Step 3: Plot the Histogram
Fig. 5. Histogram of a good apple
Here, as a final step, we use the image histogram for determining the quality of apples by image processing technique. In general, the image histogram barchart throws light on image tone distribution over a range in a digital image. In other words, we can say that it is a kind of graphical representation of the number of pixels in a digital image as a function of intensity. Thus, the investigators will be able to determine the quality of apples in terms of available tonal distribution which could easily be accessed by examining the histogram for a specific image. The histogram of a good apple is depicted in Fig. 5.
V.
I
MAGEP
ROCESSING OFR
OTTENA
PPLESSimilar to the case of good apples, we carry out the image processing analysis for rotten apples as the following steps:
Step 1: In this case, we capture the image of a rotten apple which is shown in Fig. 6.
Fig. 6. Image of a rotten apple
Step 2: Converting real image of the rotten apple into grayscale image. Fig. 7 is the image of the rotten apple in the grayscale.
Fig. 7. Image of a rotten apple in grayscale
Step 3: Plot the Histogram
Fig. 8. Histogram of a rotten apple
As a final step, we get the histogram of a rotten apple and the same is shown in Fig. 8.
VI.
I
MAGEP
ROCESSING OFO
RANGEF
RUITSIn the previous sections IV and V, we have discussed the automated grading system for sorting apples using image processing technique in terms histogram plots. Further, these results corroborate that the proposed image processing algorithm is the successful one in gauging the quality of the apples. It is of paramount importance to confirm if the proposed algorithm holds good for other fruits too and the same turns out to be the objective of this section. For brevity, we consider sorting of orange fruits. We follow the similar procedures for both good and rotten orange fruits. As a first step, we capture image of a good orange and the same is shown in Fig. 9.
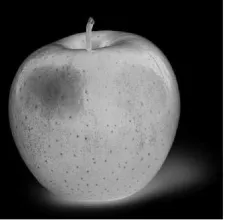
Fig. 9. Image of a good orange
Then, we convert the original orange fruit digital image into grayscale image using the proposed algorithm. Fig. 10 represents the grayscale image of a good orange fruit.
Fig. 10. Image of a good orange in grayscale
Fig. 11. Histogram of a good orange.
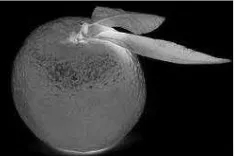
As has been discussed in the case of grading of apples, we now proceed to carry out the image processing for a rotten orange fruit. Figs.12 and 13 represent the original digital image and grayscale image of a rotten orange fruit, respectively.
Fig. 12. Image of a rotten orange
Fig. 13. Image of a rotten orange in grayscale
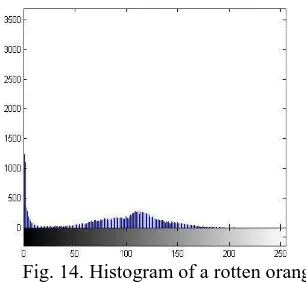
Fig. 14. Histogram of a rotten orange
Finally, we plot the histogram of a rotten orange using the proposed image processing technique. Fig. 14 shows the histogram of a rotten orange.
VII.
R
ESULTS ANDD
ISCUSSIONUsing the hitherto mentioned image processing technique, we have computed the parameters for a good apple as well as a rotten apple. Here, we have considered
the parameters of a good apple as reference. Thus, the quality of the rotten apple has been determined by comparing the both the histograms of good and rotten apples. Besides, we have also verified validity of the proposed image processing algorithm by applying the same to other fruit, namely, orange. From these results, we have been able to infer that the proposed image processing technique is an efficient automated grading system as it is able to successfully predict and sort the quality of the apple and orange fruits with more accuracy. Thus, we envisage that the automated grading system proposed in this paper would undoubtedly help minimize the processing time and the assessment error.
Thus, we are of the opinion that this study would become significant and may contribute to the perspective of new knowledge on fuzzy image clustering model. We are enormously confident that the image processing technique discussed here could be adapted to the other fruits such as mangos, pineapples, banana, etc.
R
EFERENCES[1] R. C. Gonzalez and R. E. Woods, “Digital Image Processing
using MATLAB, 3rd Edition, Pearson, 2007.
[2] V. Jumb, M. Sohani, A. Shrivas, “Color image segmentation
using K-means clustering and Otsu’s adaptive thresholding”, International Journal of Innovative Technology and Exploring Engineering, vol. 3, no. 9, pp. 2278-3075, 2014.
[3] Tinku Acharya, Ajoy K. Ray, "Image Processing Priciples and
Applications", 2005 by John Wiley & Sons.
[4] J. Canny., “A computational approach to edge detection”, IEEE
Trans. On PAMI, 8(6):679–698, 1986.1348 –1363, Sep. 1997.
[5] C. Chandhok, S. Chaturvedi and A. A. Khurshid, “An approach
to image segmentation using K-means clustering algorithm”,
International Journal of Information Technology, vol. 1, no. 1,
pp. 11-17, 2012.
[6] N. Valliammal and S. N. Geethalakshmi, “Automatic recognition
system using preferential Image Segmentation for Leaf and Flower Images”, Computer Science & Engineering: An International Journal, vol. 1, no. 4, pp. 13-25, 2011.
[7] B. Lurstwnt and C. Pompanomchai, “Plant seed image
recognition system”, International Journal of Engineering Technology, vol. 3, no. 6, pp. 600-605, 2011.
[8] K. K. Singh and A. Singh, “A study of image segmentation
algorithms for different types of images,” International Journal of Computer Science, vol. 7, no. 5, pp.1694-0784, 2010. [9] www.mathwork.com (Accessed in Mar 2016).
A
UTHOR’
SP
ROFILEMr. Osama Alhashi received the B.Sc. in 2006 and
M.Sc. in 2015, College of Electronic Technology Baniwalid (CETB), Libya, at the Department of Computer Engineering & IT, College of Electronic Technology Baniwalid (CETB), Libya. Mr. Alhashi is currently a Lecturer Assistant at the Department of Computer Engineering & IT, College of Electronic Technology Baniwalid (CETB), Libya.
Mr. Fathey Almahjob received the B.Sc. in 2002
Copyright © 2016 IJECCE, All right reserved Dr. Abdelsalam Almarimi received the M.Sc. in Feb
1997, Informatics, Faculty of Electronics and
Information Technology, Warsaw University of
Technology, Poland and the Ph.D., Nov 2005, Informatics and Computer Science, Faculty of Electrical Engineering, Czech Technical University in Prague, Czech Republic. Dr. Almarimi is currently an Associate Professor at the Department of Computer Engineering & IT, College of Electronic Technology Baniwalid (CETB), Libya.
Dr. Abdosllam Abobaker received the M.Sc. in 2003,
UKM university in Malaysia, and the Ph.D. in 2010, University of Aberdeen, UK. Dr. Abobaker is currently an Associate Professor at the Department of Computer Engineering & IT, College of Electronic Technology Baniwalid (CETB), Libya.