Cite as
Zdrojowy-Wełna A, Bednarek-Tupikowska G, Zatońska K, Kolačkov K, Jokiel-Rokita A, Bolanowski M. The association between FTO gene polymorphism rs9939609 and obesity is sex-specific in the population of PURE study in Poland Adv Clin Exp Med. 2020;29(1):25–32.
doi:10.17219/acem/111811
DOI
10.17219/acem/111811
Copyright
© 2020 by Wroclaw Medical University This is an article distributed under the terms of the Creative Commons Attribution Non-Commercial License (http://creativecommons.org/licenses/by-nc-nd/4.0/)
Address for correspondence
Aleksandra Zdrojowy-Wełna
E-mail: [email protected]
Funding sources
Wroclaw Medical University Grant for Young Researchers (grant No. 158)
Conflict of interest
None declared
Received on February 12, 2019 Reviewed on March 12, 2019 Accepted on August 18, 2019
Published online on January 22, 2020
Abstract
Background. Fat mass and obesity-associated gene (FTO) polymorphism remains the strongest known genetic determinant of common obesity. However, its influence depends on ethnicity, and the FTO-mediated predisposition to other metabolic disturbances is questionable.
Objectives. The aim of our study was to evaluate the association between FTO rs9939609 polymorphism and metabolic syndrome in a population of Prospective Urban Rural Epidemiology (PURE) study in Poland. Material and methods. We enrolled 1,097 participants of the PURE study (683 women and 414 men) from the Lower Silesian voivodeship. Anthropometrical parameters and blood pressure were measured. Blood samples were taken for an examination of lipid profile and fasting glucose level. Genomic DNA was isolated and FTO polymorphism rs9939609 was genotyped.
Results. Male A-allele carriers had significantly higher mean body mass, body mass index (BMI), waist-to-hip ratio (WHR), and waist and hip circumferences than men without risk allele. They were also more often diagnosed with obesity on the basis of BMI and central obesity parameters. No such influence was observed in women. There were no significant associations between FTO polymorphism and metabolic syndrome or its components.
Conclusions. Our results suggest a sex-specific association between FTO polymorphism and obesity traits. The occurrence of metabolic syndrome or its components was not related with FTO gene variation in our cohort.
Key words: metabolic syndrome, obesity, FTO gene, PURE study
The association between
FTO
gene polymorphism rs9939609
and obesity is sex-specific in the population of PURE study in Poland
Aleksandra Zdrojowy-Wełna
1,A–D,F, Grażyna Bednarek-Tupikowska
1,A,C,E,F, Katarzyna Zatońska
2,A–C,E,F,
Katarzyna Kolačkov
1,B–D,F, Alicja Jokiel-Rokita
3,C–F, Marek Bolanowski
1,A,C,E,F1 Department of Endocrinology, Diabetes and Isotope Therapy, Wroclaw Medical University, Poland 2 Department of Social Medicine,Wroclaw Medical University, Poland
3 Department of Pure and Applied Mathematics,Wroclaw University of Science and Technology, Poland
A – research concept and design; B – collection and/or assembly of data; C – data analysis and interpretation; D – writing the article; E – critical revision of the article; F – final approval of the article
Background
The rising prevalence of obesity and overweight has been de-scribed as a global pandemic, accounting for about 3.4 million deaths in 2010.1 In order to decrease this tendency, we need
to understand the pathogenesis of adiposity and its complica-tions, such as diabetes, hypertension and dyslipidemia.
Since 2007, it has been shown that variations in the first intron of the fat mass and obesity-associated (FTO) gene contribute to excessive weight in many populations.2–5
However, this relation is race-specific and not all stud-ies have confirmed the influence of FTO gene variation on body mass index (BMI).6,7 The association between FTO gene and cardiovascular complications is also contro-versial. Some authors have shown that risk allele carriers are predisposed to metabolic syndrome (higher fasting glucose, insulin, triglycerides, and lower high-density-li-poprotein (HDL) cholesterol serum levels),8 or its
compo-nents even after BMI adjustment.9–11 Others studies found
no link between FTO and diabetes12 or other metabolic
disturbances.4,13
The FTO gene is located in chromosome region 16q12.2 and encodes the nucleic acid demethylase. It is expressed in many tissues, most highly in hypothalamic regions re-sponsible for energy homeostasis.14 The major substrate
for FTO protein is N6-methyladenosine (m6A)
in nucle-ar RNA.15 The m6A is a prevalent internal modification
of messenger RNA (mRNA), regulating gene expression16;
thus, its demethylation plays an important role in mRNA processing.17 People with FTO risk alleles are predisposed
to obesity probably as a result of impaired central satiety processing and increased food intake18,19 together with
a preference for high-calorie foods.20,21FTO gene may also
be involved in the regulation of adipogenesis,17,22 lipolysis23
and adipocyte thermogenesis.24
Although many previous studies concerned variations in the FTO gene with respect to obesity, there are a few important reasons to perform our analysis. Firstly, the in-fluence of FTO gene on obesity and metabolic complica-tions differs in various ethnic groups.25 A recent
associa-tion analysis in Poland confirmed the correlaassocia-tion between susceptibility loci in intron 1 of the FTO gene with obe-sity; however, it did not include the aspect of cardiovas-cular complications.26 Other studies conducted in Poland
were based on smaller sample sizes13,27 or included only
specific groups, like children with diabetes28 or women
with polycystic ovary syndrome (PCOS).29 We examined
the largest number of subjects from an unselected Polish population for the FTO variation and metabolic syndrome components.
Objectives
The aim of our study was to assess the association be-tween FTO rs9939609 single nucleotide polymorphism
(SNP) and obesity and metabolic syndrome components in the Polish group from the Prospective Urban Rural Epi-demiology (PURE) study.
Material and methods
Study group and examination protocol
We enrolled 1,097 subjects (683 women and 414 men) from the Lower Silesian voivodeship in Poland (690 in-habitants of the city of Wrocław and 407 inin-habitants of neighboring rural area), aged 30–80 years, who took part in the PURE study in years 2007–2010. The aims and design of the PURE study have been published elsewhere.30
Each participant answered the PURE Questionnaire col-lected by a trained person, providing information about age, social background and medical history (including chronic medication and comorbidities). The physical ex-amination included measurement of height with the sub-ject’s head in Frankfurt plane (accuracy of 0.5 cm) and weight on calibrated Tanita scales (accuracy of 0.1 kg). The BMI was calculated as follows:
BMI = weight [kg] [height [m]]2.
The waist circumference was measured with tape, half-way between the lowest rib and the top of the hipbone. The hip circumference was measured with tape, at the wid-est part of the buttocks. The waist-to-hip ratio (WHR) was calculated as follows:
WHR = waist circumference [cm] hip circumference [cm].
After 10 min of rest, the blood pressure was measured twice on the right arm with the use of Omron HEM-757 apparatus (Osaka, Japan). Blood samples from ulnar vein were taken in the morning after 8 h of fasting, and centri-fuged at 1,000 × g for 20 min at 4°C. Each serum sample was stored at −80°C. Total serum cholesterol, triglycerides and HDL cholesterol were measured using standardized meth-ods with the enzymatic assay SPINREACT (Sant Esteve De Bas, Girona, Spain). The level of low-density lipoprotein (LDL) cholesterol was estimated using Friedewald formula:
LDL cholesterol = triglycerides – HDL cholesterol – – triglycerides/5
(in patients with triglycerides concentration lower than 400 mg/dL).
(men) or 1.29 mmol/L (women), and fasting blood sugar over 100 mg/dL (National Cholesterol Education Program – Adult Treatment Panel III (NCEP-ATPIII) criteria).
Each participant submitted oral and written consent. The study was approved by Wroclaw Medical University Ethical Committee (approval No. KB 438/2014).
Genotyping
The FTO gene contains several polymorphic sites. In many populations, obesity susceptibility loci were found in intron 1 of the gene. The rs9939609 variant stays in strong linkage disequilibrium with other polymorphic sites in this intron, which gives the rationale to select this variant for genotyping in our study.
The genomic DNA was extracted from peripheral blood leukocytes in the blood samples according to the protocol of a commercial DNA isolation kit (NucleoMag® 96 Blood;
Macherey-Nagel GmbH & Co. KG, Düren, Germany). Poly-merase chain reaction (PCR) conditions were optimized and a pair of specific primers was designed (synthesized by Generi Biotech s.r.o., Hradec Králové, Czech Republic) for the amplification and identification of the rs9939609
FTO gene polymorphism:
5’-CACTAACATCAGTTATGCAT-3’ – forward primer 5’-CCATTTCTGACTGTTACCTA-3’ – reverse primer. Specific fragments of the FTO gene containing poly-morphic sites were amplified with PCR using the TaKaRa Taq DNA Polymerase Amplification Kit (Takara Bio Inc., Shiga, Japan). The PCR mix (20 μL) contained forward and reverse primers (as above), 1 × PCR buffer containing 1.5 mM MgCl2, 200 μM dNTPs, 2 units of Taq polymerase,
and 200 ng of genomic DNA. Amplification was performed using a TPersonal Thermocycler (Biometra GmbH, Göt-tingen, Germany) with the following cycle conditions: ini-tial denaturation at 95°C for 5 min, followed by 35 cycles of: denaturation at 95°C for 30 s, annealing at 55°C for 45 s, extension at 72°C for 45 s, and final extension at 72°C for 5 min. The post-PCR products were purified of excess primers and nucleotides using a mixture of SAP and ExoI enzymes (Thermo Fisher Scientific, Waltham, USA).
The identification of gene polymorphism was performed using the minisequencing method according to the proto-col of an ABI PRISM® SNaPshot™ Multiplex Kit (Thermo
Fisher Scientific). The reaction was carried out in the pres-ence of primers extended using single fluorescin the pres-ence-labeled dideoxynucleotide (ddNTP). This reaction consisted of 25 cycles: denaturation at 96°C for 10 s, annealing at 50°C for 5 s and extension at 60°C for 30 s. The designed specific primer was:
5’-TGTCTGAATTATTATTCTAGGTTCCTTGC-GACTGCTGTGAATTT-3’.
Fluorescently labeled products of the reaction were sepa-rated with capillary electrophoresis in ABI PRISM® 3100
Genetic Analyzer (Thermo Fisher Scientific) and analyzed by GeneMapper® software v. 4.0 (Thermo Fisher Scientific).
Statistical analysis
Statistical analysis was performed using STATISTICA v. 12 for Windows (StatSoft Inc., Tulsa, USA). We described variables using elements of descriptive statistics that in-cluded the following: minimum and maximum value, mean and standard deviation (SD). Contingency tables were cre-ated for qualitative data. The Shapiro–Wilk test was used to verify how well the distribution of the studied charac-teristics fitted with normal distribution. If the hypoth-esis of normality was not rejected, then the Student’s test or Welch’s test was used to verify the equality of means, depending on the hypothesis of equality of variances could be accepted.
The distribution of most of the variables was significantly different from the normal distribution; thus, nonpara-metric methods were also used to conduct the analysis. The hypotheses of homogeneity (equality) of distributions were verified using the Kolmogorov–Smirnov test and the Mann–Whitney test, depending on the assumption of the Mann–Whitney test could be accepted. We used the χ2 test to verify the hypothesis of independence
between qualitative data. Frequencies of the observed alleles were tested against the Hardy–Weinberg equi-librium. Differences were considered statistically significant at p < 0.05.
Results
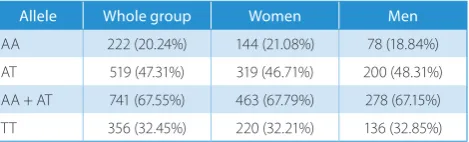
We genotyped SNP rs9939609 in 1,097 individuals (683 women and 414 men). The frequency of A-allele (obe-sity risk allele) among participants was 0.44 and of T-allele – 0.56. Variant frequencies followed the Hardy–Wein-berg equilibrium and the genotyping success rates exceed-ed 98%. Briefly, 20.2% of the study group were homozygous for A-allele (AA-group), 32.4% had 2 T-alleles (TT-group) and 47.3% were heterozygotes (AT-group) – see Table 1. The occurrence of alleles was sex-independent (p = 0.6659).
The characteristics of the study group are shown in Ta-ble 2. Mean BMI among participants was 28.2 kg/m2.
About 31% of the group had obesity defined with a BMI over 30 kg/m2 – similarly in both sex groups, while
over-weight (BMI 25–29.9 kg/m2) affected 48.6% of men and
36.6% of women (p = 4 × 10⁻⁵). Central obesity according
to waist circumference criterion (over 88 cm in women
Table 1. The frequencies of FTO polymorphism rs9939609 alleles in the study group
Allele Whole group Women Men
and 102 cm in men) was diagnosed in 45.3% of women and 35.6% of men (p = 0.0017). According to WHR cri-terion, central obesity was present in 39% of women (WHR > 0.85) and 81.8% of men (WHR > 0.9). In our ex-amination, 42.9% of men and 25.6% of women had blood pressure over 140/90 mm Hg, indicating hypertension (p < 10−5). Impaired fasting glucose (100–125 mg/dL)
oc-curred in 31.9% of the participants, while hyperglycemia suggestive for diabetes (>126 mg/dL) was present in 6.6% of the study group (no difference between men and women, p = 0.948). Mean total and HDL cholesterol levels were higher in women than in men, while men had higher lev-els of triglycerides in the blood. There was no significant
difference in LDL cholesterol levels between sex groups. Three hundred eighty-two participants (37% of the group) fulfilled the NCEP-ATPIII criteria for the presence of met-abolic syndrome, and there was no difference between men and women (p = 0.68).
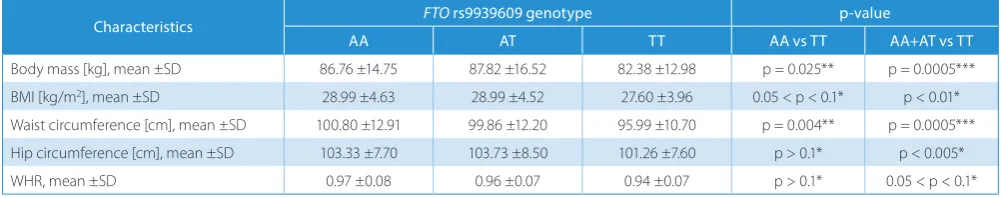
There were no significant associations between obe-sity parameters and FTO rs9939609 polymorphism in the whole study group (Table 3). However, when we ana-lyzed men and women separately, obesity traits were sig-nificantly associated (p < 0.01 after adjustment for multiple testing) with the occurrence of A-allele in men (Table 4). The differences were present both in the recessive and co-dominant model. A-allele carriers had higher mean
Table 2. Characteristics of the study group
Characteristics Study group Women Men p-value
Number of subjects 1,097 683 414 –
Age [years], mean ±SD 54.20 ±9.26 54.38 ±8.86 53.98 ±9.89 p < 0.05* BMI [kg/m2], mean ±SD 28.2 ±5.0 28.0 ±5.4 28.5 ±4.4 p < 0.001*
Waist circumference [cm], mean ±SD 92.1 ±13.9 88.1 ±13.4 98.8 ±12 p < 0.001*
WHR, mean ±SD 0.88 ±0.09 0.84 ±0.07 0.96 ±0.07 p < 0.001*
SBP [mm Hg], mean ±SD 146.6 ±21.6 143.0 ±21.7 152.4 ±20.3 p < 0.001* DBP [mm Hg], mean ±SD 86.2 ±11.3 84.3 ±10.7 89.2 ±11.7 p < 0.001* Blood glucose [mg/dL], mean ±SD 99.4 ±21.6 99.3 ±21.5 99.7 ±21.7 p > 0.1* Total cholesterol [mmol/L], mean ±SD 5.05 ±1.02 5.1 ±1.0 4.96 ±1.05 p = 0.01** LDL cholesterol [mmol/L], mean ±SD 2.90 ±0.92 2.89 ±0.93 2.92 ±0.92 p = 0.448 ** HDL cholesterol [mmol/L], mean ±SD 1.50 ±0.43 1.60 ±0.41 1.34 ±0.40 p < 0.001* Triglycerides [mmol/L], mean ±SD 1.44 ±0.98 1.36 ±0.84 1.58 ±1.16 p < 0.005*
* Kolmogorov–Smirnov test; ** Mann–Whitney U test; SD – standard deviation; BMI – body mass index; DBP – diastolic blood pressure, SBP – systolic blood pressure, WHR – waist-to-hip ratio; LDL – low-density lipoprotein; HDL – high-density lipoprotein.
Table 4. FTO polymorphism rs9939609 and anthropometric parameters in male group
Characteristics FTO rs9939609 genotype p-value
AA AT TT AA vs TT AA+AT vs TT
Body mass [kg], mean ±SD 86.76 ±14.75 87.82 ±16.52 82.38 ±12.98 p = 0.025** p = 0.0005*** BMI [kg/m2], mean ±SD 28.99 ±4.63 28.99 ±4.52 27.60 ±3.96 0.05 < p < 0.1* p < 0.01*
Waist circumference [cm], mean ±SD 100.80 ±12.91 99.86 ±12.20 95.99 ±10.70 p = 0.004** p = 0.0005*** Hip circumference [cm], mean ±SD 103.33 ±7.70 103.73 ±8.50 101.26 ±7.60 p > 0.1* p < 0.005* WHR, mean ±SD 0.97 ±0.08 0.96 ±0.07 0.94 ±0.07 p > 0.1* 0.05 < p < 0.1*
* Kolmogorov–Smirnov test; ** Student’s t-test; ***Welch’s test; FTO – obesity-associated gene; SD – standard deviation; BMI – body mass index; WHR – waist-to-hip ratio.
Table 3. FTO polymorphism rs9939609 and anthropometric parameters in the whole study group
Characteristic FTO rs9939609 genotype p-value*
AA AT TT AA vs TT AA + AT vs TT
Body mass [kg], mean ±SD 77.65 ±16.26 78.15 ±17.00 75.7 ±14.5 0.1 0.1 BMI [kg/m2], mean ±SD 28.45 ±5.35 28.41 ±5.12 27.80 ±4.84 0.1 0.1
Waist circumference [cm], mean ±SD 92.84 ±14.60 92.59 ±14.10 91.1 ±12.9 0.1 0.1 Hip circumference [cm], mean ±SD 104.55 ±9.99 104.66 ±10.29 103.35 ±9.36 0.1 0.1
WHR, mean ±SD 0.89 ±0.098 0.88 ±0.09 0.88 ±0.09 0.1 0.1
BMI (AA-group and AT-group – 28.99 kg/m2, TT-group
– 27.6 kg/m2, p < 0.01) and were more often diagnosed with
obesity defined with BMI > 30 kg/m2 (37% of AA-group
and 24% of TT-group, p = 0.04). Male A-allele carriers had higher mean waist circumference and WHR and they were more often diagnosed with central obesity than men without risk allele (44% of AA-group and 28% of TT-group had waist circumference over 102 cm, p = 0.02; 88% of AA group and 76% of TT group had WHR > 0.9, p = 0.023). We did not observe any significant associations between
FTO polymorphism and obesity traits in the female group (Table 5). In order to find a possible reason why FTO
polymorphism had a weaker effect on obesity in women, we divided the female group on the basis of menopausal status and age, but this did not significantly influence the results (data not shown).
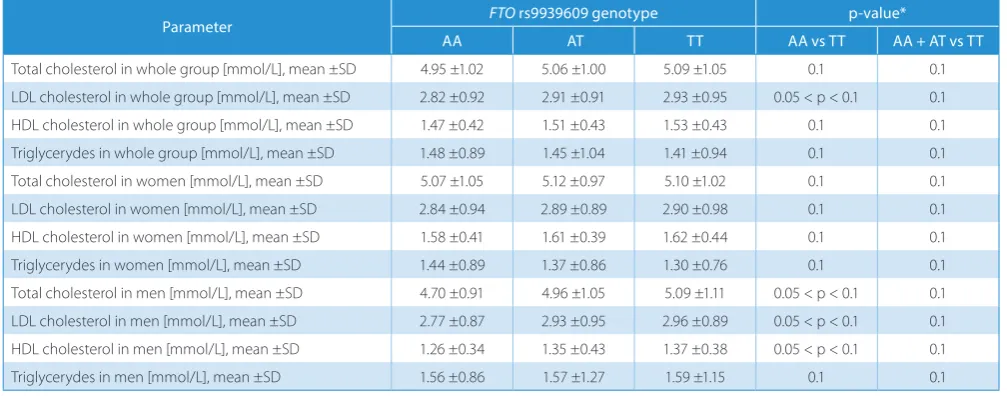
We also analyzed the association between FTO
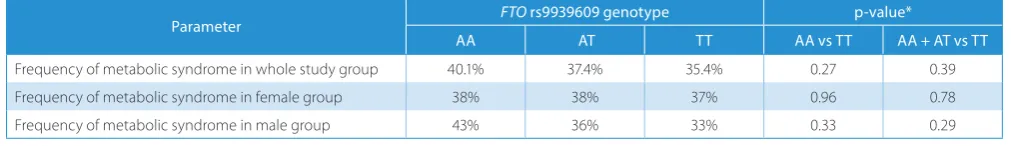
rs9939609 polymorphism and blood pressure measure-ments, lipid and glucose levels in the blood, but there were no significant associations (Tables 6–8). The associations remained insignificant also in separate analyses in men and women. The metabolic syndrome occurred more fre-quently in risk-allele groups, but the associations were statistically insignificant (Table 9).
Table 5. FTO polymorphism rs9939609 and anthropometric parameters in female group
Characteristics FTO rs9939609 genotype p-value*
AA AT TT AA vs TT AA+AT vs TT
Body mass [kg], mean ±SD 72.71 ±14.88 72.07 ±14.30 71.57 ±13.90 p > 0.1 p > 0.1 BMI [kg/m2], mean ±SD 28.17 ±5.69 28.05 ±5.44 27.93 ±5.30 p > 0.1 p > 0.1
Waist circumference [cm], mean ±SD 88.53 ±13.60 88.02 ±13.30 88.04 ±13.30 p > 0.1 p > 0.1 Hip circumference [cm], mean ±SD 105.20 ±11.02 105.25 ±11.25 104.64 ±10.10 p > 0.1 p > 0.1 WHR, mean ±SD 0.84 ±0.07 0.83 ±0.07 0.84 ±0.07 p > 0.1 p > 0.1
* Kolmogorov–Smirnov test; FTO – obesity-associated gene; SD – standard deviation; BMI – body mass index; WHR – waist-to-hip ratio.
Table 6. FTO polymorphism rs9939609 and blood pressure measurements
Parameter FTO rs9939609 genotype p-value
AA AT TT AA vs TT AA + AT vs TT
SBP [mm Hg] – whole group, mean ±SD 145.4 ±20.5 145.7 ±21.4 148.5 ±22.3 0.1* 0.1* DBP [mm Hg] – whole group, mean ±SD 85.3 ±10.4 85.9 ±11.5 87.2 ±11.6 0.1* 0.1* SBP [mm Hg] – men, mean ±SD 152.6 ±17.1 151.2 ±21.0 153.8 ±20.7 0.66** 0.3** DBP [mm Hg] – men, mean ±SD 87.0 ±10.1 89.3 ±11.6 90.4 ±12.5 0.05** 0.16** SBP [mm Hg] – women, mean ±SD 141.5 ±21.2 142.3 ±20.8 145.2 ±22.6 0.1* 0.1* DBP [mm Hg] – women, mean ±SD 84.2 ±10.5 83.7 ±10.9 85.2 ±10.5 0.1* 0.1*
* Kolmogorov–Smirnov test; ** Shapiro–Wilk test; SBP – systolic blood pressure; DBP – diastolic blood pressure.
Table 7. FTO polymorphism rs9939609 and lipid levels
Parameter FTO rs9939609 genotype p-value*
AA AT TT AA vs TT AA + AT vs TT
Total cholesterol in whole group [mmol/L], mean ±SD 4.95 ±1.02 5.06 ±1.00 5.09 ±1.05 0.1 0.1 LDL cholesterol in whole group [mmol/L], mean ±SD 2.82 ±0.92 2.91 ±0.91 2.93 ±0.95 0.05 < p < 0.1 0.1 HDL cholesterol in whole group [mmol/L], mean ±SD 1.47 ±0.42 1.51 ±0.43 1.53 ±0.43 0.1 0.1 Triglycerydes in whole group [mmol/L], mean ±SD 1.48 ±0.89 1.45 ±1.04 1.41 ±0.94 0.1 0.1 Total cholesterol in women [mmol/L], mean ±SD 5.07 ±1.05 5.12 ±0.97 5.10 ±1.02 0.1 0.1 LDL cholesterol in women [mmol/L], mean ±SD 2.84 ±0.94 2.89 ±0.89 2.90 ±0.98 0.1 0.1 HDL cholesterol in women [mmol/L], mean ±SD 1.58 ±0.41 1.61 ±0.39 1.62 ±0.44 0.1 0.1 Triglycerydes in women [mmol/L], mean ±SD 1.44 ±0.89 1.37 ±0.86 1.30 ±0.76 0.1 0.1 Total cholesterol in men [mmol/L], mean ±SD 4.70 ±0.91 4.96 ±1.05 5.09 ±1.11 0.05 < p < 0.1 0.1 LDL cholesterol in men [mmol/L], mean ±SD 2.77 ±0.87 2.93 ±0.95 2.96 ±0.89 0.05 < p < 0.1 0.1 HDL cholesterol in men [mmol/L], mean ±SD 1.26 ±0.34 1.35 ±0.43 1.37 ±0.38 0.05 < p < 0.1 0.1 Triglycerydes in men [mmol/L], mean ±SD 1.56 ±0.86 1.57 ±1.27 1.59 ±1.15 0.1 0.1
Discussion
The frequency of obesity-risk A-allele in our group was 0.44, which remained in accordance to that of other Europe-an populations.3,25 The analyzed FTO SNP rs9939609 had,
together with rs1558902, rs1421085, rs9930506, and rs12149832, the strongest influence on obesity phenotype in the recent association study in Polish population. These SNPs are located in intron 1 and stay in almost complete linkage disequilibrium (LD) (|D’| > 0.98, r2 > 0.80).26
Many studies confirmed that the FTO gene variation predisposes to excessive weight. This association varies significantly in different ethnic groups.2–5 Nonetheless,
it remains the strongest genetic determinant of common obesity known so far, with an estimated population risk of 22%.2 In this context, we have confirmed such
an as-sociation in the male population of Lower Silesia in Po-land. However, our most interesting result is the signifi-cant difference in the influence of FTO polymorphism on obesity traits between men and women in our cohort. Male A-allele carriers had higher mean BMI, waist cir-cumference and WHR, and were more often diagnosed with obesity on the basis of all those criteria than men without genetic risk factor. We did not observe such as-sociations in the female group. Sex-dependent contribution of FTO gene on obesity is a novel finding. To our knowl-edge, there are only 2 previous studies, 1 in the Polish and 1 in the Mexican population, where sex-specific differences have been shown. Sobalska-Kwapis et al. demonstrated a strong association of FTO intronicvariants in block 8 with overweight in a group of men only; however, this sex difference was no longer valid in the case of obesity. When authors considered obesity and overweight groups together, there were only 8 statistically significant SNPs in women comparing with 27 SNPs in men. It has been also revealed in this study that obesity-associated SNPs had a different inheritance model in men (recessive) than
in women (dominant).26 In the Mexican population,
Salda-ña-Alvarez et al. have shown, in turn, that 2 FTO SNPs were specifically associated in men under a dominant model, while 3 were associated with women under addi-tive and recessive models.31 Together with our results, this
highlights the need to consider sex as an important factor modulating FTO genetic association with overweight and obesity. The outcomes of our study and the one of and Sobalska-Kwapis et al. suggest that in Polish women, obe-sity is less influenced by FTO polymorphism than in men.26
To further explore this problem, we analyzed the FTO in-fluence on obesity in female subgroups according to meno-pausal status and age, but it did not change our results. There are suggestions that the association between FTO gene and obesity is age-dependent.32 We also know that many other
factors (socioeconomic, cultural, environmental, psycholog-ical) play an important role in such a complex trait as body mass. In our other publication, we presented a list of impor-tant environmental determinants of obesity in the popula-tion of PURE study in Poland.33 Some of those factors (like
rural inhabitancy, unemployment and stress) had a greater impact on body mass than FTO polymorphism, particularly in women. We can presume that environmental factors play a more important role in the pathogenesis of female obesity in our study, which blurs the role of FTO gene. Moreover, other regions in genome may regulate overweight/obesity in a sex-dependent manner. It has been shown that FTO
sequences are functionally connected with other genes, for example homeobox gene IRX.34 Landgraf et al. reported that FTO variants affected adipocyte-specific expression of IRX5
and IRX3.35 There are more studies needed in this area with
a distinction between men and women.
To our knowledge, this is the most representative Polish study, in which participants were examined for FTO poly-morphism and metabolic syndrome components. Previous studies in Poland suggested that the variation in the FTO
gene was related to some metabolic disturbances indicative
Table 8. FTO polymorphism rs9939609 and glucose level
Parameter FTO rs9939609 genotype p-value*
AA AT TT AA vs TT AA + AT vs TT
Glucose level in whole study group [mg/dL], mean ±SD 101.7 ±31.4 99.4 ±19.5 98.3 ±16.8 0.1 0.1 Glucose level in women [mg/dL], mean ±SD 100.5 ±27.5 99.5 ±21.0 98.2 ±17.6 0.1 0.1 Glucose level in men [mg/dL], mean ±SD 104.0 ±37.5 99.2 ±16.0 98.5 ±15.5 0.1 0.1
* Kolmogorov–Smirnov test; SD – standard deviation.
Table 9. The occurrence of metabolic syndrome in study group according to FTO polymorphism rs9939609
Parameter FTO rs9939609 genotype p-value*
AA AT TT AA vs TT AA + AT vs TT
Frequency of metabolic syndrome in whole study group 40.1% 37.4% 35.4% 0.27 0.39 Frequency of metabolic syndrome in female group 38% 38% 37% 0.96 0.78 Frequency of metabolic syndrome in male group 43% 36% 33% 0.33 0.29
of insulin resistance. For example, Łuczyński et al. have shown that children with AA genotype rs9939609 had higher values of blood pressure (systolic blood pressure (SBP) and diastolic blood pressure (DBP)), triglycerides, fasting insulin, and homeostatic model assessment – insu-lin resistance (HOMA-IR) index, although only the latter was not attenuated after adjusting for BMI.36 In another
Polish study consisting of women with PCOS, there was an association between the occurrence of risk allele and lower insulin sensitivity, but it was mediated by adiposity.29
The recent analysis of 425 women from West Pomera-nian voivodeship revealed that AA homozygotes of FTO
rs9939609 presented a higher risk of fasting hyperglyce-mia than those with at least 1 T allele, but no associations were found in the case of lipids, blood pressure or waist size.27 In a study concerning other FTO polymorphism
– rs9930506 in 442 Polish adults, there was no link be-tween this genetic variation and lipid disturbances or high-er fasting glucose level.13 Recently, Ślęzak et al. presented
a study where FTO gene variation was related to single metabolic disturbances in a homogenous male group, but the risk of metabolic syndrome was not increased in risk allele carriers.37 In our analysis, we have found no
asso-ciation between carrying FTO rs9939609 risk allele and the onset of metabolic syndrome or its components in men and women from Lower Silesia.
In the context of mentioned studies, we can presume that the FTO influence on metabolic disturbances in Polish population is secondary to its influence on adiposity. Be-cause the link with obesity was not very strong in our group, the association with metabolic syndrome components could not be revealed. Many studies in other countries also suggest that FTO gene variation modifies metabolic dis-turbances only indirectly through adiposity. For example, the analyses of very big European populations by Frayling et al. and Freathy et al. supported this thesis.3,8 However,
there are also studies showing that the influence of FTO
variation on diabetes onset, age at diagnosis or even diabe-tes-related complications did not disappear after BMI ad-justment.38–40 The latter work was performed in the Czech
population, which is genetically similar to Poles.
The association between FTO gene and metabolic traits may be explained in different ways. First, it can be only an effect of adiposity. Our results support this thesis – if the influence on obesity is weak, there are consequently no associations with metabolic traits. However, the men-tioned works showing that diabetes-related complications are associated with FTO independently of BMI may sug-gest other mechanism of FTO gene action on metabolism. The expression in different tissues and regulatory role of FTO gene (FTO protein is a nucleic acid demethylase) allows it to be involved in pathogenesis of different distur-bances. More studies are needed to explain the exact role of FTO gene in metabolism.
There were a few limitations of our study. Firstly, our re-sults come from cross-sectional analysis, while longitudinal
study is more suitable to draw conclusions about obesity and its complications. However, there is an ongoing ob-servation of our cohort and we plan to analyze results of the follow-up after a few years. Secondly, our cohort is not strictly population-based, with some possible snow-ball sampling biases (according to the PURE study de-sign, people were allowed to register themselves volun-tarily in selected urban and rural districts). In other Polish studied, minor allele frequency (MAF) of FTO rs9939609 were higher (Łuczyński et al.36 – 0.49, Sobalska-Kwapis
et al.26 – 0.69). This may be the reason why the associations
between FTO risk allele and obesity traits were weaker in our cohort than in other studies. Another important factor is that our cohort was older than in most Polish studies and we know that in the older age genetic influence on obesity is blurred by environmental factors. Neverthe-less, our results stay in accordance with other studies from Poland and Europe and we were able to detect sex-specific difference of FTO influence on obesity, which is a novel and interesting finding. More studies in this area are needed.
ORCID iDs
Aleksandra Zdrojowy-Wełna https://orcid.org/0000-0001-5640-1928 Grażyna Bednarek-Tupikowska https://orcid.org/0000-0002-8891-6202 Katarzyna Zatońska https://orcid.org/0000-0002-3772-5588
Katarzyna Kolačkov https://orcid.org/0000-0003-4570-0054 Alicja Jokiel-Rokita https://orcid.org/0000-0002-9552-6712 Marek Bolanowski https://orcid.org/0000-0003-4645-967X
References
1. Lim SS, Vos T, Flaxman AD, et al. A comparative risk assessment of bur-den of disease and injury attributable to 67 risk factors and risk factor clusters in 21 regions, 1990–2010: A systematic analysis for the Global Burden of Disease Study 2010. Lancet. 2012;380(9859):2224–2260. 2. Dina C, Meyre D, Gallina S, et al. Variation in FTO contributes
to child-hood obesity and severe adult obesity. Nat Genet. 2007;39(6):724– 726.
3. Frayling TM, Timpson NJ, Weedon MN, et al. A common variant in the FTO gene is associated with body mass index and predisposes to childhood and adult obesity. Science. 2007;316(5826):889–894. 4. Chang Y-C, Liu P-H, Lee W-J, et al. Common variation in the fat mass
and obesity-associated (FTO) gene confers risk of obesity and modu-lates BMI in the Chinese population. Diabetes. 2008;57(8):2245–2252. 5. Adeyemo A, Chen G, Zhou J, et al. FTO genetic variation and associa-tion with obesity in West Africans and African Americans. Diabetes. 2010;59(6):1549–1554.
6. Ohashi J, Naka I, Kimura R, et al. FTO polymorphisms in oceanic pop-ulations. J Hum Genet. 2007;52(12):1031–1035.
7. Li H, Wu Y, Loos RJF, et al. Variants in the fat mass and obesity-asso-ciated (FTO) gene are not associated with obesity in a Chinese Han population. Diabetes. 2008;57(1):264–268.
8. Freathy RM, Timpson NJ, Lawlor DA, et al. Common variation in the
FTO gene alters diabetes-related metabolic traits to the extent expected given its effect on BMI. Diabetes. 2008;57(5):1419–1426. 9. Hakanen M, Raitakari OT, Lehtimäki T, et al. FTO genotype
is asso-ciated with body mass index after the age of seven years but not with energy intake or leisure-time physical activity. J Clin Endocrinol
Metab. 2009;94(4):1281–1287.
10. Shimaoka I, Kamide K, Ohishi M, et al. Association of gene polymor-phism of the fat-mass and obesity-associated gene with insulin resis-tance in Japanese. Hypertens Res. 2010;33(3):214–218.
12. Song Y, You N, Hsu Y-H, et al. FTO polymorphisms are associated with obesity but not diabetes risk in postmenopausal women. Obe-sity (Silver Spring). 2008;16(11):2472–2480.
13. Wrzosek M, Zakrzewska A, Ruczko L, Jabłonowska-Lietz B, Nowicka G. Association between rs9930506 polymorphism of the fat mass and obesity-associated (FTO) gene and onset of obesity in Polish adults.
Indian J Med Res. 2016;143(3):281–287.
14. Gerken T, Girard CA, Tung Y-CL, et al. The obesity-associated FTO gene encodes a 2-oxoglutarate-dependent nucleic acid demethylase.
Science. 2007;318(5855):1469–1472.
15. Jia G, Fu Y, Zhao X, et al. N6-methyladenosine in nuclear RNA is a major substrate of the obesity-associated FTO. Nat Chem Biol. 2011; 7(12):885–887.
16. Dominissini D, Moshitch-Moshkovitz S, Schwartz S, et al. Topology of the human and mouse m6A RNA methylomes revealed by m6A-seq. Nature. 2012;485(7397):201–206.
17. Zhao X, Yang Y, Sun B-F, et al. FTO-dependent demethylation of N6-methyl adenosine regulates mRNA splicing and is required for adipogenesis. Cell Res. 2014;24(12):1403–1419.
18. Melhorn SJ, Askren MK, Chung WK, et al. FTO genotype impacts food intake and corticolimbic activation. Am J Clin Nutr. 2018;107(2):145–154. 19. Karra E, O’Daly OG, Choudhury AI, et al. A link between FTO, ghrelin, and impaired brain food-cue responsivity. J Clin Invest. 2013;123(8): 3539–3551.
20. Cecil JE, Tavendale R, Watt P, Hetherington MM, Palmer CN. An obe-sity-associated FTO gene variant and increased energy intake in chil-dren. N Engl J Med. 2008;359(24):2558–2566.
21. Kühn AB, Feis D-L, Schilbach L, et al. FTO gene variant modulates the neural correlates of visual food perception. Neuroimage. 2016; 128:21–31.
22. Merkestein M, Laber S, McMurray F, et al. FTO influences adipogen-esis by regulating mitotic clonal expansion. Nat Commun. 2015;6: 6792–6801.
23. Wahlen K, Wåhlén K, Sjölin E. The common rs9939609 gene variant of the fat mass- and obesity-associated gene FTO is related to fat cell lipolysis. J Lipid Res. 2008;49(6):607–611.
24. Claussnitzer M, Dankel SN, Kim K-H, et al. FTO obesity variant circuit-ry and adipocyte browning in humans. N Engl J Med. 2015;373(10): 895–907.
25. Peng S, Zhu Y, Xu F, Ren X, Li X, Lai M. FTO gene polymorphisms and obesity risk: A meta-analysis. BMC Med. 2011;9:71–86.
26. Sobalska-Kwapis M, Suchanecka A, Słomka M, Siewierska-Górska A, Kępka E, Strapagiel D. Genetic association of FTO/IRX region with obesity and overweight in the Polish population. PLoS One. 2017; 12(6):e0180295. https://doi.org/10.1371/journal.pone.0180295 27. Szkup M, Owczarek AJ, Schneider-Matyka D, Brodowski J, Łój B,
Grochans E. Associations between the components of metabolic syndrome and the polymorphisms in the peroxisome proliferator-activated receptor gamma (PPAR-γ), the fat mass and obesity-asso-ciated (FTO), and the melanocortin-4 receptor (MC4R) genes. Aging
(Albany NY). 2018;10(1):72–82.
28. Łuczyński W, Fendler W, Ramatowska A, et al. Polymorphism of the
FTO gene influences body weight in children with type 1 diabetes without severe obesity. Int J Endocrinol. 2014;2014:630712. 29. Kowalska I, Malecki MT, Straczkowski M, et al. The FTO gene
modi-fies weight, fat mass and insulin sensitivity in women with polycys-tic ovary syndrome, where its role may be larger than in other phe-notypes. Diabetes Metab. 2009;35(4):328–331.
30. Teo K, Chow CK, Vaz M, Rangarajan S, Yusuf S; PURE Investigators-Writing Group. The Prospective Urban Rural Epidemiology (PURE) study: Examining the impact of societal influences on chronic non-communicable diseases in low-, middle-, and high-income countries.
Am Heart J. 2009;158(1):1–7.
31. Saldaña-Alvarez Y, Salas-Martínez MG, García-Ortiz H, et al. Gen-der-dependent association of FTO polymorphisms with body mass index in Mexicans. PLoS One. 2016;11(1):e0145984. doi:10.1371/journal. pone.0145984
32. Jess T, Zimmermann E, Kring SII, et al. Impact on weight dynamics and general growth of the common FTO rs9939609: A longitudinal Danish cohort study. Int J Obes (Lond). 2008;32(9):1388–1394. 33. Zdrojowy-Wełna A, Zatońska K, Bednarek-Tupikowska G, et al.
Deter-minants of obesity in population of PURE study from Lower Silesia.
Endokrynol Pol. 2018;69(6):644–652. doi:10.5603/EP.a2018.0061
34. Smemo S, Tena JJ, Kim K-H, et al. Obesity-associated variants with-in FTO form long-range functional connections with IRX3. Nature. 2014;507(7492):371–375.
35. Landgraf K, Scholz M, Kovacs P, Kiess W, Körner A. FTO obesity risk variants are linked to adipocyte IRX3 expression and BMI of children: Relevance of FTO variants to defend body weight in lean children?
PLoS One. 2016;11(8):e0161739. doi:10.1371/journal.pone.0161739
36. Łuczyński W, Zalewski G, Bossowski A. The association of the FTO
rs9939609 polymorphism with obesity and metabolic risk factors for cardiovascular diseases in Polish children. J Physiol Pharmacol. 2012;63(3):241–248.
37. Ślęzak R, Leszczyński P, Warzecha M, Łaczmański L, Misiak B. Assess-ment of the FTO gene polymorphisms in male patients with meta-bolic syndrome. Adv Clin Exp Med. 2018;27(11):1581–1585.
38. Legry V, Cottel D, Ferrières J, et al. Effect of an FTO polymorphism on fat mass, obesity, and type 2 diabetes mellitus in the French MONICA study. Metabolism. 2009;58(7):971–975.
39. Kalnina I, Zaharenko L, Vaivade I, et al. Polymorphisms in FTO and near TMEM18 associate with type 2 diabetes and predispose to younger age at diagnosis of diabetes. Gene. 2013;527(2):462–468. 40. Hubacek JA, Dlouha D, Klementova M, Lanska V, Neskudla T, Pelikanova T.