This paper provides a broad overview of the use of plant material as a source of usable energy. The problem ofgath-ering and interpreting data on the use of biomass is discussed. Fromthelimited data available it is inferredthat bioenergy contributes about15%of the global energy bud-get. The paper deals with a variety ofother major topics: the role ofbiomass in the energy system, differences in that role in industrialized and developing countries, conversion tech-nologies, environmental considerations and themultiple uses of biomass (food for people,
feed
for animals and fibre for construction material and other uses as well as energy sources). The ability of the biosphere to provide adequate amounts ofprimary energyislimited, especially ifforecasts of population growth, and associated increases in the de-mand for food, feed and fibre, turn out to be accurate.Byimproving the efficiency ofbioenergy use, whichiscurrently very low,itshould be possible to deliver more tertiary energy for the same primary energy input.
eet article offre une vue d'ensemble de l'utilisation de mafiriaux vegetaux comme source d'inergieutilisable.On
ydiscute Ies problemes poses parIerecueiletl'interpretation des donnees. A partir des informations disponibles, il apparaitrait quelabioenergie contrwue
a
environ15%du budget de l'tnergie globale. L'article traite un variite d'aufres sujets majeurs: Ie role de La biomassedans Ie systemed'energie, Ies diffirences dans ce role entre les pays industrialists et les pays en voie de developpement, les techniques de conversion, les considerations d'ordre en-vironnemental et les emplois multiples de la biomasse (alimentation pour les humains,[ourrage pour les animaux et fibre pour les materiaux de construction ainsi que d'autre usages en plus des sources d'bzergie). Lacapacite de la biosphere de produire une quantill! suffisante d'energie primaireest limitie, surtout si les previsions de la croissance de la population, et des augmentations relatives dans la demande de nourriture, de [ourrage etdefibre s'aver-ent exaetes. En ameliorant l'efficacite de l'utilisation de la bioenergie, qui est actuellement tres laible, ildevrait etre possible de degager plus d'energie tertiaire par rapporta
la meme puissance d'energie primaire.Dr.R.P. Overend is a Senior Scientist with the Division of Biological Sciences, National Research Council of Canada, Ottawa.
Biomass for Energy
R. P. OVEREND
NRCC#30174
B
iomass, or more correctly phytomass, the plant material generated from solar energy by means of photosynthesis, is the most impor-tantof the renewable energy fonns in terms of its current and projected consumption on a world scale. In fact, it ranks fourth in importance as an energy source with only oil, coal and gas contrib-uting more energy to the world. Unlike the fossil fuels, biomass is bulky and has a fraction of the energy content of these fuels on a mass and volume basis. Its use is therefore based on re-gional considera tions since it cannot be economically transported much more than 200 km. Biomass for energy is grown on land, land which may be needed for food or fibre produc-tion, and this results in competition for land and water between foodstuffs, fibre and fuel produc-tion. Photosynthesis does not store a large fraction of the solar input. Instantaneous effi-ciencies of energy capture into biomass have been measured at 6-8%. On a seasonal basis, an efficient tropical crop such as sugar cane may reach 2% efficiency in storing sunlightifno other growth factors are limiting. The boreal forest in contrast, may be capable of fixing only a fraction of one percent of the incident solar energy into biomass over its 60-80 year harvest cycle.1970senergycrises. These studieshave been con-ducted within the scope of two distinct economic and geographical models: the first based on de-velopment in the Third World, the second based on oil substitution in the industrialized econo-mies. In spite of this distinction, statistics show that per capita consumption ofbioenergy in both the developing and industrialized world is equivalent to between 0.5 and 1 tonne of woodfuel per annum (t/a), though, as will be discussed, the mode and efficiency of use vastly differs between the two areas. The bioenergy use systems are inherently different because in de-veloping countries the application occurs pre-dominantly in rural settings while in developed countries it is in the industrial and urban milieu. This distinction is now blurring because the Third World is following a path towards increas-ing industrialization, with an associated acceler-ation of urbanizacceler-ation.
Bioenergy Use Statistics
Use of biomass for energy often occurs in circum-stances which do not permit accurate measure-ment of consumption. In industrialized countries most consumption is in the raw mate-rials sector where, for example, process residues in the pulp and paper industry are used as fuel for the process itself. Such internal transfers of captive residues rarely lead to accurate account-ing. In much of the Third World, especially in rural areas, biomass fuel is harvested at the cost of human labour and records of the type and quantity of fuel used are not kept. As I will discuss below, the current contribution of bioenergy to the global energy budget is esti-mated at about 15%. The quality of this estimate is important in terms of assessing the impact of shifts from traditional to commercial fuels and in establishing the extent of unfilled demand, since in reality there are no energy shortages but rather shortfalls that are reflected in poor nutrition or reduced performance of agriculture or industry. The problem of energy demand analysis in countries that have large traditional fuels sectors has been addressed by Bhatia (1987) as part of the activities of the Energy Research Group of
lORe. The methodology required has to be based on survey activity at the micro level, which is then accumulated for a region and eventually summed on a country basis. Checks on this can be performed at the macro level using other knowledge of crop and forest production and animal stock data. Such surveys are time-consuming and must be carried out over sev-eral seasons in order to satisfactorily reflect real use. The earliest survey data for biomass was based on the use of fuel wood and was the basis of Eckholm's now-famous declaration of a fuel-wood crisis (Eckholm, 1976). As a result of this, a major effort on data gathering for fuel wood consumption was undertaken by the FAO. This survey was primarily based on data from for-estry departments and identified wood usage as amounting to only about 1 Gt or 15 EJ (WRI, 1986).
The problem with this viewpoint ofbioenergy use is that it neglects entirely the use of plant residues, dung, bioethanol and biogas. The data for India are a salutary correction; it is reckoned that dung and plant residues add another 100% to firewood consumption (CSE, 1982; WEC, 1986). Further corroboration of this is given by Reddy and Ravindranath (1987) who tabulate the importance of dung cake and agrowaste rel-ative to firewood in several village economies. A comparison (Overend, 1986) of FAO fuelwood data for Latin America with the OLADE user survey data for bioenergy use, again showed discrepancies of almost 100% for many coun-tries. A final disposition would be to assume that for the developing world, in agriculture and for-est based economies the usage of biomass in general is about 1 t/a per person. In Brazil, de-spite its high degree of urbanization (72% as against the average for Latin America of 65.3% (WRI, 1986», utilization of biomass is 0.95 t/a per person (Goldemberget aI,1988). This sterns partly from the very large role that charcoal man-ufactured from wood plantations plays in steel manufacture. Even for China, Wu and Chen (1983) have provided data to suggest that 800 million rural Chinese utilize about 1
tl
a per person of fuelwood equivalent.• Industrialized
~ Developing
Exa-JouJes
Figure 1: World Energy Sources: Developing and Industrial Countries
0:oil;C:coal; G: gas; B: bioenergy; H: hydroelectricity;
N: nuclear. Hydroelectricity at 10.8 MJ/kWh.
resolution required to make an estimate of bio-mass fuel usage has recently been given by Wijesinghe (1988) for the island of Sri Lanka. This small tropical island (65,610 km') with a population of 15.6 million has a primary energy input of 71% biomass. Of these 9 Mtofbiomass, 7.9 Mt are used by households. Fuelwood (see below) constitutes 72%, while agricultural wastes amount to 28% of the total biomass used. The majority of agricultural wastes used come from coconut plantations. The fuel wood compo-nent includes rubber wood, which is a by-product of the management of rubber plantations and comprises 18% of the total bioenergy contribution. Of the remaining fuel-wood less than half comes from the forest, the majority is gathered from waste and scrub land. David Hall (1988), using data from several sources (CSE, 1982; WEe, 1986; WRI, 1986; lEA, 1987; WCED, 1987; BP, 1988), has generated a table of world energy use incorporating as far as possible the revised data on biomass contribu-tions. In developing this data set, the biomass data were estimated from the available survey data. While less accurate than data on fossil fuel use, the global value is probably reliable to within 25%. The data from this table have been summarized in Figure 1 and are classified ac-cording to developing and industrialized coun-tries.
The Biomass and Energy Framework
In the Third World approximately 35% of the primary energy supply is derived from biomass and over 2 billion people are almost totally reli-ant on this source for their energy needs. As a measure of the importance of bioenergy, it is interesting to note that if kerosene were to re-place all biofuels, the world oil demand would increase by 20%. It is dangerous to generalize about the nature ofThird World energy use since each country has its own infrastructure in terms of biomass resource base and the energy de-mands of the urban, rural, industrial and domes-tic sectors. However, on the basis of a number of studies it is possible to provide some ranges of the contribution of bioenergy in each sector of the economy: approximately 50-80% is used in domestic applications, predominantly for food preparation; 10-20% is used in the commercial sector such as bakeries, restaurants and in pre-cooked food preparation; industrial uses such as crop drying (tea, coffee and tobacco), brick, tile, charcoal production and lime manufacture rep-resent 5-40%. Itshould be noted that these are almost all applications of solid fuel combustion in size ranges of 5, 20 and 100 kW for domestic, commercial and industrial applications respec-tively. In industrialized and urbanized coun-tries, the use of bioenergy has become concentrated in industries (e.g., foodstuffs, fod-der and fibre) in which residual biomass from a production process is used as the primary fuel for the process. In the northern hemisphere, the USA, USSR, Scandinavia and Canada all have major energy contributions from their pulp and paper industries through the use of wood resi-dues and pulping liquors. Canadian bioenergy use (representing 7% of the total energy econ-omy) is distributed as follows: 63% in the pulp and paper sector, 32% as domestic woodfuel, and 5% in the sawmill sector. Usage proportions in the industrial and domestic sectorare inverted in comparison with the Third World and are accompanied by a dramatic increase in scale of combustors. The size range is from 1 to 300 MW in industry and 50-100 kW in domestic space heating.
"'"
'"
'"
,
In the chain from the resource to the energy service required by the consumer, there are sev-eral distinct stages: cultivation, harvest, fuel dis-tribution, conversion and delivery of energy. The primary energy (P) harvested is not all de-livered to the consumer. Some is lost during conversion to a secondary fonn (S) and there are further losses in distribution and conversion to heat, power or light delivered at the tertiary level (T). Each transformation has an efficiency which can be defined as the ratio of energy input to the output for that stage. For woodfuel in Canada and Kenya, the ratios ofSIPare 95% and 71 %, and ofTIS48% and 19% in Canada and Kenya respectively. Clearly, the use of bioenergy in the developing country is significantly less efficient. The existence of a large charcoal industry in Kenya explains the low value ofSIP,whereas in Canada almost all of the woodfuel use is direct to end use. Even in the end use application the efficiency of industrial burners is at least 2-3 times better than the domestic stoves which burn the majority of fuel in Kenya.
FuelwoodfWoodfuel
Taking woodfuel to mean both fuel wood and charcoal, it is possible after almost two decades of research and the gathering of statistics, to see that the situation is complex and verydependent on whether, for example, you are in the Sahel or the Punjab. Where population density is low, woodfuel needs are easily met without affecting the standing stock of trees. Woodfuel supplies are nonnally drawn by women and children for a modest investment of time and effort. The land used varies; sometimes the wood lot belongs to the family, elsewhere there may be legal or customary use of national forests, while in other places waste land and roadsides or neighbour's land may all be used. Most often dead wood is utilized; it is lighter, burns better and is easier to cut than live wood. Increasing population den-sity initially increases the radius ofcollection and the concomitant cost in terms of the labour of women and children. Nevertheless, the system can remain in balance. Eventually the walking distance becomes unreasonable and then
in-creasing demand is placed on a limited area. Dead wood is no longer enough. Live trees are felled, all available twigs and other fallen mate-rials are utilized and the forest is lost. The im-pacts depend upon the land holding pattern. The poorand landless are left with the denuded com-mons while the land holders may still be quite well supplied. This phase frequently leads to commercialization of the woodfuel system, par-ticularly if the population growth is accompa-nied by urbanization. The effects of this can be both positive and negative. Purchasers of woodfuel are more frugal in its use and may invest in improved stoves or even undertake fuel substitution to LPG and kerosene for some of their activities. Wood production may be stimu-lated and trees planted. On the debit side the poor will be encouraged to cut trees (poaching) for a cash income and the urban demand thus accelerates loss of the forest. Urban demands must be distinguished from local rural demand if appropriate solutions to a shortage are to be found. While industrial demand is frequently only a fraction of the total woodfuel demand, it too can have enonnous local impacts. Baking, brickmaking, salt and lime manufacture, use 0.5 to 2.0 t woodfuel/t product, while consumption in crop drying ranges from 5 to 50 tit. Tradi-tional drying barns in Malawi use as much as 48 t woodfuel/t tobacco leaf produced. Or more dramatically, one hectare of tobacco requires 42 ha of forest to dry the leaves. Modern kilns (Bar-nard, 1987) should be able to reduce the demand to around 5 tit which is still four times the theoretical requirement.
Conversion Technology
and charcoal production are the most important transformations to secondary energy forms. Bio-technological conversions to biogas and ethanol are in existence but as yet are relatively minor in relation to thermochemical conversions. The large scale state-subsidized ethanol programs in the USA (maize) and Brazil (sugar cane) are clear demonstrations that significant quantities of liq-uid fuels can be obtained from biomass while also demonstrating that such a policy can aid in regulating agricultural production.
The Supply of Biomass
Whether for food, feed or fuel, the major part of the biomass used is drawn from the land. The fraction of the world's surface composed of land is only 29% (14,900 Mha), only 13,170 Mha (10' hal is ice free, and of this almost 50% is neither arable nor grazeable. With a current world pop-ulation of 5 billion people this provides only 1.3 ha to support each person in almost all of their food requirements. Thus, one concern that has existed since Malthus is the carrying capacity of the land for a growing population. Population growth is one of the driving forces that increase pressure on the environment and force the de-velopment of new lands and technologies in bio-mass. A glance at the newspapers shows that the question of world biomass supply is quite com-plex. In North America and Europe one reads of concerns about agricultural surpluses that have led to complex subsidy regimes for farmers growing wheat or other foodstuffs, in order to maintain farmer income at a time of considerable overproduction. Policies currently being devel-oped in the OECD nations (Organization for Economic Cooperation and Development) to re-duce these surplUses include taking land out of productive use. Elsewhere in the same newspa-per one can read of famine and malnutrition in Africa's Sahel region, where climate has reduced the productive capacity of the land to such an extent that large populations are migrating to other regions. Fortunately, one thing that has ameliorated this disturbingfeast and famine dis-parity between regions has been the large in-crease in aid and food exports from producing
regions to consumers. Since the Second World War the tonnage of food traded internationally has increased by more than a factor of 5. At least 10% of the World's cereal production is traded internationally, most of it from North America. AnFAO study: "Potential population support-ing capacities of lands in the developsupport-ing world" (FAa, 1983a), has examined the carrying capac-ity question in detail and concluded that with increasing technological inputs the world as a whole has the capacity to feed the anticipated population of 6.1 billion in about the year 2000. Such a global view, however, conceals large re-gional disparities. In 1975 it was reckoned that 55 of the world's 117 developing countries were in a state of crisis in that they could not satisfy their own food demands; by 2000 this number is projected to be 64, and would include the entire Southwest Asian region.
The Magnitudes of Biomass Use
The biosphere provides not only food and feed, but also furnishes construction materials and energy. Quantitatively, the mass of the biosphere used in non-food pursuits is probably greater than that used for food production. Man's im-pact on the biosphere in terms of food, feed, fibre and fuel withdrawals probably amounts to about 5-6 Pg/a (1015g/annum) or 4-5% of the primary productivity (estimated to be of the order of 130 Pg/a). However, man's impact on the biosphere is much greater than a simple ad-dition of food, feed, fibre and bioenergy would suggest. At any given moment: land is being set aside; forests are cleared by slash and burn agri-culture; and land is lost to desertification, salina-tion, urbanization and energy projects. Other productive capacities of the land base are being affected by both local pollution and that depos-ited by long range transport such as acid rain in North America and Europe Nitouseket
ai,
1986).Itis useful to generate an order of magnitude estimate of the size of the biomass withdrawals and their use in order to guide the later discus-sion. The units that I will use are giga tonnes(Gt).
B10energy 3,5
Fibre
250
Qualltity
IGt
The ever present driving force for development is population growth.Itplaces increasing bur-dens on the sustainable yield of the biosphere year after year, and already it is evident that in some instances the effect of human pressure has led to loss of ecosystems. Theeffectofpopulation change on resource demand is difficult to proj-ect. The simplest model would be to assume that present per capita consumption will be main-tained. There are dangers in this approach since it is evident that for much of the Third World the current resource consumption rate is already much lower than required and, as will be seen, the growth rate in the less developed part of the world is considerably greater than in industrial-ized countries.
Population
and in terms of added value and substitution potential, could probably be better utilized else-where.
Food( Vegetable)
400
Meat
250
Value/G$
Population StatisticsFigure2: Biomass Utilization: Quantity And Price
of all crops. From FAO statistics it is possible to estimate that the food system generates about 2 Gt of food stuff and 2.5 Gt of associated residues such as straw and stover. About 0.5 Gt of indus-trial wood are used annually, approximately 50% for paper and board products. The indus-trial wood harvest generates about the same quantities of both forest and process residues. Direct fuel wood withdrawals are in the order of 0.5 Gt. The total of all of these is about 6 Gt, with residues and woodfuel totalling 3.5 Gt. The quantities and their values are summarized in Figure 2.
Bioenergy clearly ranks first in quantity, but last in terms of consumer price. Although these numbers are order of magnitude estimates, they highlight a large area of opportunity in the use of wastes and residues associated with the eco-nomically essential areas of food and fi-bres/solid products. Currently much of this is used in low efficiency bioenergy applications
In 1986 it was estimated that world population had surpassed 5 billion people. From 1950 to 1986 the population of the developed world (Eu-rope, North America, Australia, New Zealand, Japan and the USSR) grew from 0.8 to 1.2 billion (an annual growth rate of 1.6%). The Third World (Africa, Asia, Latin America and Oceania) grew from 1.7 to 3.8 billion (3.1 %/a). The United Nations projection to 2000 (UN, 1985) shows the total world population estimate at 6.1 billion, with the developed countries total having in-creased at a rate of 1.2 %/a to about 1.3 billion and that of the developing countries at 2.4 %/a to 4.8 billion. Such a global perspective conceals countries such as Sweden which are in negative growth and those undergoing explosive growth such as Kenya with a current growth rate of 4.1 %/a.
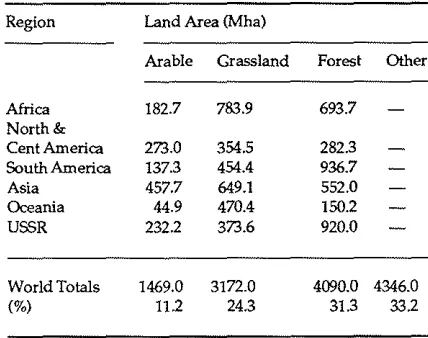
Table 1: Global DistributionOfLand CategoriesByRegion
Africa 182.7 783.9 693.7
North&
Cent America 273.0 354.5 282.3
South America 137.3 454.4 936.7
Asia 457.7 649.1 552.0
Oceania 44.9 470.4 150.2
USSR 232.2 373.6 920.0
World Totals 1469.0 3172.0 4090.0 4346.0
(%) 11.2 24.3 31.3 33.2
last five decades from 1.5 to 2.5 billion; according to El-Shakhs (983), the increase to the year 2000 is forecast to be only another 0.5 billion.Itcan thereby be assumed that one out of every two additional people in the Third World will be an urban dweller. These population trends indicate that transportation of food and energy will in-creasingly be required even in countries with large productive land capacities per capita.Ifthe population is predominantly urban it will not be possible to use biomass forfood, feed and energy in the same way as in a predominantly rural society.
Land for Food, Feed and Fibre
Region Land Area (Mha)
Arable Grassland Forest Other
The population of 6.1 billion forecast for the year 2000 could easily have enough food, feed and fibre. In fact the theory has been advanced that, under ideal conditions of adequate fertilizer and water inputs along with a global transportation network for foodstuffs, the forecast stabilized world population of 11 billion in the year 2100 could also be fed. These dreams are not reflected in the cold facts of today; a World Bank study (WB, 1985) identified 87 developing countries in which the proportion of the population lacking sufficient calories to have an active working life was anywhere between 10 and 50 percent, with an average of34percent. Sixteen per cent were at a caloric intake level less than 80% of the FAa/WHO minima, a level known to stunt growth and to pose serious health risks.
Land Usage
Global land use (FAa, 1983b) is shown in the table below. Total land area including rivers and freshwater lakes is 13,400 Mha. The term "Other" includes ice caps, deserts and moun-tains.Itis important to consider where the dif-ferent types of land are situated, as is shown in Table 1.
These statistics of land availability (Table 1) show that just over one half of the world's crop-land (or potential cropcrop-land) is located in the developing countries which presently hold 3/4 of the world population. Cropland is defined as
land under permanent or temporary crops and includes market and kitchen gardens. The cur-rent cropland area of 1.47 Gha represents 0.39 ha/person. The total area of current and poten-tial cropland is 4.15 Gha. Potenpoten-tial cropland has yet to be created from grasslands and forests.It
climbed from an average of 5 kg/ha to 34 kg/ha. While total food production increased by 75%, per capita consumption increased by only 17%, due to a concomitant growth in population.
Feed
Roughly half of the world's grain production is used as animal feed to provide animal protein. However, the majority of the feed for ruminant livestock comes from rangeland. Globally, rangeland accounts for about 80% of all meat production, while in developing countries this value is probably close to 95%. Most rangelands are lands that are too dry to support rain-fed agriculture and about 2.3 Gha (Le. half) of these lands are in developing countries. The world's livestock herds (cattle, buffalo, sheep, goats, pigs) amount to a population of about 4 billion. In developing countries meat animals are often also beasts of burden and provide motive power for pumping and milling; a considerable portion of village energy input in parts of India accord-ing to Reddy and Ravindranath (1987). The pro-ductivity of many of the developing world's rangelands is declining, according to the World Resources Institute (WRI, 1986). Most are proba-bly producing less than 20% of their potential forage due to overgrazing. Though it is unfair to compare European rangeland with that of arid Africa, it is worth noting that although the area of pasture in the African continent is at least 6 times greater than in Europe, Europe produces 75% more cattle and sheep - a productivity difference of 25 times. As with caloric input, protein intake is a function of region, state of development and national income. FAa statis-tics show that the per capita consumption varies widely (FAa, 1983b). Animal protein consump-tion appears to be associated with income level as evidenced by the spectacular growth in meat consumption in OPEC countries of the Middle East dUring the 1970's. The lowest animal pro-tein consumption occurs in the Far East at around 7 g/day per person.
Fibre
the next few decades as a result of the growth in population, literacy and income of the develop-ing countries. Between 1970 and 1980 the devel-oping countries' share of paper and board consumption increased from 11 to 16%, while production in the developing world increased from 7.8 to 12.4%. Current per capita consump-tions in the Third World are often less than 10 kg/ a while in the USA they are about400kg/a. As in the discussion on food and protein the two forces of population growth and increased per capita consumption could result in very large increases in demand for paperand board products.
Environmental Considerations
Environmental impacts of biomass use are asso-ciated with production and harvest of the vege-table raw materials and with their use and conversion into other energy forms.
The most common use of biomass is for com-bustion processes, the majority taking place in developing countries. There is widespread evi-dence that a considerable amount of air pollution is caused by biomass use. The combustion pro-cess is one in which thermal energy is released by oxidation of the biomass, with the carbon and hydrogen in the fuel theoretically converted to carbon dioxide and water. Ideally, only the stoi-chiometric quantity of air (or oxygen) is re-quired. In reality, there is always an excess of air either by design or by the inability of the user to control the air supply. Industrial scale units have good control systems and operate with
mini-mum excess air to avoid water vapour
conden-sa tion in flue gas handling systems. Their efficiencies, as a consequence, can be in the high 80s percent, the emissions of carbon monoxide and unburnt hydrocarbons are low, and with scrubber and filter technology particulate
emis-sions can also be minimized.
The open fire or small cooking stove meets none of the prerequisites for good combustion: the air-to-fuel ratio is impossible to control; the hot flames are quenched on the cold surfaces of cooking pots; and there is an extensive loss of unburnt hydrocarbons and particulates in the form of smoke. At best, the three-stone fireplace
can have an efficiency of 30% but this is more frequently in the range of 5-10%. Vast quantities ofemissions are produced including particulates and gases containing known carcinogens such as benzo(a)pyrene. Evidence from Nepal for en-closed kitchens, has shown that indoor levels of carbon monoxide and dioxide, particulates and hydrocarbons are well in excess of those in heav-ily industrialized cities. Epidemiological evi-dence exists for a causal link between chronic bronchitis, which affects 20% of all rural adults in Nepal, and the use of open stoves (Pandy, 1984).
There has been a significant effort to amelio-rate this situation, particularly by non-govern-mental organizations in developing countries. This has resulted in new stoves having much improved performance with respect to fuel con-sumption and emissions. The diffusion of these stoves and their acceptance into the target com-munities has, however, been slow.
that is affecting vulnerable soils with no pH buffering capacity. Concerns are being ex-pressed about the depletion of the ozone layer as a result of the transport of halogen-containing compounds to the stratosphere. Increased UV radiation at the earth's surface will damage plants in addition to its obvious effects on fair skinned people. The other long range problem involving the biosphere is the question of infra-red-absorbing gases in the atmosphere. The major component of these gases is carbon diox-ide, which has risen in the last century from295
ppm to the present350ppm. These infrared-ab-sorbing gases have been called the greenhouse gases and in a postulated greenhouse effect it is anticipated that there will be significant global warming. The sum of atmospheric alterations related to infrared-absorbinggases could lead to:
• increased soil erosion
• shifts and uncertainties in biomass productivity
• changes in distribution/seasonality of fresh water
• accelerated species extinction • reductions in yield and diversity of
ecosystems, especially of forests.
These changes will obviously reduce the pros-pects for sustainable development and reduction of poverty in the Third World and will decrease political stability. The biosphere is implicated in many of these changes as both source and sink for carbon dioxide. Reduction of forested areas and replacement by poorly managed low pro-ductive rangelands reduces the capacity of the biosphere to absorb carbon dioxide and, at the time of clearance, contributes to the C02 burden. Bad agricultural practice, particularly with fertil-izer use, can lead to increased loss of other green-house gases including nitrous oxides and methane. The changes in climate induced by warming are not easily forecast. Indeed, we are in the midst of a very large scale and irreversible experiment on our environment. There is likely to be an increase in sea level with enormous implications for many world cities. The in-creased temperature of the atmospheric heat en-gine is likely to increase the magnitude and frequency of tropical storms, hurricanes and
ty-phoons. Given the current hard won competi-tion between food security and populacompeti-tion growth, these uncertainties decrease the resil-iency of the world community and its capacity to guarantee adequate food, shelter and energy for everybody.
The conference "The Changing Atmosphere: Implications for Global Security," sponsored by Environment Canada in 1988, made a number of recommendations for immediate action by gov-ernments and industry. These centre on the need to reduce emissions of both Co, and trace gases with the goal of stabilizing carbon dioxide in particular. With the current model for the carbon cycle, this implies a 50% reduction in carbon dioxide emissions. A goal of 10% is proposed for the year2005.This will require large augmenta-tions in efficiency of use of fossil and biomass fuels; large scale shifts to non-carbon
dioxide-emitting sources; and conservation measures to
reduce demand. Each of these has to involve technology which is already in existence! Given the proposed time scale, a switch to lower COr emitting fuels would include increased use of natural gas and both hydro and nuclear electric-ity. The conference recommended that renew-able energy strategies, especially for bioenergy, be reviewed due to the potential of these technol-ogies to better manage the circulation of carbon between the biosphere and the atmosphere with-out adding to the existing pool.
Prospects
rational solution will be to focus on improve-ments in the efficiency of biomass production and utilization. Since food and feed applications are essential to human survival, attention has to be focused on the utilization of residues and wastes associated with their production and pro-cessing. At present, many of these are used in relatively inefficient combustion processes and by changing to new technologies (e.g., improved combustion, gasification, and biotechnological processes such as anaerobic digestion and alco-hol fuel production) energy needs could be sat-isfied while meeting food and feed demands. While there have been many technical advances in bioenergy conversion, all of which it has not been possible to describe, the point has forcibly to be made that only technologically facile pro-cesses having low capital and operating costs and reasonable efficiency are of interest in the development context. Even in the industrialized countries these same criteria apply, since compe-tition from superior fuels (i.e., those that are cleaner, of higher energy density and needing less capital investment in conversion and use) constrains the bioenergy market potential.
Given this, emphasis needs to be placed on direct combustion, the preparation of transport-able solid fuels, such as charcoal, and on appli-cations of these fuels that lead to shaft power and electricity generation. Biotechnological cesses, such as biomethanation and ethanol pro-duction, are currently of minor importance relative to direct combustion and, as a conse-quence of the technological and capital invest-ment requireinvest-ments associated with them, will only emerge in the context of industrialized countries or those in the process of industrializa-tion.
The provision of biomass, unlike conversion of biomass (which is govemed by universal prin-ciples that apply widely), is very much a consid-eration of biome, climate and population. The rural and peri-urban wood fuel problem is likely to be addressed by multiple purpose trees in the context of changes in crop practice to agroforestry and other systems. Those countries with surplus crop production (or land) will clearly be able to look to agri(silvi}-industrial
complexes to generate materials and energy along with foodstuffs and traditional products. In addition, increasing efficiency will lead to the solution of some of the problems of wastes and residue utilization and can address the environ-mental problems which continue to be associ-ated with the primary industries in both developing and industrialized countries.
References
Barnard C.W. (1987) 'Woodfuel in Developing Countries' in D.O. Hall and RP. Overend (eds.),
Biomass: Regenerable Energy(Chichester: John Wiley and Sons), pp.349-366.
Bhatia, R. (1987) 'Energy Demand Analysis in
Developing Countries: A Review,'The Energy Journal8:1-33. Special LDC Issue.
BP (1988)Statistical Review of World Energy(London: British Petroleum Company).
CSE (1982)The State of India's Environment 1982
(Delhi: Centre for Science and Environment).
Eckholm, E.P. (1976)Losing Ground(New York: W.W. Norton).
EI-Shakhs, S. (1983) 'The Population Bomb and Urbanization:AMBIO 12:2:95.
Hall, D.O. (1988) personal communication.
lEA (1987)Renewable Sources of Energy(Paris: International Energy Agency), OECD.
FAa (1982)Tropical Forest Resources(Rome: The UN, Food and Agriculture Organization), Tropical Forestry Paper No. 30.
FAa (1983a)Land Resources for Future Populations
(Rome: The UN, Food and Agriculture Organization), Technical Report INT/75IP13.
FAa (1983b)State of Food and Agriculture 1982
(Rome: The UN-Food and Agriculture Organization).
Coldemberg, J., T.B. Johannsson, A.K.N. Reddy and RH. Williams (1988)Energy for A Sustainable World(New Delhi: Wiley Eastern).
Overend, RP. (1986) 'Biomass, bioenergy and biotechnology: A futuristic perspective' in W.H. Smith (ed.),Biomass Energy Development(New York: Plenum Press), pp.I-16.
Pandy, M.R (1984) 'Domestic smoke pollution and
chronic bronchitis in a rural community in the hill
region of Nepal,'Thorax39:337-339.
Biomass: Regenerable Energy (Chichester: John
Wiley and Sons), pp.387-411.
UN(1985) World Population Prospeds: Estimates and Projections as Assessed in 1982(New York:United
Nations), Population Studies No.86(and
annexes).
UNEP (1982) The World Environment 1972-1982
M.W. Holdgateet al(eds.), (Dublin: The United
Nations Environment Program).
Vitousek, P.M., P.R. Ehrlich, A.H. Ehrlich and P.A. Matson(1986)'Human Appropriation of the
Productsof Photosynthesis,' BioScience 36:6:368-373.
Wijesinghe,L.CA.de S.(1988)'Biomass Fuel and its
UtilizationinSri Lanka,'RERIC International Energy ]oumal10:1:67-80.
WB(1985) Ensuring Food Security in the Developing World: Issues and Options(Washington: World Bank).
WB(1988) World Development Report 1988(Oxford: Oxford University Press).
WCED(1987) Our Common FutureReport of the
World Commission on Environment and
Development (Oxford: Oxford University Press)
[also known as the Bruntland Commission].
WEC(1986) World Energy Conference. Survey of Energy Resources(London: World Energy Conference Publication).
WRI(1986) World Resources 1986International
Institute for Environment and Development/ World Resources Institute(New York:Basic
Books).
Wu Wen and Chen En-Jian(1983)'Resolution of