OPEN SOURCE SOFTWARE: THE ROLE OF MARKETING
IN THE DIFFUSION OF INNOVATION
Andrew Whitmore*, Namjoo Choi, Anna Arzrumtsyan
State University of New York at Albany,118 Draper Hall, 1400 Washington Avenue, Albany, NY 12222, USA *email: [email protected]
Abstract. Much of the literature on open source software (OSS) has focused on the role of the community of users and developers as the primary driver of OSS growth. This focus on growth generated by the community is referred to as “single factor” growth and is an assumption shared by literature on the diffusion of innovation. The purpose of this research is to attempt to fit a logistic model to a well-known OSS project as a confirmatory exercise supporting the use of a single factor growth model as suggested by the literature. The results show that a logistic model, or any kind of single factor model, is inadequate to describe the diffusion of the OSS project. The paper then explains conceptually and illustrates mathematically why single factor models cannot fully represent the diffusion of any OSS project. A well-known two-factor model drawn from the marketing literature is presented, shown to solve the problem of single factor models, and used to illustrate the importance of marketing in OSS projects. This research suggests that the OSS literature may be overemphasizing the importance of the size of the user and developer community during the initial stages of growth and that during these stages the diffusion of the OSS project is primarily driven by external forces such as advertising or marketing efforts.
Keywords: Open Source Software, Diffusion, Marketing.
1. Introduction
Diffusion of innovation concerns itself with the reasons, means, and speed at which innovations, usually technologies, spread throughout society. The crux of diffusion of innovation is that the growth of the innovation is driven primarily by those who have adopted the technology. In other words, more than any other factor, the popularity of the innovation is deter-mined by the size of the group of people who have already adopted it, a phenomenon referred to as imi-tation in the literature [16]. Imiimi-tation need not be thought of only as a superficial social fad. Imitation can be thought of as resulting from the satisfaction an earlier adopter received from the use of the inno-vation. The more satisfaction earlier users derive from the product, the more they will advocate it by “word of mouth” and the more new people will adopt it. The proposition that growth is driven by the size of the user base (through imitation) characterizes traditional diffusion of innovation theory as a single factor growth model where the “factor” is the existing user base.
Open source software is an innovation that has experienced rapid growth since the 1980s and has inspired the creation of online OSS communities such as SourceForge.net where people can download,
discuss, develop and extend open source software. The popularity of several high profile OSS projects such as Linux, FireFox and OpenOffice has raised questions about what factors drive OSS success. Some of the OSS literature emphasizes the importance of the tradi-tional factors suggested by the software development literature pertaining to internal elements of the project such as the use of version control and testing strate-gies [13] and the role of trust and communication within the project team [21] and the emphasis placed on usability [2]. The implication is that these factors could improve product quality and thus result in a higher level of satisfaction for adopters of the OSS.
The basic story of growth told by this model is that as an OSS product is used, user satisfaction will increase by some amount determined by the quality of the OSS. This increase in user satisfaction will in turn drive others to adopt and use the software. Thus there is a positive feedback loop between the level of current users and the growth in popularity of the OSS. In other words, current users attract new users through their satisfaction with the OSS. Thus, the existing user base is the primary driver of the growth of OSS adoption. The mechanism by which user satisfaction attracts new users can be broadly thought of as “word of mouth”. High OSS quality will result in a high level of user satisfaction which will prompt users to spread positive information about the OSS. The quality of the OSS will act as a limiting factor in the diffusion rate of the OSS. Quality in the absence of a user base is insufficient to drive the growth of an OSS project since a user base is necessary to drive diffusion through user satisfaction. For example, a high quality OSS for which there is no demand would not expe-rience significant diffusion. Furthermore, the quality of the OSS cannot be fully known until it is used, i.e. there is already a user base. Thus, this framework for OSS success entails the use of a single factor model of diffusion where the popularity of the OSS is driven by a single factor, its user base.
Complementing this model of OSS success and diffusion, it has become a widely held view that at-tracting users and developers into an OSS project is an essential part of maintaining the quality of the code [14, 15]. The reason given is that the more users and testers for the OSS there are, the more quickly problems in the code are identified and resolved. This relationship suggests a positive feedback loop between the number of users and the quality of the OSS. This feedback loop would have the effect of further accele-rating the growth of the project as the user base increases through the effect of improved quality.
More support for a single factor view of OSS dif-fusion lies in a stream of research about the network effects of OSS. Network effects, or the principle that a commodity is increased in value as the number of individuals by whom it is used increases, has been applied as a lens through which to view OSS success. Numerous studies have characterized network effects [e.g., 17] as a critical factor in the diffusion of software in general and OSS in particular. Some researchers have suggested that the role of network effects in the diffusion of an OSS needs to receive greater emphasis, particularly in environments that are dominated by proprietary software [11].
These streams of research all have one common focus: the importance of the existing user base in the diffusion of OSS projects. The proposition that OSS diffusion is based on single factor growth can be evaluated by fitting a single factor model to data and comparing the results for consistency. One single fac-tor growth model that has been applied repeatedly to predict innovation diffusion is the logistic model [20].
The logistic model has been used to describe a large number of diffusion phenomena ranging from the growth of empires to the expansion of energy markets [12].
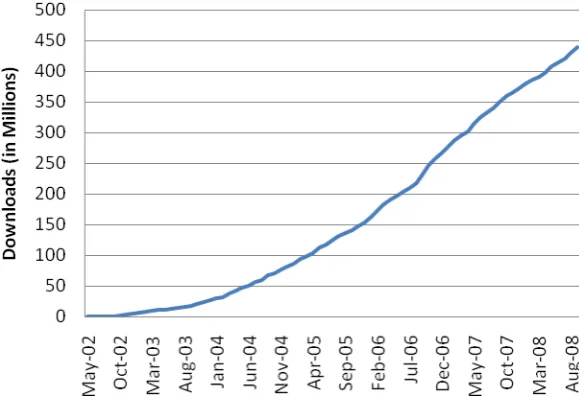
For the purposes of this research, the logistic mo-del will be applied to a specific OSS case, eMule. eMule is a file-sharing client based on an earlier ap-plication called eDonkey2000 [18]. As of October 2008, SourceForge.net ranks eMule as the most popular OSS in its history with over 450 Million downloads [19]. eMule has been translated into 35 languages and many modifications and package appli-cations have been created for it. Data on the cumu-lative and monthly number of downloads were collected from the SourceForge.net site for the period May 2002 - September 2008.
The purpose of this research is to attempt to fit a logistic model to a well-known OSS project as a confirmatory exercise supporting the use of a single factor growth model as suggested by the literature. The results will show that a single factor logistic mo-del, or any kind of single factor momo-del, is inadequate to describe the diffusion of the eMule project. The paper will then explain conceptually and illustrate mathematically why single factor models cannot fully represent the diffusion of any OSS project. A well-known two-factor model drawn from the marketing literature is presented, shown to solve the problem of single factor models, and used to illustrate the impor-tance of marketing in OSS projects.
2. Logistic model of innovation diffusion
In the logistic model, the rate of growth is propor-tional to both the population and the carrying capacity of the environment. Initial stages of growth are expo-nential followed by a slowing and termination of the growth rate as the carrying capacity is reached. The resulting curve resembles an “S” which has resulted in logistic growth often being referred to as “S-shaped” growth. The property of logistic growth which holds that growth is proportional to the existing population of users is an assumption that underlies much of the current thinking about the diffusion of open source projects. Therefore the ability to model open source software diffusion with a logistic growth model would be a confirmation of that paradigm of thought.
As Figure 1 shows, the growth of the eMule OSS project appears to be in the process of following an “S-shaped” growth pattern indicating consistency with the logistic growth model.
represented by the maximum number of potential users of the software. For the purposes of this research, the population (or user base) was represented by the cumulative number of downloads recorded by SourceForge.Net and the growth rate was represented by the monthly number of downloads. The other constant parameters in the model (for example, carrying capacity) were estimated by the optimization technique employed by Vensim DSS software [22]. The optimization procedure employed has several stages:
Stage 1: First, reference mode data are collected in order to calibrate the model. Data on total downloads and downloads per month for the period (May 2002 – September 2008) were obtained from SourceForge. net.
Stage 2: Next, a payoff function must be defined for the optimization process. For this particular simulation, the payoff function includes the two variables for which data was obtained: total downloads and the rate of downloads. The payoff weights for both variables were set equal to one. The payoff function is defined as the difference between the data and the model estimates multiplied by the specified weight (in this case one). This product is then squared. This number summed for all the data points is equivalent to ( ˆ)2
i
i Y
Y −
∑
which is the resi-dual sum of squares. Minimizing the resiresi-dual sum of squares is the process employed in ordinary least squares regression.Figure 1. Total downloads of the eMule application
Figure 2. Stages of the optimization procedure
Stage 3: Finally, the payoff function, or residual sum of squares, is minimized via Powell’s method [23]. Powell’s method is a procedure for function mi-nimization in multiple dimensions. Powell’s method is designed to find the payoff function minimum through a direction-set method. Procedurally, Powell’s method defines a set of directions specified as unit vectors and proceeds along in a given direction until a minimum is
until the difference in the payoff function values bet-ween iterations reaches a minimum level. The stages of the optimization procedure are depicted in Figure 2. The end result of these stages is a set of optimal parameter estimates1 derived through a nonlinear
mi-nimization of the residual sum of squares. Figure 3 shows the fit between the growth of the eMule project and the estimated growth of the project based on the logistic model.
Figure 3. Actual and estimated total downloads
Table 1 shows that R2 (R-square), an overall indi-cator of model fit, is very high (.998) for the logistic model of the diffusion of the eMule project.
Table 1. Descriptive statistics for total downloads (logistic model and data)
Statistic Estimate Data
Count 77 77
Min 7.972 0
Max 429.28 439.51
Mean 162.66 161.19
Median 116.15 124.49
StDev (over all points) 140.68 142.47 StDev (normalized) 0.8649 0.8838
R-square 0.9982 –
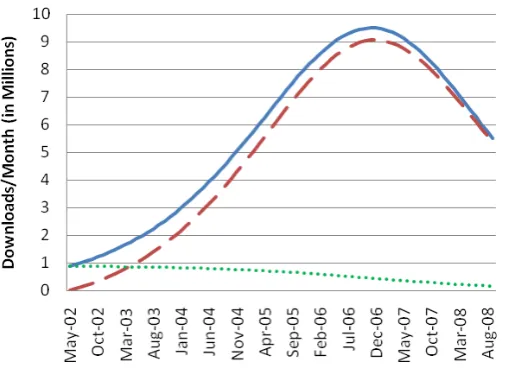
In addition to the cumulative downloads, Figure 4 shows that the estimated growth rate (Millions of downloads/Month) is assuming the bell shape that is consistent with logistic growth and the diffusion of innovation literature [16].1
Compared with the cumulative downloads, the be-havior of the download rate is somewhat volatile and has produced a correspondingly lower R2 for this variable. However, as Table 2 demonstrates, the over-all fit is still good.
1 Please see Appendix for parameterized values and model
equations
Table 2. Descriptive statistics for download rate (logistic model and data)
Statistic Estimate Data
Count 77 77
Min 0.6244 0
Max 9.879 16.55
Mean 5.531 5.707
Median 5.787 5.728
StDev (over all points) 3.149 3.551 StDev (normalized) 0.5694 0.6221
R-square 0.6876 –
Figure 4. Actual and estimated download rate
Figure 5. Non-linear relationship between fractional growth rate and total growth
3. Problems with single factor growth models
This begs the question as to how the model was able to generate such a high R2 while failing to replicate the behavior of the data shown in Figure 5.
The answer lies in the fact that the logistic model must make the assumption that a new project already has an existing user base. Figure 6 illustrates this phenome-non.
While the overall fit of the estimates to the data is very good, the greatest point of divergence occurs at the beginning of the diffusion process. The data show an initial user base of zero while the estimate requires an initial user base of almost 8 million people.
This illustrates that the primary problem with single factor growth models is that they are unable to explain project startup. This is a mathematical problem that will pertain to all single factor growth models applied to any OSS project. Conceptually, the problem can be understood as follows: before the eMule project began there were no users of the application. Since there were initially no users, growth resulting from community factors such as the number of users and developers would be minimal or zero (since this community was close to or at zero). This suggests that a focus on the size of the user and developer community alone is inadequate to account for diffusion during the initial phases of growth. The implication from this result is that initial growth is driven by factors external to the existing project community itself. These external factors can include advertising, marketing and direct sales efforts [20]. Thus, the use of single factor growth models leads to an overestimation of the importance of the number of users and developers in the diffusion of innovation.
4. The Bass Diffusion Model
Frank Bass [3] created a model of innovation diffusion that addresses the startup problem by suggesting that the initial growth of a project is driven by advertising. Advertising is the main driver of growth until its effect is overcome by growth resulting from community based factors of the project, namely the number of users and developers. The Bass Diffusion Model is applied to the case of eMule by adapting and parameterizing an existing ordinary differential equation representation of Bass’s model [20]. The model makes use of the data on cumulative downloads and monthly downloads obtained from SourceForge.net and additionally requires the estima-tion of several constant parameters. These constants were estimated by the optimization technique em-ployed by Vensim DSS software which was described in detail in Section 22. The model showed excellent fit with an R2 = .999.
The R2 improved slightly for the total number of downloads over the logistic model (see Table 3). As can be seen from Figure 7, the early stages of OSS diffusion estimated by the Bass model map much more closely to reality than the estimates generated by the logistic model. Note in particular that the Bass model no longer requires the existence of an initial user base thus solving the startup problem present in single factor growth models. The slight increase in an
2 Please see Appendix for parametrized values and model
equations
already high R2 is driven by the better match between the estimates and the data in the early stages of OSS diffusion.
Table 3. Descriptive statistics for total downloads (Bass model and data)
Statistic Estimate Data
Count 77 77
Min 0 0
Max 433.99 439.51
Mean 161.82 161.19
Median 119.54 124.49
StDev (over all points) 141.72 142.47 StDev (normalized) 0.8757 0.8838
R-square 0.9993 –
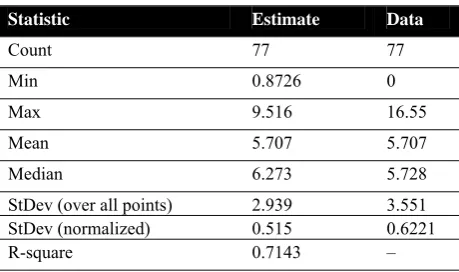
Table 4 shows a significant improvement in the R2 for the download rate in the Bass model compared to the logistic model (a change from .687 to .714). Figure 8 illustrates the different curve trajectories predicted by the two models.
Table 4. Descriptive statistics for download rate (Bass mo-del and data)
Statistic Estimate Data
Count 77 77
Min 0.8726 0
Max 9.516 16.55
Mean 5.707 5.707
Median 6.273 5.728
StDev (over all points) 2.939 3.551
StDev (normalized) 0.515 0.6221
R-square 0.7143 –
Thus, it appears that the Bass model does a better job representing the growth of the eMule project than the logistic model. This suggests that a single factor growth model where growth is dependent only on the size of the existing community is inadequate and that marketing plays a formative role in the early expansion of open source projects.
Figure 7. Actual and estimated downloads for both model types
Figure 8. Actual and estimated download rate for both model types
5. Generating insights and experimenting with the Bass model
The Bass model offers a number of insights about the role of advertising in the growth of OSS projects. As a driver of growth, effective advertising will result in a greater diffusion of the OSS project. Additionally, the Bass model offers the insight that an OSS group would be better served by committing more resources to advertising during the startup of the project than maintaining a sustained higher level of advertising throughout the project.
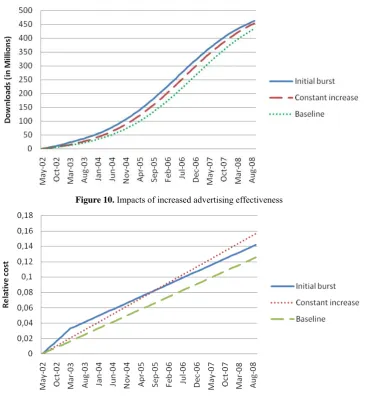
Figure 10 illustrates the Bass model estimate of the eMule project along with two hypothetical experi-ments where advertising effectiveness is increased. An increase in advertising effectiveness can be interpreted as resulting from an increase in marketing efforts. In one experiment, the estimated advertising effective-ness is increased by 25% from the level estimated to exist in the actual eMule project. This run is labeled,
“Constant increase”. In the other experiment, the advertising effectiveness is increased by 100% during the first ten months of the project and then reduced to the baseline estimated level thereafter. This run is labeled, “Initial burst”.
As is apparent from the graph, advertising is most important during the initial stages of an OSS project and less important as the size of the community in-creases and growth from “word of mouth” takes over. More specifically, the model predicts an increase of 29.23 Million downloads by the final time (September 2008) over the base eMule project if advertising effectiveness had been increased via the “Initial burst” procedure. Likewise, the “Initial burst” run generated 10.49 Million more downloads than the “Constant increase” run.
Figure 11 shows the relative costs associated with these experiments and the baseline Bass estimate of the eMule case.
Figure 10. Impacts of increased advertising effectiveness
Figure 11. Advertising costs
Thus, it is more effective and less expensive (in monetary terms or hours of volunteer time spent) to invest substantially in advertising in the early stages of
project. These results indicate that one of the key success factors for OSS projects should include inten-sive marketing efforts during the initial stages of the project.
It is important to note that the relative cost in this model is simply modeled as a summation of accumu-lated advertising effectiveness which is a dimension-less constant parameterized by the optimization procedure. This formulation is tantamount to asserting that there is a unary relationship between advertising effectiveness and advertising expenditures. Thus, doubling the advertising expenditure rate through increased marketing efforts is presumed to double advertising effectiveness. Costs are modeled in this manner for purposes of simplicity and due to a lack of available data. In reality, one could expect this rela-tionship to be better represented by a curve. The curve would likely show increasing returns during the initial expansion of the advertising efforts followed by decreasing returns when investment in advertising reached high levels. Thus, a doubling of expenditures would produce more than a doubling of advertising effectiveness early on in the project, but once large amounts of money have already been spent on adver-tising, the costs of more advertising would begin to outweigh the benefit received from additional expen-ditures. This scenario is also consistent with the findings describing the benefits of a higher level of early investment over a constant level of investment throughout the project. In fact, decreasing returns to expenditure over some portion of the advertising function would increase the benefits accrued through an initial early burst of investment since there would be declining benefit accruing to a constant level of investment throughout the project lifecycle. Even if one were to make the assumption of ever increasing returns to expenditure, the general results found here would still be valid. The reason for this is that advertising is designed to turn potential users of an OSS into actual users of that OSS. Once the pool of potential users begins to fall due to adoption of the OSS, the relative importance of advertising declines. At the same time, as the size of the user base of the OSS grows, the relative importance of “word of mouth” from the growing user community increases and overshadows the importance of advertising. While not affecting the general results, the lack of data on returns to advertising constitutes a limitation in the sense that its absence limits the point predictive ability of the model.
6. Limitations
The overall purpose of this research was to demonstrate that single factor models cannot adequately represent OSS diffusion because they fail to account for project startup. Thus, two factor growth models such as the Bass model are required to sufficiently describe the dynamics of OSS diffusion. This finding suggests that the OSS literature should expand its current paradigm of thought beyond single
factor community-based models and expend greater effort examining other aspects of OSS projects such as marketing. This research selected a single but significant OSS project, eMule, and from its analysis made a set of general statements about OSS projects. While this approach succeeds in establishing grounded theory about the nature of OSS diffusion and the eMule case in particular, these generalizations need to be verified by additional empirical work involving other cases.
7. Discussions and conclusions
The results demonstrate that a single factor growth model is insufficient by itself to explain the diffusion of OSS projects. While the size of the project com-munity and the internal characteristics of the project are indeed the dominant driver in the long run, in the initial stages of growth the diffusion of the OSS project is primarily driven by external forces attracting users to the project such as advertising or marketing efforts.
These advertising or marketing efforts can take a wide range of forms. They can include localized ef-forts such as posts to message boards announcing the genesis of the new project or the creation of project web sites such as the official eMule project website [1]. Alternatively, they can take the form of massive volunteer led marketing campaigns as in the case of FireFox [10]. It is also feasible that online OSS deve-lopment forums like SourceForge.net offer some mar-keting benefits for OSS projects.
Whatever form of marketing an OSS project employs, the clear implications of this research is that advertising and marketing efforts are of the most value during the initial stages of project growth. The marke-ting strategy suggested by this research would involve investing the majority of the resources committed to advertising during the initial stages of the project and tapering them off reasonably quickly after the project develops a significant user base and momentum of its own. As the research points out, a sustained level of advertising during the entire life of the OSS project can result in less diffusion and greater cost than a significant initial effort.
References
[1] Official eMule Homepage.
http://www.emule-project.net, 2008.
[2] M.S. Andreasen, H.V. Nielsen, S.O. Schrøder, J. Stage. Usability in open source software development: Opinions and practice. Information Technology and
Control, 2006, Vol.35, 303-312.
[3] F. Bass. A new product growth model for consumer durables. Management Science, 1969, Vol.15, 215-227.
[4] K. Crowston, H. Annabi, J. Howison. Defining Open Source Software Project Success. Proceedings
of the 24th International Conference on Information
[5] K. Crowston, J. Howison, H. Annabi. Information Systems Success in Free and Open Source Software Development: Theory and Measures. Software
Pro-cess: Improvement and Practice, 2006, Vol.11,
123-148.
[6] K. Crowston, H. Annabi, J. Howison, C. Masango. Towards a portfolio of FLOSS project success measures. Workshop on Open Source Software
Engi-neering, 26th International Conference on Software
Engineering, 2004, 29-33.
[7] W.H. DeLone, E.R. McLean. The DeLone and Mc-Lean Model of Information System Success: A Ten-Year Update. Journal of Management Information
Systems, 2003, Vol. 19 (4), 9-30.
[8] W.H. DeLone, E.R. McLean. Information System Success Revisited. Proceedings of the 35th Hawaii
International Conference on System Sciences, 2002,
2966-2976.
[9] W.H. DeLone, E.R. McLean. Information Systems Success: The Quest for the Dependent Variable.
Infor-mation Systems Research, 1992, Vol.3, No. 1, 60-95.
[10] S. Krishnamurthy. The Launching of Mozilla Firefox- A Case Study in Community-Led Marketing.
http://opensource.mit.edu/papers/sandeep2.pdf, 2005.
[11] L. Lin. Impact of User Skills and Network Effects on the Competition between Open Source and Proprietary Software. Electronic Commerce Research and
Appli-cations, 2008, Vol.7, No.1, 68-81.
[12] C. Marchetti. Society as a learning system: Disco-very, invention, and innovation cycles revisited.
Technological Forecasting and Social Change, 1980,
Vol.18, No.4, 267-282.
[13] M. Michlmayr. Software process maturity and the success of free software projects. In: K. Zieli´nski, T. Szmuc (Eds.), Software Engineering: Evolution and
Emerging Technologies, IOS Press, Krak´ow, Poland,
2005, 3-14.
[14] E.S. Raymond. The cathedral and the bazaar. First
Monday [online], 1998, Vol.3 No.2.
[15] E.S. Raymond. The Cathedral and the Bazaar: Musings on Linux and Open Source by an Accidental Revolutionary. O'Reilly Media, 2001.
[16] E.M. Rogers. Diffusion of innovations. The Free
Press, 1995.
[17] M. Shurmer. An Investigation into Sources of Net-work Externalities in the Packaged PC Software Mar-ket. InformationEconomics and Policy, 1993, Vol.5,
No.3, 231-251.
[18] SourceForge.net. eMule.
http://sourceforge.net/projects/emule/, 2008.
[19] SourceForge.net. Top Downloads. http://sourceforge.
net/top/topalltime.php?type=downloads, 2008.
[20] J. Sterman. Business Dynamics: Systems Thinking and Modeling for a Complex World. Irwin McGraw-Hill, 2000.
[21] K.J. Stewart, S. Gosain. The Impact of Ideology on Effectiveness in Open Source Software Development Teams. MIS Quarterly, 2006, Vol.30, No.2, 291-314. [22] Ventana Systems Inc. Vensim DSS Version 5.
Har-vard, MA.
[23] K. Yokoyama, A. Yoshii, T. Adachi, R. Kasai. Ap-plication Of Fletcher-Powell's Optimization Method To Process/Device Simulation Of Mosfet Charac-teristics. Solid-State Electronics, 1982, Vol.25, No.3, 201-203.
Appendix: Model parameters and equations
Logistic Model:
Constants
Parameter Value Units
Λ Initial download fraction 0.0160612 Dimensionless
δ Carrying capacity 496.383 Downloads (Millions)
Ψ Initial value for total downloads 7.9725066396 Downloads (Millions)
Φ Maximum fractional download rate 0.0796089 1/Month
Note: The initial value for total downloads (Ψ) is a parameterized fraction (Λ) of the carrying capacity (δ). Thus, Ψ=
Λδ. Variables
Variable Equation R Fractional download rate R = Φ(1-Z/δ) U Download rate U= RZ
Z Total downloads 77
1
( )
Z t =
∫
Udt+ ΨEquivalently, one may define the following differential equation to represent the rate of change (derivative) of the number of total downloads:
) (t U dt
dZ = .
The fractional download rate (R), is a declining function of the number of total downloads relative to the carrying capacity. Thus, as the number of downloads approaches the carrying capacity, the fractional download rate decreases.
Bass Model:
Constants
Parameter Value Units
α Adoption Fraction 0.00191034 Dimensionless
η Advertising Effectiveness 0.00165024 1/Month
ζ Contact Rate 35.9342 1/Month
σ Initial value for potential downloads 528.809 Downloads (Millions)
τ Initial value for total downloads 0 Downloads (Millions) ε Initial value for advertising costs 0 Dimensionless
δ Capacity 528.809 Downloads (Millions)
Variables
Variable Equation A Adoption from Advertising A = ηP
W Adoption from Word of Mouth W = ζαP(Z/δ)
C Advertising costs 77
1
( )
C t =
∫
ηdt+εU Download rate U = A+W
P Potential downloads 77
1
( )
P t = −
∫
Udt+σZ Total downloads 77
1
( )
Z t =
∫
Udt+τP(t) represents the number of potential downloads at time t. Potential downloads takes as an initial value the estimate of the carrying capacity of the system. As users download the software (U), potential downloads become actual downloads causing potential downloads (P) to decrease and total downloads (Z) to increase by an equal amount. Thus, the download rate (U) is a flow out of potential downloads into total downloads. Advertising costs (C) are an integration of advertising effectiveness (η) over the time frame of the simulation. A positive relationship is assumed between advertising effectiveness and advertising costs. For example, as steps are taken to increase advertising effectiveness the total cost of advertising is presumed to rise. More is said about this assumption and its implications in Section 5.
As mentioned in the discussion of the logistic model, one may equivalently describe the state of a system in terms of a series of first order differential equations. These equations follow naturally from the integral equation representations above.
) (t dt
dC=η Derivative of advertising costs (C),
) (t U dt
dP=− Derivative of potential downloads (P),
) (t U dt dZ =
Derivative of total downloads (Z).