ECONOMIC VALUE OF R&D IN THE FIELD
OF FAST REACTORS TAKING INTO
ACCOUNT UNCERTAINTY ON THEIR
COMPETITIVENESS:
THE CASE OF FRANCE
NATHALIE TAVERDET-POPIOLEK
Commissariat à l'Energie Atomique et aux énergies alternatives, France
BIANKA SHOI
Research Institute of Innovative Technology for the Earth in Kyoto, Japan
ABSTRACT
In a context of mix signals regarding worldwide nuclear development, this paper aims at assessing the economic value of pursuing research in Generation IV fast reactors today, given that it would allow industrial deployment around 2040 in case of high uranium prices. Two key variables shall be considered as inputs for the assessment: the price of uranium and the overcost of Generation IV reactors compared with the previous generation. Our model is based on the “real options” theory which demonstrates that this value is positive and outweighs the risks associated with the competitiveness of Generation IV. It is quite simple but it clarifies and introduces important aspects of the field.
KEYWORDS:
Real option, research, nuclear
RESEARCH HIGHLIGHTS:
• We assess nuclear fleet costs with or without fast reactors and with uncertainty • The fleet costs difference represents the budget available for fast reactors R&D
• Due to uncertainty and to increasing information over time, the R&D budget is positive even for unfavorable assumptions
• Feedback effects of fast reactors deployment lower uranium costs for the whole fleet
JEL CLASSIFICATION:
D81 (Criteria for Decision-Making under Risk and Uncertainty)
O33 (Technological Change: Choices and Consequences; Diffusion Processes), Q48 (Energy/Government Policy)
CORRESPONDING AUTHOR:
Nathalie Taverdet-Popiolek, Commissariat à l'Energie Atomique et aux énergies alternatives, France
INTRODUCTION
With growing demands for energy, especially in emerging countries experiencing fast economic growth such as China and India, and also given the increasing need for low-carbon technologies in a context of international concern for climate change issues, nuclear energy technologies could keep expanding, despite the Fukushima disaster that questioned the short-term development of nuclear energy (MIT, 2012). In particular, IAEA’s 2013 forecast assesses nuclear growth to 2030 between 17% (low case scenario) and 94% (high case scenario) (IAEA, 2013).
In 2014, nuclear energy generated 11,5% of electricity in the world, 27% in Europe and 76,9% in France (IAEA1 and Word Nuclear Association Statistics, 2015). In terms of nuclear technologies, light water reactors (LWR) currently occupy a predominant share of today’s nuclear fleet worldwide, representing 91% of the installed nuclear capacity in the world (IAEA, 2015).
Their weak point – Generation III reactors included – nevertheless remains their less-than-optimal use of the uranium resources. Only 0.5% to 1% of the natural uranium required to manufacture the fuel is actually used to generate energy by fission. Such a performance level means that nuclear fission cannot be considered as a sustainable energy solution since our natural uranium sources are limited. The identified world resources that can be mined for less than $260/ kg amount to 7.6 million tonnes, which guarantees about 130 years’ operation for the reactors currently in service2. The progress made in mineral exploration techniques, together with more expensive unconventional resources (like phosphates), will certainly boost the number of available possibilities (Kahouli (2012) shows that exploration and production increase when uranium prices rise). Nonetheless a potential growth of the world's
nuclear fleet could have an important impact on the demand for natural uranium. Since there is still a possibility that nuclear energy will expand in the long-term, the uranium market is under significant risk of coming under pressure before the end of the 21st century. This may
occur even earlier if the world’s nuclear fleet grows rapidly (carbon tax, electric cars) or mineral exploration proves to be less promising than expected. Nevertheless, whether upward or even downward, the prise of uranium will evolve with this uncertainty, being taken into account in this study.
To avoid such pressure, the fourth generation of fast reactors should be designed to fully exploit the benefits of self-breeding (i.e. as much fissile material is produced as that consumed by the reactor) or even of breeding (i.e. more fissile material is produced than that consumed by the reactor). Several thousand years of fission energy can be guaranteed by using a greater fraction of natural uranium.
The need to be able to integrate fast reactors into the nuclear electricity-generating reactor fleet becomes apparent in 2040 for France. This option would make it easier to relieve any pressure on the uranium market. The competitiveness of this innovative technology is, however, uncertain owing to the additional investment costs involved. The relevance of such an option is therefore to be confirmed in the future. For the time being, only the sodium-cooled fast reactor (SFR) technology seems capable of meeting this requirement by 2040 owing to its high level of maturity.
- The first concerns the 20063 French Act on the sustainable management of radioactive material and waste, which required finishing an assessment on the industrial prospects of transmutation technologies (Gen IV reactors offer new transmutation possibilities),
- The second involved completing the first R&D phase on Gen IV systems, which helped gain an over view of the situation and enabled the authorities to decide to pursue R&D (the programme should lead to building the 600 MWe SFR industrial prototype called ASTRID in 2025).
The question is to know a posteriori whether it is worth pursuing R&D on SFRs from a strictly economic point of view. The purpose of our study is thus to shed light on this issue and identify any economic information that can be used to assess the 2012 decision to go ahead with building ASTRID. To achieve this goal, we developed a model based on the real options theory that compares the consequences of the two possible outcomes: decision makers will be faced with a situation, in which they have to choose whether they should launch an industrial SFR programme or not, depending on the technology’s relative competitiveness compared with LWRs; if the R&D option is forgone, the only choice would be to keep operating LWRs, since it is assumed that only these two technologies are competing. As a result of the comparison carried out in our study, more economic value seems to lie in the R&D option.
We applied the model to a large panel of hypotheses in order to map option values illustrating different scenarios of uranium price variations and SFR overcost. The purpose of such a study is to support the decision-making process rather than build forecasts based on these parameters.
The paper first goes through literature about real option theory in section 2, then explains the building of the model in section 3. The applications and results of the model to our case
study are presented in section 4. Section 5 explores a sophistication of the model by including endogenous effects on uranium prices. Section 6 discusses the main results and concludes.
LITERATURE REVIEW: A SAMPLE IN THE FIELD OF ENERGY
Numerous studies imply that the theory of real options has already been applied to fields such as Energy and R&D investments. Martinez et al. (2013) put forward a review of research works applying real options theory to electricity generation projects. They show that real options were particularly useful in assessing the project’s economic value, mostly at the planning stage of the project, when investment decisions have to be made under uncertainty of future prices. Various types of prices are at stake with regards to electricity generation projects: electricity prices as in Barria (2011), Takashima (2010), Madlener and Stoverink (2011), Madlener et al. (2005) especially in deregulated market contexts; fuel prices, as in Davis and Owens (2003) who assess the value of renewable technologies in the face of uncertain fossil fuel prices; or both the price of energy inputs and that of electricity as in Roques et al. (2006) and Bobtcheff (2006) who focus on the choice between a nuclear or natural gas-based power generation, or as in Kumbaroglu et al. (2006) and Fernandes et al.
(2011) who focus on the diffusion prospects of renewable technologies.
Beyond the prices for energy goods, uncertainty also resides in costs such as that associated with investments, especially for capital-intensive technologies: Rothwell, (2006) studies how investment cost conditions for boiling water reactors in the US can lead to new purchase orders for reactors, and Guillerminet (2002), investigates how different financing methods and associated costs can influence the investment decision in nuclear equipment.
CO2 prices are also prices are also subject to uncertainty due to climate policy evolution:
information on the carbon market before starting their investments; Liu et al. (2011) model uncertainty in CO2 prices as well as fuel and electricity to assess optimal timing for
generation investment; thereby taking into account uncertainty not only from the market but also from policy perspective.
Energy and climate policies encouraging investments can also be evaluated through the uncertainty of incentives, such as in in Lee and Shih (2010) evaluating the renewable energy policy in Taiwan, or Siddiqui et al. (2007) also assessing a US federal program for R&D on renewables. The book by Ostertag et al. (2004) provides a collection of articles on the real options approach in the energy sector, while taking into account synergies with climate policy.
More sophisticated studies take into account uncertainty of prices and costs at several levels of the project: uncertainty with respect to future sales prices, potential project budget overruns, future performance, market targets, and overall timeline of the project, as in Huchzermeier and Loch (2001) Perlitz et al. (2002) Wang and Hwang, 2005, who used which to select R&D projects or portfolios; more recently, Martinez and Rivas, 2011 apply it to the Mexican electricity system. Further, Haikel Khalfallah (2009) studies the problem of adequate long-term capacity in electricity markets, using the dynamic programming method as well as the real option theory to develop two dynamic models.
Ionesco and Heraud (2011) who asses the value of reversibility in terms of geological disposal of radioactive waste packages.
This non-exhaustive literature review shows that the applicability of real option values is quite broad and addresses the issue of investment and risk management in industries, in which innovation strategy is key. Among all these examples from the literature many present more or less similar questions as the one raised in this paper; in the domain of R&D and investments choices, nuclear and electricity fields.
However, the work of Epaulard and Gallon (2001) deserves particular attention, which uses a real options model to assess the relevance of building a European pressurised reactor (EPR) prototype, providing an alternative technology in the long term in the case of high gas prices.
In terms of guarantees, this approach is similar to ours though it does not concern the Generation IV technology with the sustainability advantages and uncertainties that characterize its cost.
Our research is rather innovative since it covers the issue of a pioneering technology that can only be deployed on the market in the long term. The uncertainty on this date of 2040 both in terms of the uranium raw material and the competitiveness of the technology has not yet, to our knowledge, been studied using the real options theory.
2040, we logically use a decision tree modeling with fixed windows of opportunity for decision and information gain as in Henry and Arrow & Fischer.
This paper details the model and the simplifying assumptions that we have developed to assess the relevance of continuing R&D on fast reactors beyond 2012.
METHOD: MODEL BASED ON REAL OPTION THEORY
This study furthers previous research on the real options theory to estimate the R&D economic value for Generation IV nuclear reactors (see Taverdet-Popiolek and Mathonnière, 2010). Our previous work used a decision tree to show the different options in discrete scenarios with fixed windows of opportunity. However, it focused on the risks inherent to research (reaching safety objectives, operability, reliability and acceptable investment cost). We have taken a different angle this time since the risks related to research are disregarded, whereas uncertainty focuses on the overcost of SFRs compared with LWRs and on the future price of natural uranium with the deployment of nuclear energy worldwide (though it could be hindered by the Fukushima disaster). The model is quite simple but it clarifies and introduces important aspects in the field of future nuclear power.
Decision in 2012
As mentioned in the introduction, for the time being, the R&D option has been chosen. We nevertheless explain in this paragraph the two possible outcomes that could have occurred in 2012.
In our modelling, the public authorities are responsible for making a decision that is in the interest of the general public. The decision to be made in 2012 is assumed to be binary: “halt R&D on Generation IV reactors” or “finance R&D in this field”.
An overall approach is used to compare the two possible choices in 2012. This involves minimising the discounted sum at this date of all costs associated with nuclear electricity generation over the 2012- 2150 period. These costs include construction, operations and maintenance, fuel and decommissioning.
Window of opportunity in 2040
The choice of an electric utility to start building a new reactor technology presupposes that a certain number of stages have already been successfully completed. Since the ASTRID prototype is expected to start operating in 2025 (and feedback has to be collected before a first-off reactor can be built around 2030), the year 2040 is often taken as a marker in future scenarios signalling the start of a possible industrialisation of SFRs.
The study is placed within a French context without any technology exchanges outside its borders. Therefore, if no R&D is conducted in 2012, then it is assumed that there will be no Generation IV reactors in 2040. No other window of opportunity is considered in the model and the window of opportunity is fixed as in Henry’s value option models (1974). This model includes two periods (model with simple real options) contrary to the one that has been used in the past where an additional window of opportunity was foreseen in 2080 (see Taverdet-Popiolek and Mathonnière (2010) as mentioned earlier).
The first period ranges from 2012 to 2040 while the second ranges from 2040 to 2150.
Flexibility associated with the decision to conduct research
“We will know better about tomorrow than we know now about after tomorrow” wrote Henry, 1974, when he was citing one of the three conditions needed to use the real options theory, with the two others being “in an uncertain universe” and being faced with “choices of variable flexibility”.
As previously mentioned, the uncertainty on the price of uranium and the overcost associated with fast reactors as of 2040 actually determines their competitiveness. The higher budget is mainly due to the investment cost associated with fast reactors. The stricter safety standards will impact both technologies (fast and light water reactors) in the same manner.
LWR technology will be available, which means that uranium will still be used, even at a very high price.
The problem is to know whether the cost of flexibility is justified. This cost is the R&D subsidies for the SFR field to make sure that the technology is ready in 2040, regardless of its level of competitiveness.
Before calculating the costs associated with alternative decisions, the competitive area between the LWR and SFR technologies has to be determined.
Equivalence between LWR and SFR costs: a linear relationship
The following assumptions were used to define this zone of equivalence (Figure 1):
1. The annual electricity production is stable over the entire period of study. It is denoted by the letter (Q). The availability of LWRs and SFRs is supposed to be the same and will therefore have no influence on the electricity production (Q). There is a possibility that, being a less mature technology, SFRs should have more availability problems at least at the beginning of its exploitation, but this difference in performance levels can be taken into account in the SFR overcost.
2. With the uranium price equivalent to €100/ kg, the cost of uranium represents 5% of the total cost of an LWR. Even if the price of uranium grows, we suppose that there will be no notable technological progress to reduce the contribution of uranium to the total cost of an LWR.
The total cost of the LWR fleet needed to produce the annual quality of electricity (Q) (with the uranium price at €100/kg) is written “Cost LRW fleet100” (shortened to
“Cost LWR100”). As seen above, this total cost takes into account construction,
include the purchasing of uranium, conversion, enrichment, reprocessing, storage and shipment, minus any expected salvage value4.
If the price of uranium increases by p, then:
Cost LWRp = Cost LWR100 x (1+0.05p). (1)
3. The cost of an SFR does not depend on the uranium price, nor does it depend on the price of plutonium which is assumed to be free of charge in France. This last hypothesis is relevant in this particular context, since plutonium is generated by the reprocessing of LWR used fuel, which is a legal obligation in France. Its cost is thus usually considered to be negligible, but in most other contexts, it would be relevant to take a much higher cost into account (for instance in India, as in Suchitra and Ramana (2011)). The overcost of an SFR compared with an LWR is mainly due the higher investment cost. We nonetheless take into account the overcost that it represents over the total cost (investment, production, frontend and backend). In particular, the production cost of plutonium is included in this overcost. For this reason, cases of costly plutonium can be taken into account by considering higher SFR overcosts, which is illustrated by the simulations with higher SFR reactor overcosts.
Given that s represents the overcost of an SFR in relation to an LWR where uranium is worth €100/kg, then:
Cost SFR = Cost LWR100 x (1+s). (2)
We obtain the equivalence of the two methods of production when:
Cost LWR100 x (1+s) = Cost LWR100 x (1+0.05 p). (3)
4 We suppose, to simplify, that “Cost LWR100” does not depend on the uncertainly on nuclear waste storage
That is to say when:
s = 0.05 p (4)
The zone of equivalence is linear: a straight line that cuts the (p x s) graph in half: SFR competitive area and LWR competitive area from 2040.
Figure 1: SFR and LWR competitive areas from 2040 and line of equivalence for the two technologies from an economic viewpoint
Uncertainty
As previously mentioned, there is uncertainty both on the price of uranium from 2040 and on the overcost of SFRs.
Price of Uranium
The uranium price is estimated at €100/ kg for the first period. It is then assumed from 2040 onwards that it rises by p to remain stable throughout the second period. The rise, p, is expressed as a percentage of the price prior to 2040 and is assumed to follow a Gaussian distribution with a mean pm and a standard deviation σp.
Figure 2: Uranium price rise in 2040
SFR overcost
Over the second period and compared with an LWR in the first period, it is assumed that the SFR overcost follows a Gaussian distribution with a mean sm and a standard deviation σs.
Implication of introducing uncertainty in the model
As a consequence of introducing uncertainty in the form of Gaussian distributions for the uranium price and SFR overcost, the separation between the SFR and LWR competitive areas is no longer binary. The line of equivalence still represents the zone where SFRs and LWRs are equally competitive; there is, however, a non-zero probability that SFRs could be competitive in the LWR competitive area, which means that SFR integration could occur in the nuclear fleet, and vice versa.
Decision tree
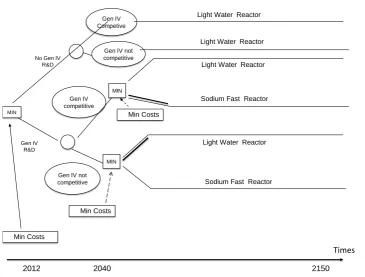
In 2012, the public authorities were faced with a decision tree (see Figure 3) where they had to choose between continuing research on future reactors or halting this research taking into account the impact of their choice on future costs. Continuing R&D opens a new window of opportunity in 2040, which involves choosing to build (or not) the innovative technology, with the decision being made in full knowledge of the facts, i.e. understanding its level of
Complete gain of information
in 2040
In 2012 uncertainty of
price level
U = 100 €/kg
2012 2040 2150
competitiveness compared with the other technology. The costs are calculated using a decision tree according to a backward induction method where the costs are minimised at every step (node) of the decision process.
Figure 3: Decision tree
Discounted cost of the decision to halt R&D
By refusing to conduct R&D in 2012, France limits itself to the LWR technology only. The first period is represented by the following interval: [T0 = 0 ; T1 = 28] while the second
by: [T1 = 28 ; T2 = 138].
The discount rate is expressed as a1 for the first period and as a2 for the second.
The total discounted cost over the entire duration during which research is not conducted (written Z) is expressed as follows:
Z = 𝐶𝐶𝐶𝐶𝐶𝐶𝐶𝐶��������(LWR)=
𝐶𝐶𝐶𝐶𝐶𝐶𝐶𝐶𝐿𝐿𝐿𝐿𝐿𝐿100�∫ 𝑒𝑒𝑇𝑇𝑇𝑇01 −𝑎𝑎1𝑡𝑡𝑑𝑑𝐶𝐶+∫ 𝑒𝑒𝑇𝑇𝑇𝑇12 −𝑎𝑎2𝑡𝑡𝑒𝑒(𝑎𝑎2−𝑎𝑎1)×27𝑑𝑑𝐶𝐶 ∫−∞∞(1 + 0,05𝑝𝑝)𝑓𝑓𝑝𝑝(𝑝𝑝)𝑑𝑑𝑝𝑝� (5) MIN
2012 2040
MIN
2150 Light Water Reactor
No Gen IV R&D
Gen IV R&D
Gen IV competitive
Gen IV not competitive
Min Costs
MIN
Gen IV Competive
Gen IV not competitive
Min Costs
Min Costs
Times
Light Water Reactor
Light Water Reactor
Light Water Reactor Sodium Fast Reactor
The limit applied is ]-∞ ; + ∞ [ for p is a price variation variable and can be negative. Nonetheless the level of pm and σp makes it mainly about positive values, representing a price
rise, which concerns mostly our case study.
The expression can be simplified by the following calculation:
∫-∞∞(1 + 0,05p)fp(p)dp = 1 + 0,05 pm (6)
This makes it possible to obtain a linear expression as a function of pm. Finally:
Z = 𝐶𝐶𝐶𝐶𝐶𝐶𝐶𝐶�������(LWR) =
𝐶𝐶𝐶𝐶𝐶𝐶𝐶𝐶𝐿𝐿𝐿𝐿𝐿𝐿100�∫ 𝑒𝑒𝑇𝑇𝑇𝑇01 −𝑎𝑎1𝑡𝑡𝑑𝑑𝐶𝐶+∫ 𝑒𝑒𝑇𝑇𝑇𝑇12 −𝑎𝑎2𝑡𝑡𝑒𝑒(𝑎𝑎2−𝑎𝑎1)×27𝑑𝑑𝐶𝐶 (1 + 0,05 𝑝𝑝𝑚𝑚)� (7)
It should be pointed out that the function 𝐶𝐶𝐶𝐶𝐶𝐶𝐶𝐶�������(LWR) is linear in relation to pm (mean
increase in the uranium price). It is independent of the standard deviation: this means that the cost of halting research remains the same regardless of the uncertainty on the uranium price rise.
To convert this total cost into a mean unit of annual cost, it must be divided by the quantity of electricity generated each year (Q) and discounted, i.e.:
Q [∫T1e-a1t
T0 dt +∫ e
-a2t
T2
T1 e
(a2-a1)×27dt]. (8)
The discount coefficient is then denoted as τ .
τ=∫T1e-a1t
T0 dt +∫ e
-a2t
T2
T1 e
Therefore the mean cost per unit of generated electricity is equal to:
Z
τQ (10)
Discounted cost of the decision to conduct R&D
The nuclear reactor fleet annually produces a quantity of electricity (Q):
- by means of the LWR technology prior to 2040,
- by means of the SFR technology after 2040 if it proves competitive, or otherwise by the LWR technology. For the diffusion of the SFR technology, we have to consider the limits of the fleet's capacity which does not allow for the immediate switch to the new technology (life time of LWR plants already in service, plutonium availability, etc.).
The cost of R&D over the period [T0 = 0 ; T1= 28] must be taken into account.
The letter (A) denotes this discounted cost:
𝑨𝑨= ∫ 𝒆𝒆𝑻𝑻𝟏𝟏 −𝒂𝒂𝟏𝟏𝒕𝒕
𝑻𝑻𝟎𝟎 𝑪𝑪𝑪𝑪𝑪𝑪𝒕𝒕𝑹𝑹&𝑫𝑫(𝒕𝒕)𝒅𝒅𝒕𝒕 (11)
The letter B represents the production cost during the first period (only for the LWR technology).
𝑩𝑩=𝑪𝑪𝑪𝑪𝑪𝑪𝒕𝒕𝑳𝑳𝑳𝑳𝑹𝑹𝟏𝟏𝟎𝟎𝟎𝟎 ∫ 𝒆𝒆𝑻𝑻𝑻𝑻𝟎𝟎𝟏𝟏 −𝒂𝒂𝟐𝟐𝒕𝒕𝒅𝒅𝒕𝒕 (12)
Let C be the discounted cost of production during the second period in the case where R&D has been launched in 2012:
𝐶𝐶 = 𝑒𝑒(𝑎𝑎2−𝑎𝑎1)×27𝐶𝐶𝐶𝐶𝐶𝐶𝐶𝐶𝐿𝐿𝐿𝐿𝐿𝐿100�𝑃𝑃 ∫ �∫0,𝑠𝑠05(1 + 0,05𝑝𝑝)𝑓𝑓𝑝𝑝
−∞ (𝑝𝑝)𝑑𝑑𝑝𝑝+∫ (1 +
∞ 𝑠𝑠 0,05 ∞
−∞
𝐶𝐶)𝑓𝑓𝑝𝑝(𝑝𝑝)𝑑𝑑𝑝𝑝� 𝑓𝑓𝑠𝑠(𝐶𝐶)𝑑𝑑𝐶𝐶+𝑃𝑃′ ∫−∞∞ (1 + 0,05𝑝𝑝)𝑓𝑓𝑝𝑝(𝑝𝑝)𝑑𝑑𝑝𝑝� (13)
with the parameters P and P’ expressing both the discounting and the progressive integration of SFRs. They are described in § 3.1.2.
Here again, the limit taken into account for s is ]-∞; + ∞ [ for s is a cost variation between the SFR cost and the LWR cost and can theoretically be negative. Since we consider an overcost, i.e. a positive variation, the level of sm makes it mainly about positive values.
Finally, the cost of the decision to conduct R&D in 2012 amounts to the sum of the three expressions, A, B and C:
𝑪𝑪𝑪𝑪𝑪𝑪𝑻𝑻
��������(𝑪𝑪𝑺𝑺𝑹𝑹𝑹𝑹&𝑫𝑫) = 𝑨𝑨+𝑩𝑩+𝑪𝑪 (14)
The mean cost per unit of generated electricity is:
A+B+C
τQ
(15)
Comparing the option value with the R&D amount
The two discounted costs need to be compared and the R&D amount needs to be defined for which both decisions “conduct R&D” or “halt R&D” are considered to be equivalent.
to conduct R&D (positive difference owing to the flexibility associated with the decision to conduct R&D) represents the limit not to be exceeded in terms of the R&D budget allocated to Generation IV fast reactors, i.e.:
Z – (B+C) (16)
An expense up to that amount Amax = Z – (B+C) in R&D for fast reactors, would be
justified from an economic point of view. Although there is no correlation in the model between the amount of the R&D budget and programme success, it is assumed that this amount (Amax) is the amount to be reasonably invested in research on Generation IV. It is
noted thereafter (A).
Strictly speaking, the value of the electricity produced by the prototype should be integrated into the R&D costs. We have not taken this aspect into account in order to simplify the model, which penalises the decision to conduct R&D.
RESULTS AND SIMULATIONS
This section describes the results of numerical applications and simulations performed using the model.
Firstly, the assumptions defining all the parameters of the model are detailed, i.e. : i) nuclear electricity production (Q) which is assumed to be stable, ii) annual cost of the LWR fleet (Cost LWR fleet100), iii) discount rate for the first and second period, iv) proportion of
SFRs in the fleet and its progress over time, v) means and standard deviations of probability density functions, vi) overcost of SFRs, and vii) uranium price rise.
the model (mean of the overcost and of the uranium price rise, uncertainty, discount rate, etc.) so as to visualise different decision-making contexts.
Assumptions of the Model Parameters
Nuclear electricity production and discounting
Our study was based on the total annual costs for an entire fleet producing a quantity Q = 430 TWh of electricity. The total annual cost of the LWR fleet is: Cost LWR fleet100 = €20 G
The discount rate applied is the public rate in France (see Lebègue et al., 2005): a1 = 4%
before 2040 and a2 = 2% after 2040. Such a discount rate takes into account a gradual
decrease for the evaluations which are relating to the very long term.
SFR integration
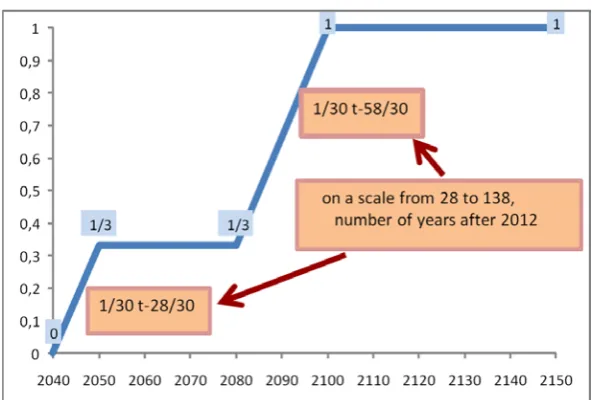
The progressive integration of SFRs into the fleet from 2040 is taken into account on the basis of past LWR constructions, their life spans and the available plutonium resources for SFRs. Four periods are taken into consideration as shown in Figure 4.
The following expressions, P and P’, take into account SFR integration assumptions and discounting:
P = ∫ �T1' 301t-2830�
T1 e-0,02tdt +∫
1 3e-0,02t T1''
T1' dt +∫ �
1
30
t-58
30�
T1'''
T1'' e
-0,02tdt +∫T2e-0,02t
T1''' dt (17)
𝑷𝑷′=∫ 𝒆𝒆𝑻𝑻𝟐𝟐 −𝟎𝟎,𝟎𝟎𝟐𝟐𝒕𝒕
𝑻𝑻𝟏𝟏 𝒅𝒅𝒕𝒕 − 𝑷𝑷 (18)
With T1 = 28, T’1 = T1+10 = 38, T’’1 = T’1+30 = 68, T’’’1 = T’’1+20 = 88, T2 = 138.
Reference assumptions for the probability density functions
The uranium price rise, p, is given as a percentage of the price during the first period and is assumed to follow a Gaussian distribution with a mean pm = 240% and a standard deviation
σp of 100%. Over the period [T1 = 0 ; T2 = 138], the SFR overcost, s, follows a Gaussian
distribution with a mean sm= 12% and standard deviation σs equivalent to 1/30, i.e. 3.33%.
This combination of mean values for the distributions s and p was chosen as follows:
- The mean of the s distribution is based on an expert analysis in which the SFR overcost is estimated in relation to the LWRs in service during the first period. The investment item generates the overcost, with the other items remaining almost the same. Assuming that uranium costs €100/kg and in light of this overcost, the assessment of the overall overcost (construction, operations and maintenance, fuel and decommissioning) amounts to 12%.
- Once sm has been calculated, pm (mean of the p distribution) is chosen so that the (pm,
sm) combination is located on the line of equivalence for both technologies sm = 0.05
pm, which leads to a pm of 240%.
Results for reference case
The numerical applications were performed with the Maxima software.
𝐶𝐶𝐶𝐶𝐶𝐶𝐶𝐶
�������(𝐿𝐿𝐿𝐿𝐿𝐿)= Z = 668,4 G€ see (7)
An annual cost of Z
τQ = €49.12 per MWh with τ= 31,64 was deduced,see (10)
𝐶𝐶𝐶𝐶S𝐶𝐶
�������( 𝐶𝐶𝑆𝑆𝐿𝐿𝐿𝐿&𝐷𝐷𝑑𝑑𝑒𝑒𝑑𝑑𝑑𝑑𝐶𝐶𝑑𝑑𝐶𝐶𝑑𝑑) = B + C = €664.9 G
An annual cost of €48.87 per MWh was deduced.
Considering the model’s simplifying assumptions, with a mean uranium price rise predicated at 240% and an mean overcost of 12% for SFRs compared with LWRs (with moderate uncertainty on these two random variables), the public authorities will be able to spend up to €3.5 G for research on future reactors (see ref. (16)).
It is worth varying the model’s parameters to observe the variation in the amount that the public authorities are willing to spend on R&D and to map these variations. As we said in the introduction, the purpose of the study is to illustrate different scenarios of uranium price variation and SFR overcosts, rather than building forecasts based on these parameters.
Results of Simulations
Probability of SFR integration in the nuclear fleet
As mentioned in 2.5, uncertainty introduces non-zero probability of having competitive SFRs in the LWR competitive area and vice versa. Before calculating the research amount available in different decision contexts, the study of such probabilities can give a first assessment of SFR or LWR potential.
Probability of not having competitive SFRs = ∫ �∫ 𝑓𝑓𝑝𝑝
𝑠𝑠 0,05
−∞ (𝑝𝑝)𝑑𝑑𝑝𝑝� ∞
−∞ 𝑓𝑓𝑠𝑠(𝐶𝐶)𝑑𝑑𝐶𝐶 (19)
Probability of having competitive SFRs = ∫ �∫ 𝑓𝑓∞𝑠𝑠 𝑝𝑝
0,05 (𝑝𝑝)𝑑𝑑𝑝𝑝� ∞
−∞ 𝑓𝑓𝑠𝑠(𝐶𝐶)𝑑𝑑𝐶𝐶 (20)
The sum of the two terms is of course 1.
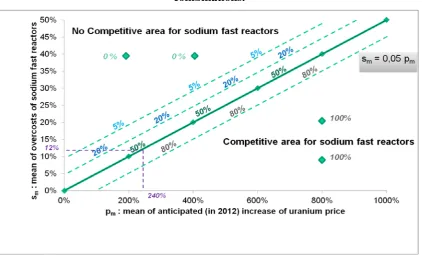
The figure below shows the results of the calculation of the probability to have competitive SFRs in the case of different (pm, sm) combinations, the standard deviations being
the same as in the reference case (σp = 100%, σs = 3.33%). The probability to have
competitive LWRs can be easily deduced.
The probability on the equivalence line is 50%. One striking results is that on each line parallel to this equivalence line the probability remains the same. (pm, sm) combinations that
are located very far from the equivalence line on the (pm x sm) graph reach extreme values
(100% or 0%). Far enough from the equivalence line, the uncertainty tends to disappear.
Figure 5: Probability of introducing SFRs in the nuclear fleet for different (pm, sm)
combinations.
Simulations were performed with (pm, sm) combinations that differed from the reference
combination but with the same standard deviations (σp,σs). These simulations are used to
determine the maximum amount (A) that would be allocated to R&D according to the different positions on the graph (pm x sm):
- on the LWR-SFR line of equivalence, - in the LWR competitive area,
- in the SFR competitive area.
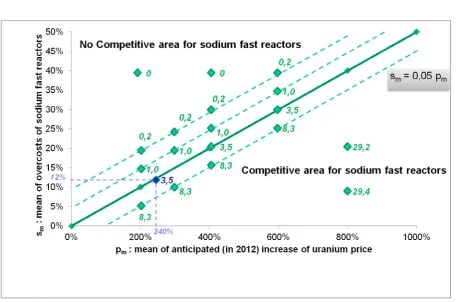
Figure 6 shows the results of these simulations: the maximum amount (A) (in €G) is indicated for each combination.
Figure 6: Simulation results: mapping values of (A) in €G
when moving away from the line of equivalence into the SFR non-competitive area and increasingly higher when going in the other direction.
It is also worth pointing out that practically the same amount (A) allocated to R&D is found for the (pm, sm) combinations located on the line of equivalence. By
extrapolating this observation, it can be seen that the same amount (A) is allocated to research for each line parallel to the line of equivalence for all combinations belonging to this line, like it was observed in 3.3.1 in the calculation of probabilities of having competitive SFRs. At the same level of uncertainty, the amount allocated to R&D is determined by the relationship between pm and sm.
Expected gain due to overcost reduction
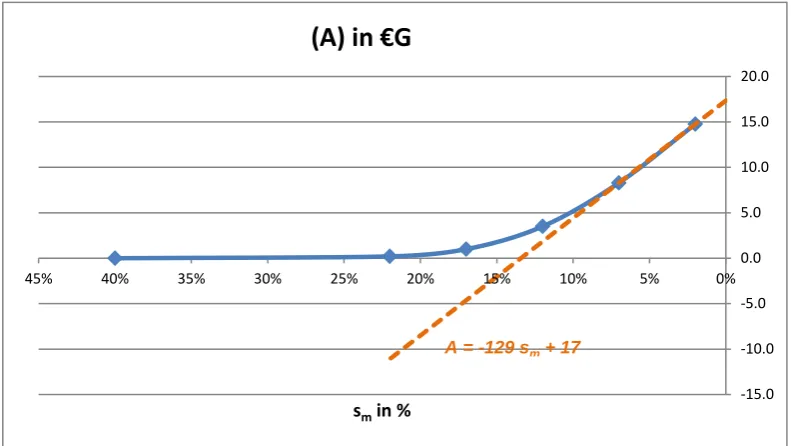
The results of the simulations in Figure 6 (see 4.3.2) show how (A) may vary depending on the SFR technology anticipated overcost mean sm. The graph below, in Figure 7, shows
the variation of (A) in the reference case for the rise of uranium price (pm = 240%) and with
the overcost mean sm varies between 2% and 40%.
Figure 7: Variation of (A) versus the anticipated overcost mean sm (pm = 240%)
-15.0 -10.0 -5.0 0.0 5.0 10.0 15.0 20.0
0% 5%
10% 15%
20% 25%
30% 35%
40% 45%
smin %
(A) in €G
The curve shows that there will be no budget for R&D for SFR overcost means sm above
20%. For SFR overcost means below 20%, however, the greater the SFR overcost reduction, the higher the amount (A) allocated to R&D. For instance, reducing the overcost from 12% to 7% increases this cost gain by €4.8 G (from €3.5 G to €8.3 G), whereas reducing the overcost from 7% to 2% increases this cost gain by €6.5 G (from €8.3 G to €14.8 G).
A linear zone is identified on the curve for overcost mean values below 10%: in this zone, the slope is approximately 130, which means reducing the overcost mean by a 1% step increases (A) by €1.3 G.
This demonstration is based on the assumption that the probability law followed by SFR overcost is not correlated to the budget for R&D invested in this technology.
In decision theory, it is called exogenous uncertainty. Such a simplifying assumption is quite crucial because in reality, part of the R&D budget is allocated to cost reduction: sm
depends on (A). However, we did not endogenise the budget for R&D in the model, considering that most of the budget of the program for ASTRID is not focused on cutting costs and it remains an unavoidable risk (and exogenous) attached to the cost of the new reactor.
Influence of the discount rate
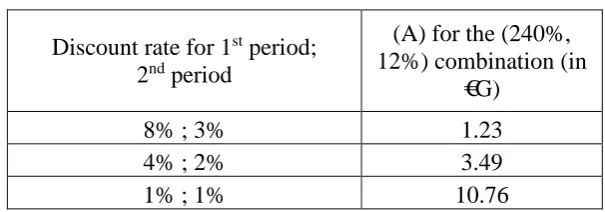
A public rate was chosen for the discount rate during the first and second period in the model, i.e. 4% before 2040 and 2% thereafter. This section takes into account two different scenarios:
- a scenario with higher discount rates in case the decider is a private investor: a1 = 8%
- a scenario with lower discount rates to represent an extreme case where the preference for the present day is very low: a1 = 1% for the first period and a2 = 1% for the second
one.
These scenarios concern the reference combination (240%, 12%).
Table 1: Influence of discount rates (reference combination)
Discount rate for 1st period;
2nd period
(A) for the (240%, 12%) combination (in
€G)
8% ; 3% 1.23
4% ; 2% 3.49
1% ; 1% 10.76
It can be seen that the application of the higher discount rates results in a lower R&D maximum amount, whereas the extremely low discount rates lead to a much higher R&D maximum amount. As R&D investment bears its fruit in the long term, it is logical that a high discount rate – with preference to the present day – reduces the relevance of such an investment.
Influence of the electricity production
The electricity production (Q) has a direct impact on the cost of the nuclear fleet: Cost LWR100 represents a total production cost and is determined so as to follow the same
variations as (Q). The total fleet cost has therefore been modelled by disregarding the effect of any economies of scale in the case of increased production and thus increased fleet size. Nor does it take into account any possible impact of an increased fleet size on the integration of SFRs: the parameters P and P’ are therefore assumed to remain unchanged. If the electricity production (Q) doubles, the Cost LWR100 also doubles and consequently so does
the maximum amount (A) allocated to R&D since it is proportional to the Cost LWR100.
Similarly, if the electricity production (Q) diminishes, so does the maximum amount (A) allocated to R&D. Given the French government’s objective to reduce the share of nuclear energy in national electricity generation5, such a reduction in the electricity production (Q) from nuclear power plants could occur: the amount (A) should then proportionally decrease.
Influence of the uranium cost on the overall fleet cost
Based on the model assumptions, the fraction of the uranium cost in the total LWR fleet cost is set at 5%. The highest fraction for the uranium cost found in literature was equivalent to 7%. The maximum amount (A) is calculated on the basis of a uranium cost of 7% instead of 5%6.
𝐶𝐶𝐶𝐶𝐶𝐶𝐶𝐶
�������(𝐿𝐿𝐿𝐿𝐿𝐿)= Z = 668,4 G€ (7)
An annual cost of Z
τQ= €49.12 per MWh with τ= 31,64 was deduced. (10)
𝐶𝐶𝐶𝐶S𝐶𝐶
�������(𝐶𝐶𝑆𝑆𝐿𝐿𝐿𝐿&𝐷𝐷𝑑𝑑𝑒𝑒𝑑𝑑𝑑𝑑𝐶𝐶𝑑𝑑𝐶𝐶𝑑𝑑) = B + C = 663,9 G€ (without 𝐿𝐿&𝐷𝐷𝑑𝑑𝐶𝐶𝐶𝐶𝐶𝐶)
instead of €664.90 G in the reference case.
An annual cost of €48.87 per MWh was deduced.
The difference between the two costs, i.e. €4.5 G (16), gives the maximum amount (A) that the authorities would rationally spend on SFR R&D. This amount is higher than that obtained for the reference case assuming the cost of uranium to represent 5% of the overall cost of the fleet. This result is consistent insofar as a higher uranium cost (with a mean overcost sm fixed
at 12%) would render LWRs more sensitive to a uranium price increase, which would thus make SFRs more economically interesting.
5See governmental Law (2015) on energy transition which sets the objective to bring the share of nuclear in French
electricity production down to 50% in 2025.
6 Based on the assumption of a uranium cost equal to 7% instead of 5%, a line of equivalence between LWRs and SFRs of
the equation:
s = 0.07 p
SOPHISTICATION OF THE MODEL: ENDOGENOUS URANIUM PRICE
Strictly speaking, the progress of SFRs will have an impact on the risk of the natural uranium price: it should relieve the pressure on the price of this natural resource if the SFR technology catches on. Therefore, it is logical to assume that the mean of the Gaussian distribution pm should decrease.
Since our study only considers the French fleet, which should have little influence on the international uranium market, such an assumption is acceptable.
Nonetheless, if SFR integration occurs in the French fleet in 2040, it would be likely to take place in other nuclear countries within the following decades, entailing a more significant impact on uranium price.
The total acquisition of information in 2040 on the uranium price for the entire second period is also an extremely simplifying assumption.
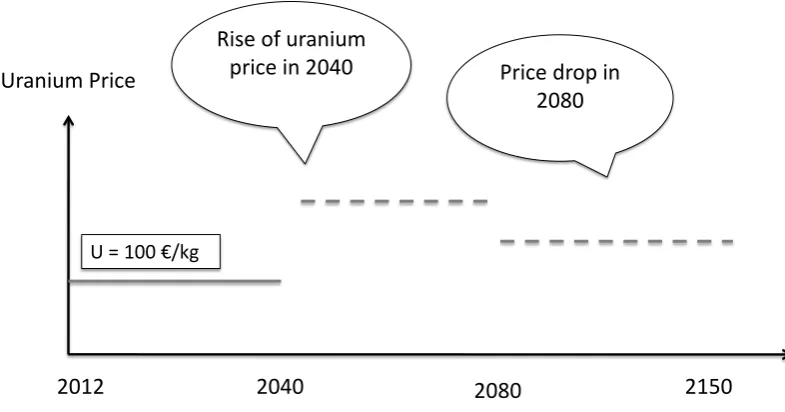
We propose a sophistication of the model to take this effect into account. In the case of SFR integration in the fleet, a price drop would occur in 2080 starting a third period in the uranium price timeline (see Figure 8).
Figure 8: Price drop in 2080 in case of SFR integration
Rise of uranium
price in 2040 Price drop in
2080
U = 100 €/kg
2012 2040 2150
Uranium Price
Instead of having two period from 2012 to 2040: [T0 = 0 ; T1 = 28] and from 2040 to 2150:
[T1 = 28 ; T2 = 138], there are now three periods :
- the first is still the same [T0 = 0 ; T1 = 28],
- the second one is from 2040 to 2080: [T1 = 28 ; T1’’= 68],
- and the third one from 2080 to 2150: [T1’’= 68; T2 = 138], where the price drop can
possibly occur.
In the calculation of the option value of research for SFRs, changes are made on term C, which is the discounted cost of production during the second period in the case where R&D has been launched in 2012. In the endogenous model, the calculation remains the same for the second period [2040; 2080], but introduces a probability of a price drop in the third period [2080; 2150]. The cost for this third period is thus composed of the sum of two terms of cost:
- one using the same uranium price mean pm as in the previous period, multiplied by
the probability of not having competitive SFRs : this term represents the case in which SFRs were not competitive during the second period, and did not develop, having not influence in the predicted evolution of uranium price;
- the other using a lower uranium price mean pm’ multiplied by the probability of
having competitive SFRs : this term represents the case in which SFRs were competitive during the second period, were integrated in the nuclear fleet and provoked a drop in uranium price.
Detailed calculation is given in Annex D.
For a simple modelling, we suppose that the uranium price mean pm’ of the third period is
Two hypotheses have been made for the value of pm’ the uranium price mean in case of price
drop:
- a low hypothesis considering a modest price drop of 10%, i.e. pm’ = 90% pm .
- a higher hypothesis considering a price drop of 30% i.e. pm’ = 70% pm. Such a
hypothesis corresponds to the case when SFR integration in France is the reflection of a larger SFR integration in the international fleet.
The following figures show simulations on a few (pm, sm) combinations in both high and
low hypothesis.
Figure 10: Simulations with endogenous uranium price – 30% price drop in third period
i.e. pm’ = 70% pm
The simulations show that a drop in the uranium price due to SFR development increases the amount (A) available for research and development. Such a result is quite logical since the drop in the uranium price in the third period reduces the cost of the SFR and LWR fleet. The greater the price drop, the more the amount (A) increases (see the comparison between Figure 9 and Figure 10).
As a result of this endogenous model, not only does R&D on Generation IV offer a competitive alternative in case of a sharp rise in the uranium price, it also improves the competitiveness of LWRs through the feedback effect of SFR development on the uranium market and thus the competitiveness of the whole nuclear sector.
DISCUSSION AND CONCLUSION
Faced with uncertainty on the future price of uranium and the SFR overcost, the option value associated with the decision to conduct research is non-zero, even in the area where there is a significant risk of SFRs not being competitive. Uncertainty and increasing information over time generate the option value.
This is also equal to the maximum budget that the authorities are willing to invest in R&D. It is estimated at €3.5 G based on the reference assumptions for the model which assesses the mean overcost of SFRs at 12% compared with LWRs. This takes into account the case where the probability of SFRs being competitive is equal to the probability of LWRs being competitive (50%), which corresponds to a mean uranium price increase of 240%.
With all other assumptions being equal, if the mean overcost of SFRs is increased by a 5% increment i.e. 17% instead of 12% (meaning they are not competitive), the maximum budget allocated to R&D is reduced to €1 G. If the mean overcost of SFRs is lowered by a 5% increment (meaning they are considered competitive in relation to LWRs), this maximum budget for R&D amounts to €8.3 G.
In the same way, all else being equal, if the mean uranium price increase is a 100% increment higher (SFRs are competitive), the maximum budget for R&D amounts to €8.3 G. If the mean uranium price increase is a 100% increment lower (SFRs are not competitive), this maximum budget for R&D amounts to €1 G.
€3.5 G. However, the discount rates of 1% during the first and second period result in an R&D amount equal to €10.8 G, which is considerably higher than that for the reference case.
In order to take into account feedback of SFR integration on the uranium market, a sophistication of the model was elaborated taking into account a possible drop in the uranium price after a period of SFR development (“state maker” decider, see S. Ramani and Richard (1993). Simulations show that introducing the possibility of a drop in the uranium price increases the budget available for R&D on Generation IV reactors. This is logical since the hypothesis of a possible uranium price drop makes the discounted cost of LWRs and SFRs decrease, while the cost of the LWR fleet without R&D does not change: the maximum budget for R&D, which is the difference between these two costs, thus increases. In the reference case, the maximum budget available for R&D rises from €3.5 to € 4 G when the uranium price mean pm drops by 10%, and rises again to € 5 G when the uranium price mean
drops by 30%. The remarkable conclusion we can draw from this endogenous model is that choosing to lead R&D on SFRs will also be beneficial to the competitiveness of LWRs.
No matter how informative, it nevertheless remains true that these preliminary results have been produced by a simplified economic model that will need to be further developed in order to continue our research.
considering their advantages in terms of waste toxicity, will SFRs have a better chance of being accepted? The cost of safety will rise significantly. This will also have an impact on both LWRs and SFRs, which is why it has no impact on our results.
In terms of methodology, another limit is that there is no link between the amount of R&D and the uncertainty about the overcosts of innovation: the probability law followed by the additional cost of the fourth generation reactor compared to LWR is not correlated to the research budget invested in this technology (exogenous uncertainty). However, the SFR overcost should be lowered as much as the R&D effort to reduce cost has been significant. An endogenous model where probability densities are determined by the initial decision should have been used as it has been with the uranium price. If we make additional R&D to reduce costs, the additional cost of SFR compared to LWR would be more likely lower. Moreover, the valuation of the electricity produced by the prototype should be integrated into the R&D costs.
Lastly, restricting our study to France is, of course, only an approximation of the reality since technology exchanges between countries should be taken into account. Notice that one high-powered Russian SFR has just started in Russia and another one will start in the coming years in India (World Nuclear Association, 2015).
The case of a free rider who profits from the effects of R&D without contributing to its funding should be taken into consideration. However, it is very unlikely that France would behave as a free rider in light of its behaviour in the past. The limit is nevertheless still valid for the endogenous model that takes into account the world uranium market.
REFERENCES
Arrow K.J., Fischer A.C. (1974) ‘Environmental Preservation, Uncertainty and Irreversibility,’ Quarterly Journal of Economics 88, May, pp. 312-319.
Black F., Scholes M. (1973) ‘The Pricing of Options and Corporate Liabilities,’ Journal of Political Economy 81, May-June, pp. 637-654.
Barria C., Rudnick H. (2011) ‘Investment under uncertainty in power generation: integrated electricity prices modelling and real options approach,’ Latin America Transactions 9, pp. 785-792.
Bobtcheff C. (2006) ‘Essays in Investment Theory,’ PhD, Toulouse I University, 216 p. Cardin M.A., de Neufville R. (2008) ‘A survey of state of the art methodologies and a framework for identifying and valuing flexible design opportunities in engineering systems,’
Working Paper, Massachusetts Institute of Technology, Cambridge.
Cardin M.A., Steer S.J., Nuttall W.J., Parks G.T., Gonçalves L.V.N. and de Neufville R. (2010a) ‘Minimizing the Cost of Innovative Nuclear Technology Through Flexibility: The Case of a Demonstration Accelerator-Driven Subcritical Reactor Park,” Cambridge Working Papersin Economics, Faculty of Economics, University of Cambridge.
Davis G., Owens B. (2003) ‘Optimizing the level of renewable electric R&D expenditures using real options analysis,’ Energy Policy 31, pp.1589–1608.
Epaulard A., Gallon S. (2001) ‘La valorisation du projet nucléaire EPR par la méthode des options réelles,’ Economie et Prévision 149(3), pp.29-50.
Fernandes B., Cunha J., Ferreira P. (2011) ‘The use of real options approach in energy sector investments,’ Renewable and Sustainable Energy Reviews 15: Iss. 9, pp.4491-4497.
Guillerminet M.L. (2002) ‘La décision d’investissement et son financement dans un environnement institutionnel en mutation: le cas d’un équipement électronucléaire,’ Les Cahiers du Creden 02.09.35.
Henry C. (1974a) ‘Option Value in the Economics of Irreplaceable Assets,’ Review of Economic Studies, Symposium on the economics of exhaustible resources, pp. 89-104.
Henry C. (1974b) ‘Investment Decision under Uncertainty: the Irreversible Effect,’ American Economic Review 64, pp. 1006-1012
Huchzermeier A., Loch C.H. (2001) ‘Project management under risk: using the real options approach to evaluate flexibility in R&D,’ Management Science 47 (1), pp. 85-101.
International Energy Agency and Nuclear Energy Agency (2014) Red Book Uranium: Resources, Production and Demand, OECD/NEA.
Ionescu O., Heraud J.A. (2011) ‘The radioactive waste disposal: the contribution of economic analysis,’ Energy Studies Review 18: Iss. 2, Article 1.
Ionescu O., Spaeter S. (2011) ‘Reversibility and switching options values in the geological disposal of radioactive waste,’ Real options 15th Annual International Conference, Turku, Finland.
Kahouli S. (2012) ‘The effects of uranium price fluctuations on production, exploration, expenditures and reserves: VAR approach,’ Energy Studies Review 19: Iss. 1, Article 3. Khalfallah, M.H. (2009) ‘Long-term Capacity Adequacy in Electricity Markets: Reliability Contracts vs Capacity Obligations,’ Energy Studies Review 16: Iss. 2, Article 2.
Kjærland F. (2007) ‘A real option analysis of investments in hydropower - The case of Norway,’ Energy Policy 35, pp.5901–5908.
Kjærland F., Larsen B. (2009) ‘The value of operational flexibility by adding thermal to hydropower a real option approach,’ In: 9th annual real options international conference, Portugal and Spain.
Kumbaroglu G., Madlener R., Demirel M. (2006) ‘A real options evaluation model for the diffusion prospects of new renewable power generation technologies,’ Energy Economics 30, pp.1882–1908.
Landauro, I. 2015. ‘EDF Postpones Flamanville Nuclear Reactor Startup to 2018,’ Wall Street Journal, September 3, sec. Business.
Lee S.C., Shih L.H. (2010) ‘Renewable energy policy evaluation using real option model - The case of Taiwan,’ Energy Economics 32, S67–S78.
Lebègue D., Hirtzman Ph., Baumstark L. (2005) ‘Le prix du temps et la décision publique,’
Le Plan, La documentation française.
Liu G., Wen F., MacGill I. (2011) ‘Optimal timing for generation investment with uncertain emission mitigation policy,’ European Transactions on Electrical Power 21, pp. 1015–1027 Madlener R., Kumbaroglu G., Ediger V. (2005) ‘Modeling technology adoption as an irreversible investment under uncertainty: the case of the Turkish electricity supply industry,’
Energy Economics,27, pp. 139-163.
Madlener R., Stoverink S. (2011) ‘Power plant investments in the Turkish electricity sector: A real options approach taking into account market liberalization,’ Applied Energy 97, pp. 124-134.
Martinez-Ceseña E.A., Mutale J. (2012) ‘Wind Power Projects Planning Considering Real Options for the Wind Resource Assessment,’ Sustainable Energy, IEEE Transactions 3, no 1, pp.158-166.
Martinez-Ceseña E.A., Rivas Davalos F. (2011) ‘Evaluation of investments in electricity infrastructure using real options and multiobjective formulation,’ IEEE Latin America Transactions 9, pp. 767–773.
Martínez-Ceseña E.A., Mutale J. (2011) ‘Application of an advanced real options approach for renewable energy generation projects planning,’ Renewable and Sustainable Energy Reviews15: Iss. 4, pp. 2087-2094.
Martinez-Ceseña E.A., Mutale J. (2012) ‘Wind power projects planning considering real options for the wind resource assessment,’ IEEE Transactions on Sustainable Energy 3, pp. 158-166.
Merton R.C. (1973) ‘Theory of Rational Option Pricing,’ Bell Journal of Economics and Management Science, The RAND Corporation 4, no1, pp.141-183.
MIT (2012) ‘The future of nuclear power after Fukushima,’ MIT Publication
Ostertag K., Llerena P., Richard A. (2004) ‘Option Valuation for energy issues, Institut Systemtechnik und Innovationsforschung,’ Fraunhofer IRB Verlag, 179 p.
Perlitz M., Peske T., Schrank R. (2002) ‘Real options valuation: the new frontier in R&D project evaluation?,’ R&D Management 29: Iss. 3, pp. 255-270.
Ramani S., Richard A. (1993) ‘Decision, Irreversibility and Flexibility: the Irreversibility Effect Re-examined,’ Theory and Decision 35, p. 259-276.
Reedman L., Graham P., Coombes U. (2006) ‘Using a Real-Options Approach to Model Technology Adoption Under Carbon Price Uncertainty: An Application to the Australian Electricity Generation Sector,’ Economic Record 82: Iss. Supplement s1, pp. S64–S73.
Roques F., Nuttall W., Newberry D., De Neufville R., Connors S. (2006) ‘Nuclear power: a Hedge against Uncertain Gas and Carbon Prices?,’ The Energy Journal 27 n°4, pp. 1-24. Rothwell G. (2006) ‘A real options approach to evaluating new nuclear power plants,’ The Energy Journal 27, n°1, pp. 37-53.
Suchitra J.Y., Ramana M.V. (2011) ‘The costs of power: plutonium and the economics of India's prototype fast breeder reactor,’ Int. J. of Global Energy Issues 35, n°1, pp.1-23.
Siddiqui A.S., Marnay C., Wiser R.H. (2007) ‘Real options valuation of US federal renewable energy research, development, demonstration, and deployment,’ Energy Policy 35, pp. 265–279.
Taverdet-Popiolek N., Mathonnière G. (2010) ‘Analyse économique de la valeur de la R&D dans le domaine des réacteurs rapides: analyse simplifiée et modélisation sous l’hypothèse d’une augmentation à terme du prix de l’uranium naturel,’ Revue de l’énergie 595, mai-juin. Taverdet-Popiolek N. (2010) ‘Investissement dans une centrale électrique au charbon et contrainte CO2: que nous disent les modèles de décision dans le risque?,’ Revue de l’Energie
593, janvier-février.
Wang J., Hwang W.L. (2005) ‘A fuzzy set approach for R&D portfolio selection using a real options valuation model,’ Omega 35, pp. 247- 257.
ANNEXES
These annexes consist in various simulations studying the influence of standard deviations: proportional to the mean, relative influence of σp and σs, results with very small
standard deviations. Detailed calculation of the maximum budget for R&D in the endogenous model is also presented in these annexes.
Annex A. Simulations with standard deviations proportional to the mean
In 3.3.2 simulations were performed to assess the amount (A) allocated to R&D with different (pm, sm) combinations but with the same standard deviations (σp,σs) :
- σp = 1 = 100%
- σs = 1/30 = 10/3% ≈ 3.33%
This was the case for all simulations, representing the same absolute uncertainty for all combinations. It may be worth considering the same combinations with a relative uncertainty, i.e. varying the standard deviation in proportion to the mean. In order to vary the standard deviations based on the reference values established by the previous simulations: σp = 100%
and σs = 10/3%, we assigned these reference values to the (400%, 20%) combination which
Table A.1: Standard deviations varied in proportion to the mean
pm
mean uranium price rise
σp
standard deviation of the p distribution
sm
mean
SFR overcost
σp
standard deviation of the s distribution
200% 50% 10% 10/6%
240% 60% 12% 2%
400% 100% 20% 10/3%
600% 150% 30% 5%
800% 200% 40% 20/3%
Figure A.1: Simulation results with proportional standard deviations ((A) given in €G)
Annex B. Influence of standard deviations σs and σp
In order to refine the results obtained with the standard deviations varying proportionally with the means, another set of simulations were performed by varying the standard deviations for the reference combination (240%, 12%) so as to detect the sensitivity of the maximum amount (A) to the standard deviation for any given combination. The table below shows the results obtained by varying σp(uncertainty on the uranium price rise) with σs (uncertainty on
the SFR overcost) remaining constant on the one hand, and by varying σswith σp remaining
constant on the other hand.
Table B.1: Influence of standard deviations on the amount (A) (reference combination)
σp
standard deviation of the p distribution (uranium price rise)
Maximum amount (A) for R&D (€G)
σp
standard deviation of the s distribution (SFR overcost)
Maximum amount (A) for R&D (€G)
5% 0.12 1/12% 2.91
10% 2.10 1/6% 2.91
50% 2.42 10/6 % 3.07
100% 3.49 10/3 % 3.49
200% 6.13 10/15 % 4.85
500% 14.68 100/6% 10.23
The amount (A) for the reference case (240%, 12%) follows the variations of the standard deviation: (A) rises when the standard deviation rises and (A) drops when the standard deviation drops. Again, it is the uncertainty that creates the R&D value with a mean fixed for the uranium price rise and the SFR overcost.
Annex C. Results with low uncertainty
On the line of equivalence for the old and new technology as well as in the SFR non-competitive area, the budget allocated to R&D reduces drastically when uncertainty tends towards zero. In the SFR competitive area, this budget also decreases when uncertainty tends towards zero but remains in the range of several dozen €G.
Annex D. Detailed calculation for endogenous model
This annex gives the details of the calculation of the term C in the research option value in the endogenous model.
As said in 4., instead of having two periods from 2012 to 2040: [T0 = 0 ; T1 = 28] and
from 2040 to 2150: [T1 = 28 ; T2 = 138], there are now three periods :
- the first is still the same [T0 = 0 ; T1 = 28],
- the second one is from 2040 to 2080: [T1 = 28 ; T1’’= 68],
- and the third one from 2080 to 2150: [T1’’= 68; T2 = 138], where the price drop can
possibly occur.
In the reference model formula, the terms P and P’ take into account SFR integration assumptions and discounting during the second period from 2040 to 2150 [T1 = 28; T2 =
138]. In the endogenous model the proportion of SFRs due to SFR integration assumptions is to be considered on the second and third period.
During the second period, from 2040 to 2080 [T1 = 28; T1’’= 68],
P2= ∫ �T1 301 t-2830�
'
T1 e-0,02tdt +∫
1 3e-0,02t T1''
T1' dt (D.1)
𝑷𝑷𝟐𝟐′=∫ 𝒆𝒆𝑻𝑻𝟏𝟏 −𝟎𝟎,𝟎𝟎𝟐𝟐𝒕𝒕
′′
𝑻𝑻𝟏𝟏 𝒅𝒅𝒕𝒕 − 𝑷𝑷𝟐𝟐 (D.2)
P3= ∫ �T1 301 t-5830�
'''
T1'' e-0,02tdt +∫TT2e-0,02t
1
''' dt (D.3)
𝑷𝑷𝟑𝟑′=∫ 𝒆𝒆𝑻𝑻𝟐𝟐 −𝟎𝟎,𝟎𝟎𝟐𝟐𝒕𝒕
𝑻𝑻𝟏𝟏′′ 𝒅𝒅𝒕𝒕 − 𝑷𝑷𝟑𝟑 (D.4)
With T1 = 28, T’1 = T1+10 = 38, T’’1 = T’1+30 = 68, T’’’1 = T’’1+20 = 88, T2 = 138.
As said in 4., changes are made on term C, which is the discounted cost of production during the second period in the case where R&D has been launched in 2012. In the endogenous model, the calculation remains the same for the second period [2040; 2080] but introduces a probability of a price drop in the third period [2080; 2150].
The cost of the second period is thus:
𝑒𝑒(𝑎𝑎2−𝑎𝑎1)×27𝐶𝐶𝐶𝐶𝐶𝐶𝐶𝐶𝐿𝐿𝐿𝐿𝐿𝐿100∗ �𝑃𝑃2∫ �∫0,𝑠𝑠05(1 + 0,05𝑝𝑝)𝑓𝑓𝑝𝑝
−∞ (𝑝𝑝)𝑑𝑑𝑝𝑝+∫ (1 +
∞ 𝑠𝑠 0,05 ∞
−∞
𝐶𝐶)𝑓𝑓𝑝𝑝(𝑝𝑝)𝑑𝑑𝑝𝑝� 𝑓𝑓𝑠𝑠(𝐶𝐶)𝑑𝑑𝐶𝐶+𝑃𝑃′2∫−∞∞(1 + 0,05𝑝𝑝)𝑓𝑓𝑝𝑝(𝑝𝑝)𝑑𝑑𝑝𝑝� (D.5)
The cost for this third period is however composed of the sum of two terms of cost:
- one using the same uranium price mean pm as in the previous period, multiplied by
the probability of not having competitive SFRs : this term represents the case in which SFRs were not competitive during the second period, and did not develop, having not influence in the predicted evolution of uranium price:
𝑒𝑒(𝑎𝑎2−𝑎𝑎1)×27𝐶𝐶𝐶𝐶𝐶𝐶𝐶𝐶𝐿𝐿𝐿𝐿𝐿𝐿100∗ ∫ �∫ 𝑓𝑓𝑝𝑝 𝑠𝑠 0,05
−∞ (𝑝𝑝)𝑑𝑑𝑝𝑝� ∞
−∞ 𝑓𝑓𝑠𝑠(𝐶𝐶)𝑑𝑑𝐶𝐶 �𝑃𝑃3∫ �∫ (1 + 0,05𝑝𝑝)𝑓𝑓𝑝𝑝 𝑠𝑠
0,05
−∞ (𝑝𝑝)𝑑𝑑𝑝𝑝+
∞ −∞
∫∞𝑠𝑠 (1 +𝐶𝐶)𝑓𝑓𝑝𝑝
0,05 (𝑝𝑝)𝑑𝑑𝑝𝑝� 𝑓𝑓𝑠𝑠(𝐶𝐶)𝑑𝑑𝐶𝐶+𝑃𝑃 ′
- the other using a lower uranium price mean pm’ (and a density probability function
𝑓𝑓𝑝𝑝′instead of 𝑓𝑓𝑝𝑝) multiplied by the probability of having competitive SFRs : this term
represents the case in which SFRs were competitive during the second period, were integrated in the nuclear fleet and provoked a drop in uranium price:
𝑒𝑒(𝑎𝑎2−𝑎𝑎1)×27𝐶𝐶𝐶𝐶𝐶𝐶𝐶𝐶𝐿𝐿𝐿𝐿𝐿𝐿100∗ ∫ �∫ 𝑓𝑓∞𝑠𝑠 𝑝𝑝
0,05 (𝑝𝑝)𝑑𝑑𝑝𝑝� ∞
−∞ 𝑓𝑓𝑠𝑠(𝐶𝐶)𝑑𝑑𝐶𝐶 �𝑃𝑃3∫ �∫ (1 + 0,05𝑝𝑝)𝑓𝑓𝑝𝑝′ 𝑠𝑠
0,05
−∞ (𝑝𝑝)𝑑𝑑𝑝𝑝+
∞ −∞
∫∞𝑠𝑠 (1 +𝐶𝐶)𝑓𝑓𝑝𝑝′
0,05 (𝑝𝑝)𝑑𝑑𝑝𝑝� 𝑓𝑓𝑠𝑠(𝐶𝐶)𝑑𝑑𝐶𝐶+𝑃𝑃′3∫ (1 + 0,05𝑝𝑝)𝑓𝑓𝑝𝑝′ ∞
−∞ (𝑝𝑝)𝑑𝑑𝑝𝑝� . (D.7)
There from the term C which consists of the sum of all these terms is:
𝐶𝐶 = 𝑒𝑒(𝑎𝑎2−𝑎𝑎1)×27𝐶𝐶𝐶𝐶𝐶𝐶𝐶𝐶𝐿𝐿𝐿𝐿𝐿𝐿100 *
�𝑃𝑃2∫ �∫ (1 + 0,05𝑝𝑝)𝑓𝑓𝑝𝑝 𝑠𝑠
0,05
−∞ (𝑝𝑝)𝑑𝑑𝑝𝑝+∫ (1 +𝐶𝐶)𝑓𝑓𝑝𝑝
∞ 𝑠𝑠
0,05 (𝑝𝑝)𝑑𝑑𝑝𝑝� ∞
−∞ 𝑓𝑓𝑠𝑠(𝐶𝐶)𝑑𝑑𝐶𝐶+𝑃𝑃′2∫ (1 +
∞ −∞
0,05𝑝𝑝)𝑓𝑓𝑝𝑝(𝑝𝑝)𝑑𝑑𝑝𝑝+ ∫ �∫ 𝑓𝑓𝑝𝑝 𝑠𝑠 0,05
−∞ (𝑝𝑝)𝑑𝑑𝑝𝑝� ∞
−∞ 𝑓𝑓𝑠𝑠(𝐶𝐶)𝑑𝑑𝐶𝐶 �𝑃𝑃3∫ �∫ (1 + 0,05𝑝𝑝)𝑓𝑓𝑝𝑝 𝑠𝑠
0,05
−∞ (𝑝𝑝)𝑑𝑑𝑝𝑝+
∞ −∞
∫∞𝑠𝑠 (1 +𝐶𝐶)𝑓𝑓𝑝𝑝
0,05 (𝑝𝑝)𝑑𝑑𝑝𝑝� 𝑓𝑓𝑠𝑠(𝐶𝐶)𝑑𝑑𝐶𝐶+𝑃𝑃 ′
3∫−∞∞ (1 + 0,05𝑝𝑝)𝑓𝑓𝑝𝑝(𝑝𝑝)𝑑𝑑𝑝𝑝� +
∫ �∫ 𝑓𝑓∞𝑠𝑠 𝑝𝑝
0,05 (𝑝𝑝)𝑑𝑑𝑝𝑝� ∞
−∞ 𝑓𝑓𝑠𝑠(𝐶𝐶)𝑑𝑑𝐶𝐶 �𝑃𝑃3∫ �∫ (1 + 0,05𝑝𝑝)𝑓𝑓𝑝𝑝′ 𝑠𝑠
0,05
−∞ (𝑝𝑝)𝑑𝑑𝑝𝑝+∫ (1 +
∞ 𝑠𝑠 0,05 ∞
−∞