Bayes Networks and Fault Tree Analysis application in Reliability
Estimation (Case Study: Automatic Water Sprinkler System)
Saeed Givehchi*, Alireza Heidari
School of Environment, College of Engineering, University of Tehran, Tehran, Iran.
Received: 22 February 2018 /Accepted: 17 July 2018
Abstract:
In this study, the application of Bayes networks and fault tree analysis in reliability estimation have been investigated. Fault tree analysis is one of the most widely used methods for estimating reliability. In recent years, a method called "Bayes Network" has been used, which is a dynamic method, and information about the probable failure of the system components will be updated according to the components data. In other words, the Bayes network is generally distributed with primary values and relations between variables. In this research, the reliability of the automatic Environmental detection and fire extinguisher system by water sprinkler system has been estimated by FTA and BAYES NETWORKS, also their comparison has been investigated. The probabilistic calculation and the graphical drawing required for this research has been completed by MATLAB and MICROSOFT BAYES NETWORK software. Finally, the reliability of an automatic water sprinkler system was calculated 0.93 by FTA. By updating the probability of failure and success, this value was changed to 0.89. The reason for the difference can be interpreted by taking into account the third state of the system, i.e., functioning with lower efficiency. The lowest level of reliability relates to a diesel generator that acts as a standby member in the event of a power failure. At the end, suggestions for improving the reliability of the automatic fire sprinkler system provided. Keywords: Bayes networks, Fault tree analysis, Reliability, Automatic systems, Fire extinguishing system
Introduction
The reliability of a system is the “probability of a safe and non-defective operation for a specified period of time in accordance with the existing and predetermined conditions” Modarres et al. (2009). So Reliability is considered as the science of failures. By definition, reliability is “the ability of a device to perform a required function under specified conditions during a given period”. (Pages, 1980).
In 2016, Hu conducted a study to investigate the fire safety of hotels using a fault tree method. Through forming the fault tree, he identified 3 main causes of fire in hotels: 1. Human error (unsafe actions), 2. Faults in electrical equipment, and 3. Faults of cabling. In order to improve safety and
reduce fires, he proposed daily inspections and issuing safety instructions to prevent reoccurrence of such events (Hu, 2016).
In 2011, Chen carried out a study on the reliability of a firefighting system in a building, which included 5 smoke and fire detection systems. The hazard notification system was designed in two local (alarm of a detector) and main (alarm of two or more than two detectors) sections and their reliabilities were investigated separately. To do this, they used the two methods of the probability of failure on demand (PFD) and calculation of the fictitious rates. he also noted methods for increasing the accuracy of reliability analysis, including the assurance that the kitchen fan is turned on, closing the doors of the rooms so that only one detector alert the fire in each location and use of detectors insensitive to smoke in the kitchen to reduce the fictitious statistics. In the present study, the application of Bayes networks and fault tree analysis in reliability estimation were investigated. Failure of products and systems can lead to disorders at various levels and can even be considered as a major threat to society and the environment. Therefore, consumers and, in general, people expect the products and systems to be reliable. Therefore, in recent decades, the science of reliability analysis has been widely introduced in various fields like safety, industry, medicine, and even humanities to investigate the probability of safe and proper functioning of devices for a specified period of time according to predetermined and existing conditions. Fire is an event that not only endangers individuals' lives, but also imposes billions of Rials of damage to the economy of the country and companies. Therefore, the use of automatic fire detection and extinguishing systems will protect the lives of the staff from fire hazards and damages. However, preventing the spread of fire in different places by these types of systems is along with manual fire extinguishers, which must be designed and manufactured by experienced and skilled individuals to show the best efficiency during fire (Chen, 2011). In recent years, a Bayesian network (BN) methodology has begun to be used in engineering applications. A BN is a graphical inference technique used to express the causal relationships among variables. BNs are used either to predict the probability of unknown variables or to update the probability of known variables given the certain state of other variables (evidence) through the process of probability propagation or reasoning. The reasoning is based on Bayes’ theorem. Due to this ability, BNs have provided a promising framework for system safety analysis and risk management. Mahadevan. (2001).
Statement of the problem
Material and Methods
System identification
Generally, automatic fire sprinkler systems include specified components. This system was used to model the automatic fire detection and extinguishing systems. This system has been designed to extinguish the type A fire by water in a material storehouse. In this reference, the researcher has defined 3 different fire scenarios and then analyzed the reliability of the system and evaluated the financial risk of the fire event.
Data Collection
In a study in 2011, Maximovic studied the data needed to estimate the reliability of the water sprinkler system. In this study, he first identified failures and examined the causes of failure, and then identified the limitations of data collection. Causes of failure are given in the table below (Maksimovic, 2011).
Table 1. Causes of failure in studies
1 Linder 1993 Errors during installation, design errors, component failure, faulty repair, exceeding design limits, environmental factors
2 Rönty 2004 Failures during use, repair failures, installation errors, equipment failure, failure of structures
3 Malm and Patterson 2008
Lack of activation of sprinklers, fire in areas with the lack of sprinkler coverage, lack of extinguishing material reaching the fire, system shutdown 4 Siu and
Apostolakis 1986
Failure to activate when needed, Error in extinguishing fire, restarting fire after system shutdown
5 Koffel 2006 Lack of reliability, system failure
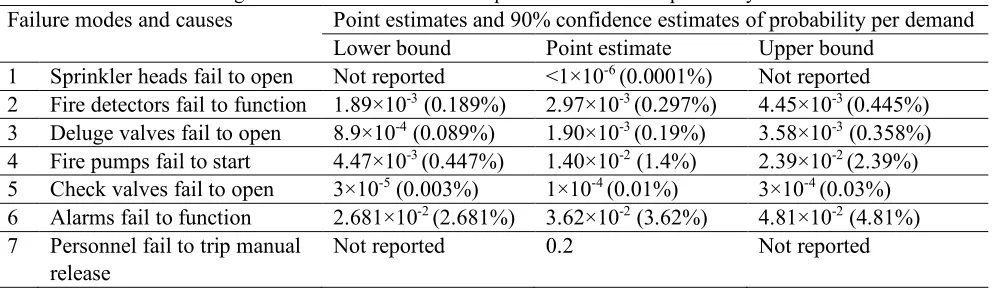
This study also examines the rates of failure and its average. The results are presented in the table below.
Table 2. Values and average of the failure rates of the components of the water sprinkler system
Failure modes and causes Point estimates and 90% confidence estimates of probability per demand
Lower bound Point estimate Upper bound
1 Sprinkler heads fail to open Not reported <1×10⁻⁶ (0.0001%) Not reported 2 Fire detectors fail to function 1.89×10⁻³ (0.189%) 2.97×10⁻³ (0.297%) 4.45×10⁻³ (0.445%) 3 Deluge valves fail to open 8.9×10⁻⁴ (0.089%) 1.90×10⁻³ (0.19%) 3.58×10⁻³ (0.358%) 4 Fire pumps fail to start 4.47×10⁻³ (0.447%) 1.40×10⁻² (1.4%) 2.39×10⁻² (2.39%) 5 Check valves fail to open 3×10⁻⁵ (0.003%) 1×10⁻⁴ (0.01%) 3×10⁻⁴ (0.03%) 6 Alarms fail to function 2.681×10⁻² (2.681%) 3.62×10⁻² (3.62%) 4.81×10⁻² (4.81%) 7 Personnel fail to trip manual
release
Not reported 0.2 Not reported
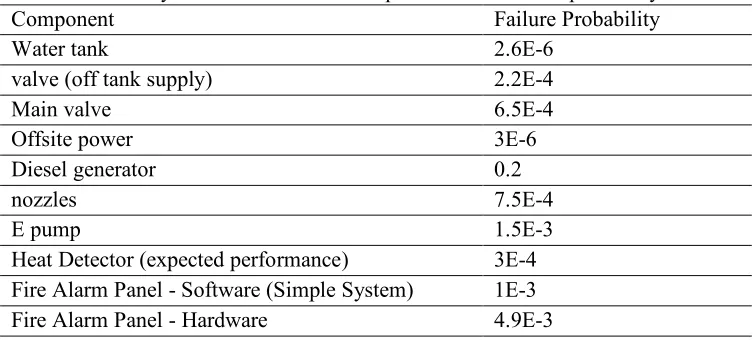
including the automatic water sprinkler system, has been measured. The probability of failure of each component in this study is described in the following table (Bahr, 2014).
Table 3. Probability of failure of various components of the water sprinkler system
Failure Probability Component
2.6E-6 Water tank
2.2E-4 valve (off tank supply)
6.5E-4 Main valve
3E-6 Offsite power
0.2 Diesel generator
7.5E-4 nozzles
1.5E-3 E pump
3E-4 Heat Detector (expected performance)
1E-3 Fire Alarm Panel - Software (Simple System)
4.9E-3 Fire Alarm Panel - Hardware
Fault tree
Fault Tree Analysis (FTA) is one of many symbolic logic analytical techniques. It was first used in the aerospace industry, but is now used in many different industries, including the nuclear industry since 1979, as well as the offshore (Miri Lavasani et al., 2011), chemical (Dong and Yu, 2005), and mining (Zhang et al., 2014) industries. It is a systems analysis technique for determining the root causes and the probability of occurrence of a specified undesired event. Many authors or organizations have described the technique in the literature (Harms-Ringdahl, 2013) suggests the following eight steps for an FTA:
1. Identify the objective for the FTA
2. Define the top event of the fault tree (FT) 3. Define the scope of the FTA
4. Define the resolution of the FTA 5. Define ground rules for the FTA 6. Construct the FT
7. Evaluate the FT
8. Interpret and present the results
Signs and symbols
Drawing the fault tree of a system needs signs, symbols and definitions, which have been integrated as a set. These signs and symbols are shown in the table below:
Bayesian network
acyclic graph. (Jensen et al. 2007). BNs are powerful and flexible tools for graphically modeling the causal interrelationships among some variables (Neapolitan, 2004).
Table 4. Signs and symbols of the fault tree in accordance with IEC 61025 standard
GATE NAME DESCRIPTION
OR GATE
The output event occurs if any of the input events occur
P (A or B) = P (A ∪ B) = P(A) + P(B) - P (A ∩ B)
AND GATE
The output event occurs only if all of the input events occur
P (A and B) = P (A ∩ B) = P(A) P(B)
There have been claims that BBNs may provide a means of resolving shortcomings of some of the traditional approaches. For example, Bobbio et al. (1999) show how limitations intrinsic to combinatorial dependability methods such as fault trees can be overcome using BBNs. Similarly, Torres-Toledano and Scuar (1998) show how BBNs can be used to model common-cause failures more naturally than approaches based on reliability block diagrams. In addition, there are applications of BBNs to reliability modelling of complex systems. See, for example, [18–21]. BBNs are basically a framework for reasoning under uncertainty. In a broad sense they are a set of methods for probabilistic calculation and graphical representation that can be used for most problems with uncertainty. BBNs have their background in statistics and artificial intelligence where they emerged in the 1980s when there was found to be a need for a formalism that adequately dealt with uncertainty in knowledge-based systems (Van Der Gaag, 1996). Since the early 1990s their use has expanded (Parsons, 1996). As a consequence of increasing computing power and the development of powerful algorithms for probabilistic inference (Jensen, 1996). In addition to reliability modelling, BBNs have been applied to problems in areas such as medical diagnosis (Spiegelhalter, 1994). Stassopoulou et al. (1998), presenting probabilistic legal arguments and help wizards in Microsoft Office TM (Fenton et al., 2000).
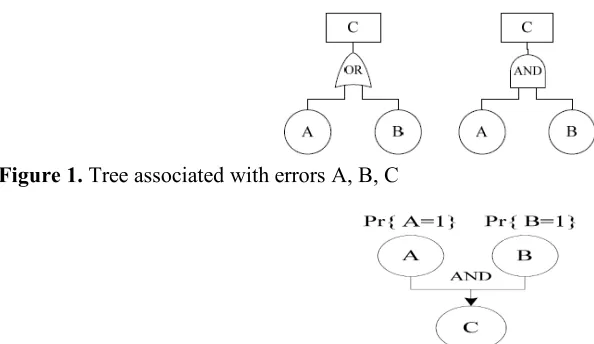
Conversion of a fault tree to Bayes networks
The reliability can be calculated by converting block diagrams or fault trees into Bayesian networks considering the final product as the last node. Fault trees can easily be converted into Bayesian networks. As can be seen in the figure, fault events somehow can be considered as Bayesian network nodes, and the OR and AND gates turn into edges. So that the difference between the types of gates affects the conditional probabilities defined between variables in the Bayesian networks.
Figure 1. Tree associated with errors A, B, C
Figure 2. Bayesian network related to the fault tree with AND gate
The conditional relationships for the Bayes network of figure 2. Are as follows:
The probability of the AND gate output is given by: P (A and B) = P (A ∩ B) = P (A) P (B)
Figure 3. Bayesian network related to the fault tree with OR gate
The conditional relationships for the Bayes network shown in figure 3 are as follows:
The probability of the AND gate output is given by: P (A or B) = P (A ∪ B) = P (A) + P (B) - P (A ∩ B)
The inputs are mutually exclusive events so: P (A or B) ≈ P (A) + P (B), P (A ∩ B) ≈ 0
Results
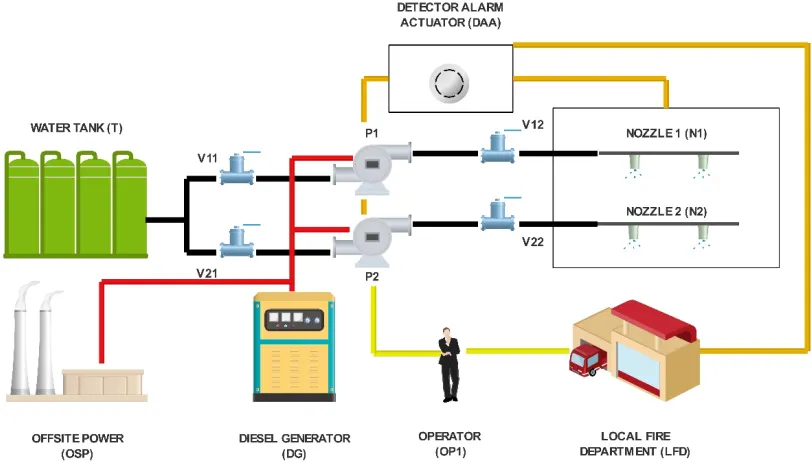
Introduction of the system
work automatically and pulls out water from the tank and sprays into the fire area. If the spray path is not triggered, local operators can turn on the second spray path manually, and if the second path was not available, the operators will request help from the local fire station, although the detector automatically sends a signal directly to the fire department. However in this case, it takes a long time compared to when the nozzles are available and extinguish the fire, and more damage occurs. Under these conditions, if an external power supply (OSP) is not available due to the fire or any other reason, a local diesel generator will provide power for the pumps. In addition, the detector/alarm/operator system will be supplied by several batteries directly charged by the osp. Even if the AC power is cut off, DC power is supplied by the battery and the batteries will always be available.
The manual valves on both sides of pump 1 and 2 are normally open and are closed only when being repaired. The contents of the combustion system and the generator are located outside the reactor body and therefore are not subject to internal fire.
Figure 4. Automatic fire sprinkler system
Table 5. Failure rates of the automatic fire sprinkler system components
system λ=1/MTTF MTTF [2]
OSP 0.00011 9090.9
DG 0.055006 18.18
DAA 0.0001 10000
P1,P2 0.017001 58.82
OP1 0.01 100
T 0.00001 100000
V11, V12, V21, V22 0.0042 238.09
N1,N2 0.00001 100000
Fault tree method
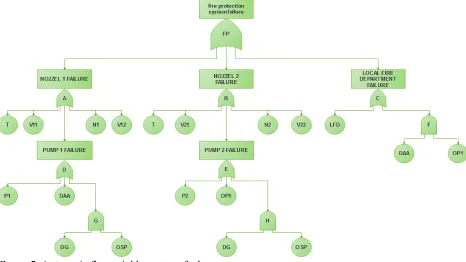
As mentioned earlier, there are three different phases to extinguish fire. In the first phase, first, the fire is detected by the DAA and the signal is sent to the pump P1 until the water from tank T enters the pump P1 through the tubes V11 and from there, the water is pumped through the pipes V22 into nozzle N1. If any of the components T, V11, P1, V12 and N1 fail, the first phase will be completely affected. Pump P1 does not work properly when it itself fails, or the DAA fails to send a signal to P1, or both DG and OSP systems simultaneously fail to work. If the first phase does not respond, the second phase will be replaced, in which the operator activates the P2 pump system, and the remaining process and the system failure modes are the same as in the first phase. The first and the second phases may not act to extinguish the fire, in which case the third phase will be considered as the final option in which the DAA or the operator OP2 informs the fire department of the occurrence of fire. According to the description, the fault tree of the system is as shown in figure 2 (the figure has been plotted by Edraw Max software). Solving the fault tree is as figure 5:
Figure 5. Automatic fire sprinkler system fault tree
Reliability assessment
Given that the total probability of success and failure is equal to 1. Therefore, the probability of failure of each member of the fault tree is computed and placed in the following equation:
𝑅(𝑡) + 𝑄(𝑡) = 1 𝑄(𝑡) = 1 − 𝑅(𝑡)
Formation of probabilistic equations
𝑄(𝐹𝑃) = 𝑄(𝐴) + 𝑄(𝐵) + 𝑄(𝐶)
𝑄(𝐶) = 𝑄(𝐿𝐹𝐷) + 𝑄(𝐹) 𝑄(𝐷) = 𝑄(𝑃1) + 𝑄(𝐷𝐴𝐴) + 𝑄(𝐺) 𝑄(𝐸) = 𝑄(𝑃2) + 𝑄(𝑂𝑃1) + 𝑄(𝐻)
𝑄(𝐹) = 𝑄(𝐷𝐴𝐴) × 𝑄(𝑂𝑃1) 𝑄(𝐺) = 𝑄(𝐷𝐺) × 𝑄(𝑂𝑆𝑃) 𝑄(𝐻) = 𝑄(𝐷𝐺) × 𝑄(𝑂𝑆𝑃)
Calculations
𝑸(𝑮) = 0.00000605066 𝑸(𝑯) = 0.00000605066 𝑸(𝑫) = 0.01710705066 𝐐(𝐄) = 0.02700705066
𝑸(𝑭) = 0.0101 𝑸(𝑨) = 0.02552705066 𝑸(𝑩) = 0.03542705066
𝑸(𝑪) = 0.0102 𝑸(𝑭𝑷) = 0.07115410132
Table 6. Values of the probability of failure and success of the system components
System R(t) Q(t) MTTF [2]
OSP 0.99989 0.00011 9090.9
DG 0.944994 0.055006 18.18
DAA 0.9999 0.0001 10000
P1,P2 0.982999 0.017001 58.82
OP1 0.99 0.01 100
T 0.99999 0.00001 100000
V11, V12, V21, V22 0.9958 0.0042 238.09
N1,N2 0.99999 0.00001 100000
LFD 0.9999 0.0001 10000
Therefore, according to the calculations, it was found that the probability of failure of the system during 1 hour is 0.07115410132 for the whole system, that is, the reliability of the system is 0.9288. After executing the corresponding code in Appendix 1, the software calculations showed the number 0.0611 for failure probability, hence, the probability of success or reliability of the system is calculated as 0.9389.
Bayes network method
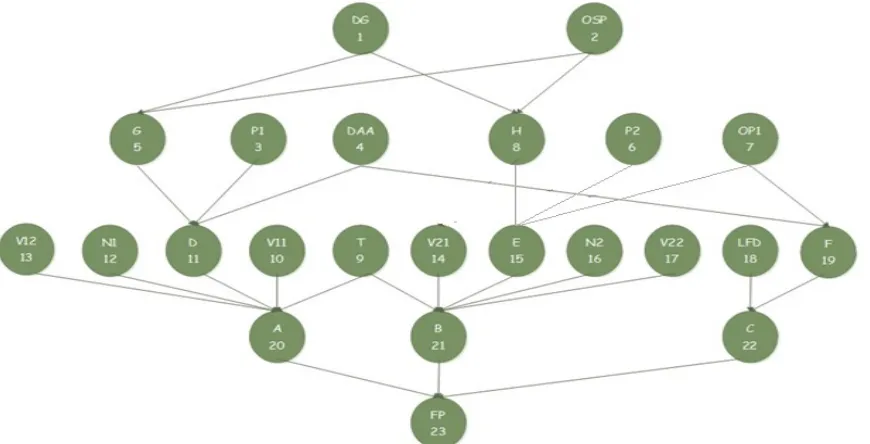
Having the structure of a fault tree, it can be converted to a Bayes network. Figure 3 demonstrates the Bayes network of the system. Bayes network includes 5 layers.
• The first layer contains nodes 1 and 2, respectively related to DG and OSP events.
• The second layer contains nodes 3 to 8. Nodes 3, 4, 6, and 7 respectively relate to the events P1, DAA, P2 and OP1, and nodes 5 and 6 respectively related to the nodes G and H.
• The third layer contains nodes 9 to 19, which respectively indicate events T, V11, D, N1, V12, V21, E, N2, V22, LFD and F.
• The fourth layer is related to events A, B, and C, respectively, corresponding to nodes 20, 21, and 22.
• The fifth layer is also related to the final event of FP, which is indicated by number 23.
Conversion of a fault tree to a Bayes network
Figure 6. Conversion of a fault tree to a Bayes network in the automatic fire sprinkler system
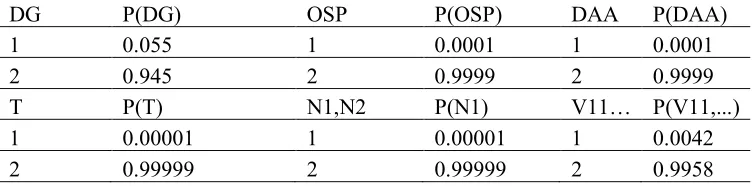
Table 7. Probabilities for events with two states
DG P(DG) OSP P(OSP) DAA P(DAA)
1 0.055 1 0.0001 1 0.0001
2 0.945 2 0.9999 2 0.9999
T P(T) N1,N2 P(N1) V11… P(V11,...)
1 0.00001 1 0.00001 1 0.0042
2 0.99999 2 0.99999 2 0.9958
Table 8. Probabilities for events with three states
P1, P2 P(P1,P2) OP1 P(OP1) LFD P(LFD)
1 0.017 1 0.01 1 0.0001
2 0.6553 2 0.66 2 0.6666
3 0.3277 3 0.33 3 0.3333
Table 9. States related to nodes G and H
DG OSP P(G=1) DG OSP P(H=1)
1 1 1 1 1 1
1 2 0 1 2 0
2 1 0 2 1 0
2 2 0 2 2 0
Table 10. States related to node D
P1 DAA G P(D=1) P(D=2) P(D=3)
1 1 1 1 0 0
1 1 2 1 0 0
1 2 1 1 0 0
1 2 2 1 0 0
2 1 1 1 0 0
2 1 2 1 0 0
2 2 1 1 0 0
2 2 2 0 0 0
3 1 1 1 0 0
3 1 2 1 0 0
3 2 1 1 0 0
3 2 2 0 0 1
Table 11. States related to nodes C and F
DAA OP1 P(F=1) P(F=2) P(F=3) LFD F P(C=1) P(C=2) P(C=3)
1 1 1 0 0 1 1 1 0 0
1 2 0 1 0 1 2 1 0 0
1 3 0 0 1 1 3 1 0 0
2 1 0 0 0 2 1 1 0 0
2 2 0 0 0 2 2 0 1 0
2 3 0 0 0 2 3 0 0 1
3 1 1 0 0
3 2 0 0 1
Table 12. States related to node E
P2 OP1 H P(E=1) P(E=2) P(E=3)
1 1 1 1 0 0
1 1 2 1 0 0
1 2 1 1 0 0
1 2 2 1 0 0
1 3 1 1 0 0
1 3 2 1 0 0
2 1 1 1 0 0
2 1 2 1 0 0
2 2 1 1 0 0
2 2 2 0 0 0
2 3 1 1 0 0
2 3 2 0 0 1
3 1 1 1 0 0
3 1 2 1 0 0
3 2 1 1 0 0
3 2 2 0 0 1
3 3 1 1 0 0
3 3 2 0 0 1
Table 13. States related to node B
T V21 E N2 V22 P(B=1) P(B=2) P(B=3) T V21 E N2 V22 P(B=1) P(B=2) P(B=3)
1 1 1 1 1 1 0 0 2 1 1 1 1 1 0 0
1 1 1 1 2 1 0 0 2 1 1 1 2 1 0 0
1 1 1 2 1 1 0 0 2 1 1 2 1 1 0 0
1 1 1 2 2 1 0 0 2 1 1 2 2 1 0 0
1 1 2 1 1 1 0 0 2 1 2 1 1 1 0 0
1 1 2 1 2 1 0 0 2 1 2 1 2 1 0 0
1 1 2 2 1 1 0 0 2 1 2 2 1 1 0 0
1 1 2 2 2 1 0 0 2 1 2 2 2 1 0 0
1 1 3 1 1 1 0 0 2 1 3 1 1 1 0 0
1 1 3 1 2 1 0 0 2 1 3 1 2 1 0 0
1 1 3 2 1 1 0 0 2 1 3 2 1 1 0 0
1 1 3 2 2 1 0 0 2 1 3 2 2 1 0 0
1 2 1 1 1 1 0 0 2 2 1 1 1 1 0 0
1 2 1 1 2 1 0 0 2 2 1 1 2 1 0 0
1 2 1 2 1 1 0 0 2 2 1 2 1 1 0 0
1 2 1 2 2 1 0 0 2 2 1 2 2 1 0 0
1 2 2 1 1 1 0 0 2 2 2 1 1 1 0 0
1 2 2 1 2 1 0 0 2 2 2 1 2 1 0 0
1 2 2 2 1 1 0 0 2 2 2 2 1 1 0 0
1 2 2 2 2 1 0 0 2 2 2 2 2 0 0 0
1 2 3 1 1 1 0 0 2 2 3 1 1 1 0 0
1 2 3 1 2 1 0 0 2 2 3 1 2 1 0 0
1 2 3 2 1 1 0 0 2 2 3 2 1 1 0 0
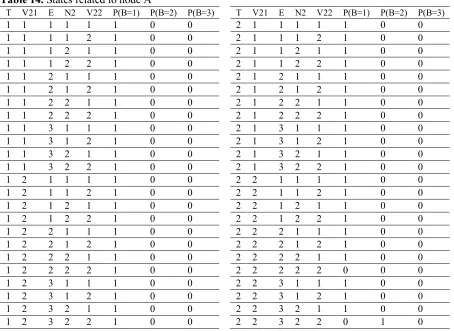
Table 14. States related to node A
T V21 E N2 V22 P(B=1) P(B=2) P(B=3) T V21 E N2 V22 P(B=1) P(B=2) P(B=3)
1 1 1 1 1 1 0 0 2 1 1 1 1 1 0 0
1 1 1 1 2 1 0 0 2 1 1 1 2 1 0 0
1 1 1 2 1 1 0 0 2 1 1 2 1 1 0 0
1 1 1 2 2 1 0 0 2 1 1 2 2 1 0 0
1 1 2 1 1 1 0 0 2 1 2 1 1 1 0 0
1 1 2 1 2 1 0 0 2 1 2 1 2 1 0 0
1 1 2 2 1 1 0 0 2 1 2 2 1 1 0 0
1 1 2 2 2 1 0 0 2 1 2 2 2 1 0 0
1 1 3 1 1 1 0 0 2 1 3 1 1 1 0 0
1 1 3 1 2 1 0 0 2 1 3 1 2 1 0 0
1 1 3 2 1 1 0 0 2 1 3 2 1 1 0 0
1 1 3 2 2 1 0 0 2 1 3 2 2 1 0 0
1 2 1 1 1 1 0 0 2 2 1 1 1 1 0 0
1 2 1 1 2 1 0 0 2 2 1 1 2 1 0 0
1 2 1 2 1 1 0 0 2 2 1 2 1 1 0 0
1 2 1 2 2 1 0 0 2 2 1 2 2 1 0 0
1 2 2 1 1 1 0 0 2 2 2 1 1 1 0 0
1 2 2 1 2 1 0 0 2 2 2 1 2 1 0 0
1 2 2 2 1 1 0 0 2 2 2 2 1 1 0 0
1 2 2 2 2 1 0 0 2 2 2 2 2 0 0 0
1 2 3 1 1 1 0 0 2 2 3 1 1 1 0 0
1 2 3 1 2 1 0 0 2 2 3 1 2 1 0 0
1 2 3 2 1 1 0 0 2 2 3 2 1 1 0 0
1 2 3 2 2 1 0 0 2 2 3 2 2 0 1 0
Table 15. States related to node FP
A B C P(FP=1) P(FP=2) P(FP=3)
1 1 1 1 0 0
1 1 2 0 1 0
1 1 3 0 0 1
1 2 1 0 1 0
1 2 2 0 1 0
1 2 3 0 0 1
1 3 1 0 0 1
1 3 2 0 0 1
1 3 3 0 0 1
2 1 1 0 1 0
2 1 2 0 1 0
2 1 3 0 0 1
2 2 1 0 1 0
2 2 2 0 1 0
2 2 3 0 0 1
2 3 1 0 0 1
2 3 2 0 0 1
2 3 3 0 0 1
3 1 1 0 0 1
3 1 2 0 0 1
3 1 3 0 0 1
3 2 1 0 0 1
3 2 2 0 0 1
3 2 3 0 0 1
3 3 1 0 0 1
3 3 2 0 0 1
3 3 3 0 0 1
Conclusion
In this paper, the application of Bayes networks and fault tree analysis in reliability estimation were investigated. The lowest reliability is related to the diesel generator. However, it should be noted that the diesel generator as a stand-by component, will enter the circuit in the event of a power failure in the system to supply the power required by the pumps and the warning system. Therefore, it is recommended to develop a detailed operation and maintenance program along with periodic inspections. Furthermore, the overall reliability of the system can be increased by adding two or more operators for manual start-up and notifying the fire department in parallel. Certainly, extinguishing the fire in the shortest time and without a system failure can be effective in reducing the severity of outcomes and ultimately reducing the risk priority number and risk level. The 33% of the failures reported due to being deactivate, inoperative, and lack of effective maintenance. Also Human interference, component faults and freezing of the system account for 20 percent of the causes. Frank (2013).
Suggestions on measures in order to improve the reliability of fire protection system
- A higher level on fire-protection management system, including maintenance and routines is required.
- A higher standard on design, installation and inspection of sprinkler systems is required. - Insurance companies have to make demands on policyholders and improve their interaction with
inspection companies to ensure a reliable function of sprinkler systems.
Fault tree
Also, the fault tree analysis technique was used in this study. This method has advantages and disadvantages, including:
Advantages:
• Identification of hazards in complex systems • Analysis of human errors and equipment
• Focus on a faults, simultaneously without loss of image and overview of hazards • A perspective on how errors become more serious and more dangerous outcomes
• Quantitative and qualitative methods and the possibility of estimating the probability of a fault to cause an event
• Use in the analysis of favorable and unfavorable events
• Establishing the foundations for a program to prevent industrial accidents • Organized and comprehensive method
Disadvantages:
• Requires comprehensive and specialized information from the system. • It is not easy to use for large and massive systems.
• This method is time consuming and relatively detailed and general.
Bayes networks
The Bayes network is a good demonstration for controlling uncertainty and reliability estimates. A Bayesian network is a directed acyclic graph the vertices of which are random variables and each vertex has a conditional distribution based on its parents. In fact, Bayesian network is a good way to show conditional independence that speeds up the process of probabilistic inference. Bayesian networks in fact determine a joint distribution for the territory, each element of the distribution being as multiplication of a number of elements from the conditional probability tables of the vertices. Furthermore, in general, the size of nodes in a Bayesian network exponentially is smaller than the number of elements within these conditional probability tables. Therefore, in order to efficiently display the conditional distribution tables, many ways have been designed, among which is using special distributions with limited parameters. In addition, there are many methods for efficient inference in Bayesian networks. Methods that are trying to infer accurately are not practical in complex domains and lead to approximate inference methods like weighted sampling and Markov chain sampling.
References
Bahr, N. J. (2014). System safety engineering and risk assessment: a practical approach. CRC Press.
Bobbio, A., Portinale, L., Minichino, M., & Ciancamerla, E. (1999, September). Comparing fault trees and bayesian networks for dependability analysis. In International Conference on Computer Safety, Reliability, and Security (pp. 310-322). Springer, Berlin, Heidelberg.
Bouissou, M., Martin, F., & Ourghanlian, A. (1999, January). Assessment of a safety-critical system including software: a Bayesian belief network for evidence sources. In Reliability and Maintainability Symposium, 1999. Proceedings. Annual (pp. 142-150). IEEE.
Chen, Y. (2011). Reliability Analysis of a Fire Alarm System. Procedia Engineering, 24, 731-736.
Dong, Y., Yu, D., 2005. Estimation of failure probability of oil and gas transmission pipelines by fuzzy fault tree analysis. J. Loss Prev. Process Ind. 18 (2), 83–88.
F.V. Jensen, T.D. Nielsen, Bayesian Networks and Decision Graphs, 2nd edition, Springer, New York, 2007.
Fenton, N., & Neil, M. (2000). The “Jury Fallacy” and the use of Bayesian Networks to present Probabilistic Legal Arguments. Mathe, natics Today (Bulletin of the IMA), 36(6), 180-187.
Fenton, N., Littlewood, B., Neil, M., Strigini, L., Sutcliffe, A., & Wright, D. (1998). Assessing dependability of safety critical systems using diverse evidence. IEE Proceedings-Software, 145(1), 35-39.
Harms-Ringdahl, L. (2013). Guide to safety analysis for accident prevention. IRS Riskhantering.
Hu, Y. N. (2016). Research on the application of fault tree analysis for building fire safety of hotels. Procedia Engineering, 135, 524-530.
Jensen, F. V. (1996). An introduction to Bayesian networks (Vol. 210, pp. 1-178). London: UCL press. Koffel, W. E. (2005). Reliability of automatic sprinkler systems. In SUPDET Conference, Quincy, MA:
Fire Protection Research Foundation.
Linder, K. W. (1993, July). Field reliability of fire detection systems. In Balanced Design Concepts Workshop, June (Vol. 30, pp. 1-2).
Maksimovic, T. (2011). Data on Reliability of Sprinkler Systems. 14-osios Lietuvos jaunuju mokslininku konferencijos „Mokslas – Lietuvos ateitis“. Maksimovic, T. Data on reliability of sprinkler systems. (2011).
Malm, D., & Pettersson, A. I. (2008). Reliability of automatic sprinkler systems-An analysis of available statistics. LUTVDG/TVBB--5270--SE.
Miri Lavasani, M. R., Wang, J., Yang, Z., & Finlay, J. (2011). Application of fuzzy fault tree analysis on oil and gas offshore pipelines. International Journal of MArine Science and Engineering, 1(1), 29-42. Modarres, M., Kaminskiy, M. P., & Krivtsov, V. (2016). Reliability engineering and risk analysis: a
practical guide. CRC press.
National Aeronautics and Space Administration (NASA). (2002). Fault Tree Handbook with Aerospace Applications.
Neapolitan, R.E., 2004. Learning Bayesian Networks. Prentice Hall, Upper Saddle River, New Jersey. Neil, M., Littlewood, B., & Fenton, N. (1996). Applying Bayesian belief networks to system dependability
assessment. In Safety-critical systems: The convergence of high tech and human factors (pp. 71-94). Springer, London.
Pages, A., & des systèmes-Edition, M. G. F. (1980). Eyrolles.
Parsons, S. (1996). Current approaches to handling imperfect information in data and knowledge bases. IEEE Transactions on knowledge and data engineering, 8(3), 353-372.
Rönty, V., Keski-Rahkonen, O., & Hassinen, J. P. (2004). Reliability of sprinkler systems. Exploration and analysis of data from nuclear and non-nuclear installations (No. VTT-WORK--15). VTT Technical Research Centre of Finland.
Siu, N., & Apostolakis, G. (1986). A methodology for analyzing the detection and suppression of fires in nuclear power plants. Nuclear Science and Engineering, 94(3), 213-226.
Spiegelhalter, D. J., Franklin, R. C., & Bull, K. (1990). Assessment, criticism and improvement of imprecise subjective probabilities for a medical expert system. In Machine Intelligence and Pattern Recognition (Vol. 10, pp. 285-294). North-Holland.
Stassopoulou, A., Petrou, M., & Kittler, J. (1998). Application of a Bayesian network in a GIS based decision making system. International Journal of Geographical Information Science, 12(1), 23-46. Torres-Toledano, J. G., & Sucar, L. E. (1998, October). Bayesian networks for reliability analysis of
complex systems. In Ibero-American Conference on Artificial Intelligence (pp. 195-206). Springer, Berlin, Heidelberg.
Van Der Gaag, L. C. (1996). Bayesian belief networks: odds and ends. The Computer Journal, 39(2), 97-113.
Yu, D. C., Nguyen, T. C., & Haddawy, P. (1999). Bayesian network model for reliability assessment of power systems. IEEE Transactions on Power Systems, 14(2), 426-432.
Zarei, E., Azadeh, A., Khakzad, N., Aliabadi, M. M., & Mohammadfam, I. (2017). Dynamic safety assessment of natural gas stations using Bayesian network. Journal of hazardous materials, 321, 830-840.
Zhang, M., Kecojevic, V., Komljenovic, D., 2014. Investigation of haul truck-related fatal accidents in surface mining using fault tree analysis. Saf. Sci. 65, 106–117.
Environmental Energy and Economic Research is licensed