Demographic Research a free, expedited, online journal of peer-reviewed research and commentary
in the population sciences published by the Max Planck Institute for Demographic Research
Doberaner Strasse 114 · D-18057 Rostock · GERMANY www.demographic-research.org
DEMOGRAPHIC RESEARCH
VOLUME 2, ARTICLE 4
PUBLISHED 17 APRIL 2000
www.demographic-research.org/Volumes/Vol2/4/
DOI: 10.4054/DemRes.2000.2.4
DESCRIPTIVE FINDINGS
Entry into motherhood in Sweden:
the influence of economic factors
on the rise and fall in fertility, 1986-1997
Britta Hoem
Entry into motherhood in Sweden:
the influence of economic factors
on the rise and fall in fertility, 1986-1997
Britta Hoem1
Abstract
On the background of the dramatic swings in the Swedish TFR since the mid-1980s we
present a first attempt at assessing the impact of labor-market trends on the timing of the first
birth based on individual-level register data covering all Swedish women born in 1950 or later.
Among our covariates we have each woman’s income, partitioned into any income earned from
work, any unemployment benefits, and any public support for educational activities. We also
have employment trends in her home municipality. The latter variables are included for every
relevant year. We find that first-birth rates rose and fell in step with municipal employment
levels. The effect is especially strong for young women, and the decline in first birth during the
1990s was concentrated primarily among women aged below 30. First-birth rates increased with
a woman’s earned income. Unemployed women did not have particularly low first-birth rates,
1 Introduction
The fertility swings that Sweden has experienced in recent years are stronger than in any
other Western country [5]. Over the last fifteen years or so, Swedish Total Fertility rose from
what was then a lowest-ever level of about 1.6 (in 1983) to around 2.1 in 1990-92 and then fell
swiftly to a new lowest-ever of about 1.5 in 1997 [Figure 1]. The figure for 1998 is even
somewhat lower. Tempo shifts may cause the development of the period TFR to exaggerate real
fertility trends, but we avoid such problems by working with longitudinal (register) data on the
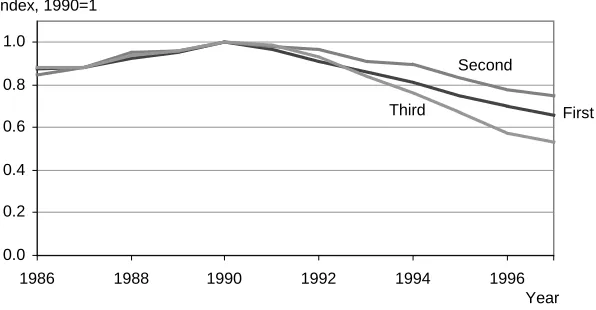
individual level and by holding apart childbearing behavior at the various birth orders. In general
terms, it then turns out that the picture has been the same for all the usual birth orders [Figure 2].
In the 1990s, entry into motherhood has been postponed, second-birth rates have dropped by
some 25 percent, and third-birth rates have been cut almost in half.
The purpose of this paper is to give a more complete description of the trends in first births
and to relate them to developments in the labor market. We hypothesize that childbearing among
childless women is dominated by their own economic fortunes and by their perception of general
economic developments in their communities. This may be particularly important in a country
like Sweden, where women hold a job almost as often as men do, even when they have small
children. Under such circumstances, a woman needs to be established in the labor market before
she enters motherhood. This means that we may see a strong reduction in first childbearing at
times when it is difficult to land a job. We believe that there is some additional effect of public
policies directed to the family; in particular the generosity of parental-leave regulations may be
important. Economic developments and changes in public policies may influence childbearing
both direct and via their impact on people’s impressions of what the near future will bring.
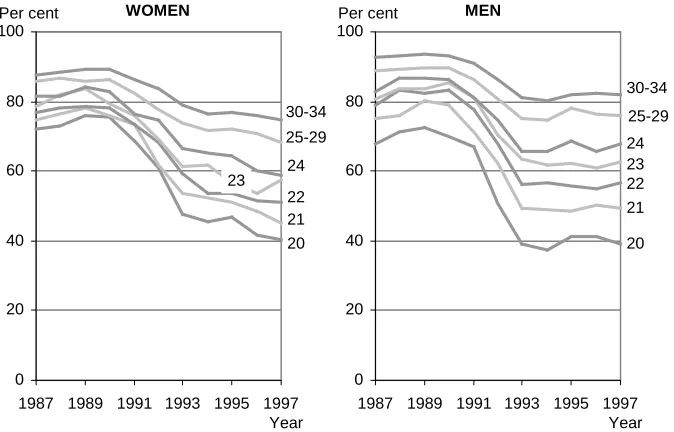
Economic trends seem to influence childbearing in several ways. First there is a direct
income effect. Since 1990, employment has dropped dramatically, particularly among young
entrants into the labor market [Figure 3]. Many young people have found it difficult to get a
regular job and have turned to taking more education instead. At the same time, cutbacks in
family benefits have hit all families, particularly toward the end of our period of observation. In
1995, parental-leave benefits were cut from 90 to 80 percent of your income, and in 1996 they
namely by some fifteen percent (to SEK 640 or some US$ 80 per month), and child-care costs
have risen in addition. Even though the resulting levels were still generous by international
standards, families with children experienced a considerable reduction in their standard of living.
Such cutbacks in public contributions are likely to be regarded as authoritative signals
about hard times to come, and they will add to adverse economic trends in creating a pessimistic
climate of opinion conducive to the postponement of childbearing, particularly at young ages,
where people feel they have time to wait. Young people are also induced to pursue life strategies
that do not readily include early family formation and entry into parenthood. When times are bad,
the new generations seek education to a much larger extent than their predecessors, because
education is seen as a means to become more competitive [12]. This effect may be particularly
strong in a country like Sweden, where education is given with no tuition and where students are
offered public grants and loans. In response to general developments, the authorities expanded
the educational system greatly and there was a massive influx of young Swedes into educational
activities as we passed through the 1990s.
In the present report, we concentrate on first births to women born in Sweden and study
how they were influenced by the dramatic swings in the labor market. Our concentration on first
births is motivated in part by the greater social significance that first births have over second or
third births, and in part by our data limitations. Changes in first-birth fertility have dominated
general fertility trends, and a decrease in or postponement of entry into motherhood is of prime
importance for fertility developments in general. Furthermore, in our analysis we can use the
income earned by a woman herself but not the income of the man she has children with. This
limitation is bound to be more crucial for a study of childbearing rates after than before a first
birth. By the construction of the income-compensation system for parental leave, a woman is
strongly motivated to have a firm footing on the labor market herself before she starts having
children, and this is what we focus on here. We should be able to allow ourselves to rely on her
fertility analysis at this stage. Nevertheless, we have made some analysis of second and third
births and have reported it elsewhere along with some information about births to immigrant
women [4]. Third-birth rates to Swedish women turn out to be at least as sensitive to economic
fluctuations as their first-birth rates are, but second-birth rates are much less easily affected.
Immigrant women have been less influenced by economic trends than Swedish women have.
To improve our understanding of the determinants of entry into parenthood, we have
constructed a special longitudinal data set based on registers available in Statistics Sweden. We
2 Data and method of analysis
We have data for all women born in 1950 or later who have been recorded as domiciled in
Sweden at least some time during the years 1985 through 1997. The records have been extracted
from a number of databases in Statistics Sweden and linked by means of the person number
assigned to each individual. The set contains the date of birth of the woman herself, dates of all
her births, and additionally
• her country of birth and possible dates of immigration and emigration;
• a record of the municipality (kommun) she lived in at the end of each relevant calendar year;
• her income earned from work in corresponding years, including any amounts of sickness compensation; and
• any unemployment benefits and educational grants and loans from public sources.
We have additional information about the employment situation in our women’s home
municipalities. For a population of some 8.8 million, Sweden has 288 municipalities, and for our
purposes, that is the smallest statistical unit we can get data for.
In most of our analysis we have used hazard regression. This is now commonplace in
studies of the simultaneous impact of several factors on individual behavior that evolves over
time, based on event-history data subject to possible censoring before the occurrence of the event
in question. The method allows us to include both determinants that are constant and others that
may change over the life segment studied. In our case, the event is a woman’s first birth. Our
time-varying determinants include individual-level covariates like her annual income, and
contextual variables such as the labor-market situation that people in her home municipality face.
3 Theoretical and practical issues
For the analysis of first births, our data set is extensive by any standard, and as register data
go it is particularly rich in information about women’s own incomes and their unemployment and
educational allowances, as well as about their whereabouts. Nevertheless, like any data set, it
represents a compromise between what is desirable in theory and what is possible in practice. In
particular, the large data size is bought at the expense of the much larger number of variables and
the more accurate dating of non-demographic events in good retrospective survey data. Here are
some reflections that explain our practices and our choice of variables.
Any analysis of life-history segments makes unusually strong demands on the character and
quality of the data. In principle, we follow women month by month and record some aspects of
what happens to them in the current month. For some types of events, there is a delay between a
decision to engage in a given type of behavior and the outcome that we record as an event that
occurs on a given date. Childbearing is a typical example. A first birth is the end-point a process
that may have extended over a longish period. Unless the birth was unplanned, the couple has
had to arrive at a decision to start a pregnancy, it may have taken the woman some time to
conceive, and there has been a period of gestation. With our type of data we cannot get at this
process and at what influenced it while it happened, but we must somehow take into account the
fact that it preceded the birth. We would have liked to know a woman’s economic situation some
nine months or so before any month in which we regard her as ”under risk” of having a first
birth, but we have had to be content with the income earned and public benefits received in the
preceding calendar year. To represent the job situation in her immediate surroundings closely
before the current month, we have used information about her most recent home municipality,
assigned as follows. We have recorded each woman’s municipality of residence at the end of
each calendar year. If she has had a change of municipality between the beginning and end of a
year, we have allocated the move to the middle of the year. This assigns a home municipality to
the woman from the middle of any year to the middle of the next. For any month ”under risk” of
a first birth, we have then used characteristics of a woman’s home municipality thus assigned
during the preceding twelve-month period between years’ midpoints. We make use of municipal
woman’s perceptions and decisions are dominated by her local environment, and the
munici-pality is the best proxy for it that we can obtain. A woman’s home municimunici-pality may not coincide
with the geographical area in which she can hold a job without moving, but then our data on the
employment situation are organized in terms of the municipality in which people are domiciled,
not according to where they work. Therefore, our contextual employment variable should reflect
adequately the general employment situation that our women perceive. We trust that the
essentials of the impacts of income and employment determinants will be picked up adequately
by our method of analysis.
The fact that we have a valuable data set does not mean that we could not wish for more. If
it were possible, we would in fact have liked to include more information about the woman
herself and particularly about her family. Since we are analyzing childless women, we would
have liked to know for each woman whether she lived with a man at any time during the years
we study, and if she did, we would have liked to know his economic situation as well. The
decision to start childbearing depends of course not only on a woman’s own employment
situation but also on whether she has a partner and on his current situation and his prospects.
Unfortunately, Sweden does not have a register that contains the family situation for all
in-habitants. We do know whether a woman is married at any time, and if she is we can get similar
income information for her husband. However, not many childless couples are married in this
country. Most of them live in consensual unions; in fact only about one third of the firstborn in
any year have married parents. (Some women who have their first babies have no co-residential
partners, but that is less of a problem because only an estimated five percent or so of all newborn
children have single mothers.) In this situation, it makes no sense to include a woman’s marital
status and any information about her husband in the analysis, and we have left it out.
We use our income information primarily to characterize the woman’s general situation in
the labor market and not really to describe her financial status. We will see the operational
4 Trends in first births
The drop in first births has been particularly strong among women under 30. As we see in
Figure 4, first-birth rates at these ages have followed each other remarkably closely. At each age,
the rates declined until the middle 1980s, rose in parallel up to a highest value around 1990, and
then declined strongly during the 1990s. The first-birth rates of women under 25 have actually
been cut in half between 1990 and 1997. For somewhat older childless women, the birth rates
have also moved in parallel, but they have a different pattern (see the right panel of [Figure 4]).
The increase started earlier and continued longer than at younger ages, but in later years
first-birth rates have declined even at these ages. During 1997, the first-first-birth rate for 36-year-old
women was about the same as the rate at age 25. This is an entirely new pattern. During 1990,
women at age 25 had 75 percent higher rates than women at age 36. The changes in the age
structure of first-birth rates are highlighted in [Figure 5].)
It is no news that young people delay entry into parenthood. A rise in the age at first birth
started at the end of the 1960s already, and it continued until the mid-1980s. The postponement
then stopped as first-birth rates increased at the younger ages, but it got going again as fertility
dropped in the 1990s.
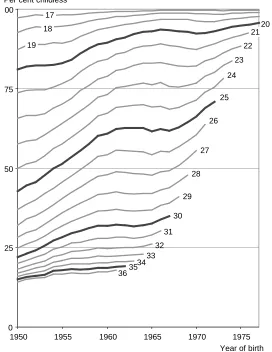
Postponed first births are reflected in an increasing prevalence of childlessness at steadily
higher ages [Figure 6]. Among women born at the beginning of the 1950s, about 40 percent were
childless at the end of the year in which they turned 25. This fraction increased successively and
reached 60 percent among women born only ten years later. The fertility increase during the late
1980s cause a break in the postponement of motherhood which produced a plateau in the percent
childless at all ages, followed by a new rise in childlessness as fertility dropped in the 1990s. At
the end of 1997, over 70 percent of women were childless at age 25. The differences between one
cohort and the next in the percent that are childless decrease as we proceed to higher ages. This
means that so far, the delay in childbearing has not caused an increase in permanent
childlessness. Swedish women have compensated for their low first-birth rates at younger ages
by getting more first births at higher ages. One may well ask whether such compensation will be
possible today as well, for childlessness has become so very prevalent at middle childbearing
Using classical demographic (indirect) standardization techniques, we may produce an
index for the general level of first-birth rates. [Figure 7] displays the time trend, standardized for
age (for ages 17 through 38). We have computed the index by dividing the annual
age-standardized figure by its value for 1990. The level fell by 35 percent between 1990 and 1997,
which is much more than the rise in the second half of the 1980s.
This standardization amounts to a very simple hazard regression with only the two factors
‘age’ and ‘(calendar) period’. The curve in [Figure 7] shows the average fertility change across
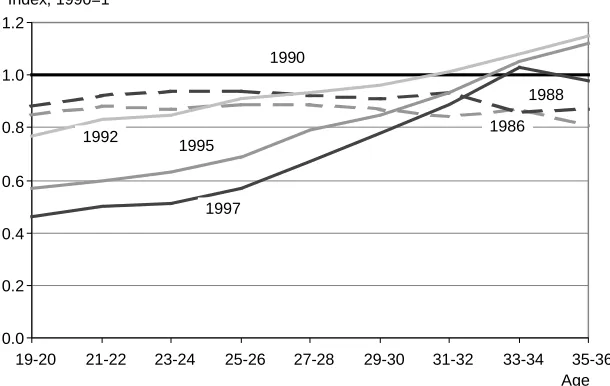
all ages. Interesting further features appear if we run an interaction between the two. As is seen in
[Figure 8], the increases in first-birth rates essentially went in lockstep between 1986 and 1990
(the annual curves in the diagram are almost horizontal); over this period the rates increased by
almost fifteen per cent at all ages. After 1990, the changes have been very different at different
ages. Fertility has decreased successively for the youngest of the childless women, and was only
about half in 1997 of what it was in 1990. As we move up through ages above 25, the decrease is
progressively smaller, and at ages between 33 and 36 there mostly has been an increase instead.
The fertility decrease among childless women after 1990 has been concentrated to the younger
age groups. This surely reflects the greater problems that young people have had in the labor
5 The impact of employment trends
To better understand how the local economic environment influences first births, we have
used the trend in the per cent employed among men and women at ages 16-64 in a woman’s
home municipality, measured in November each year. This is the only municipal-employment
indicator available to us, but we also regard it as adequate for our purpose, for it should reflect
general economic developments as perceived by local couples. To get comparability across
municipalities, we have divided each municipal employment rate by the corresponding rate for
1985 (so the index value for 1985 is 1 in all municipalities). This avoids the problem that in any
year, employment rates vary strongly from one municipality to another for structural reasons. In a
given year, a municipality with a given low employment rate might have low first-birth rates
because times are bad, but again it might have high birth rates because it largely covers a rural
district where a lower fraction of the population is recorded as having a job. For example, an
employment rate of 75 percent may be observed when times are good in municipalities that
generally have low employment rates, and the same percentage may be found when times are bad
in municipalities that generally have high employment rates. In 1990 (a year with extremely little
unemployment) only five municipalities had employment rates below 75 percent and many other
municipalities had rates over 90 percent. During the hard times five years later, only one third of
the municipalities had employment rates above 75 percent and not a single municipality had
employment above 85 percent. This makes it less satisfactory to rely on the municipal
em-ployment rates themselves as determinants of fertility than to use their trends, as we have done.
In a first experiment with our employment-trend indicator, we have included it as another
covariate in a hazard regression that also includes the calendar year and the woman’s age. This
gives the interesting result that the strong drop in first-birth rates after 1990 almost disappears in
a plot of period effects [Figure 9]. It seems that our trend indicator for the municipal employment
level reflects features that ”explain” most of the recent decline in first births. The operating
element need not be the direct monetary effect of the local employment trends themselves; it
seems equally likely that the trends influence childbearing behavior via the impressions couples
get concerning how things may develop for themselves in the near future. A sudden drop in local
times take a better turn. Whatever the ingredients of the explanation are, evidently it is not
complete, however, for the fertility increase in the late 1980s remains unaffected by the inclusion
of the new variable, and some fertility decline remains in our last couple of years.
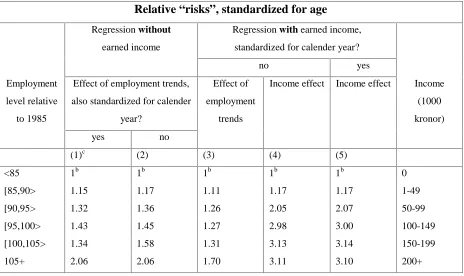
The relative ”risks” on our trend indicator (Column 1 in [Table 1]) show that first-birth
rates are strongly influenced by municipal employment trends and move closely in step with
them. As we could expect, young women are much more strongly affected than older women are
(see [4], Figure 16; not shown here). Much more easily than older women, young women can
postpone entry into motherhood when times are unfavorable to childbearing.
Despite our preference for representing a woman’s local economic environment by our
index for the employment trend in her home municipality, we have also carried out a parallel
analysis using the annual employment rates instead. This did not make much difference, except
that this alternative variable eliminated less of the trend in first births in recent years. Other
combinations of the variables available to us gave intermediary results.
Our employment-trend indicators are so closely related to the period factor that it is hard to
keep both in the same analysis. A numerical iteration process is used to estimate our factor
effects, and it is difficult to make this process converge when both of these factors are included
in the model at the same time. When we leave out the period factor, nothing much happens to the
effects we are most interested in, as is seen for instance in the second column of [Table 1].
Therefore, the calendar year is omitted in all subsequent work that involves local employment
6 The effect of labor-market attachment
We now turn to our individual-level covariates. To study how first-birth rates are affected
by (childless) women’s economic situation, we have also included her income from work (in
fixed prices) in the last previous year as a time-varying covariate. Column 5 in [Table 1] contains
the ”relative risks” for a grouped version of this factor. (In that particular regression we have
standardized for calendar year but have left out local employment trends to concentrate on
individual-level effects for the moment.) It shows that there is a very strong income effect, which
seems to work through two thresholds. If we take as our baseline women who have no income
from work (or practically none), then childless women with an annual income between 50 and
100 thousand kronor at 1997 prices,have about twice as high first-birth rates. Women with an
income of 100 thousand kronor or more have roughly three times as high first-birth rates as the
baseline group. SEK 100 000 was worth between 12 and 13 thousand US Dollars in 1997. There
is very little apparent effect of additional income beyond this level. It seems that women with a
regular job have much higher first-birth rates than those who do not, but that otherwise the
amount of the earned income is unimportant.
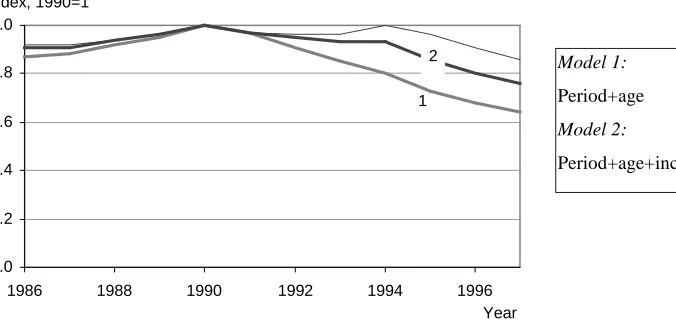
[Figure 10] shows that the inclusion of the women’s earned income from work greatly
reduces the period effect. Evidently, some of the drop in fertility in recent years is ”explained” by
the increase in the number of women who are practically without any earned income.
The analysis just reported left out local employment trends. When we re-introduce this
factor into the regression (and correspondingly remove the period factor to avoid
semi-collinearity; see Column 3 of [Table 1]), its effect turns out to be somewhat smaller than when
we disregarded the woman’s income (Column 2 in the same table), but the income effect itself
(Column 4) remains just about the same as in our simpler analysis (Column 5). As before, we
find that women with an income of 100 thousand kronor or more have around three times as high
first-birth rates as comparable women who have no (or practically no) income from work. This
result is very stable and it appears in all of our experiments. There is a similar stability in our
7 The individual woman’s labor-market situation
So far, we have not made use of our information concerning why a childless woman has
(practically) no earned income in a given year. In most cases, she is unemployed or enrolled in
education, and most often we have then recorded that she has received an unemployment benefit
or an educational grant or loan from public sources. (Only negligible groups of childless women
are unemployed or study without such allowances, or have little or no income because they are
sick or traveling abroad or for some other reason.) To pick up the effect of study and
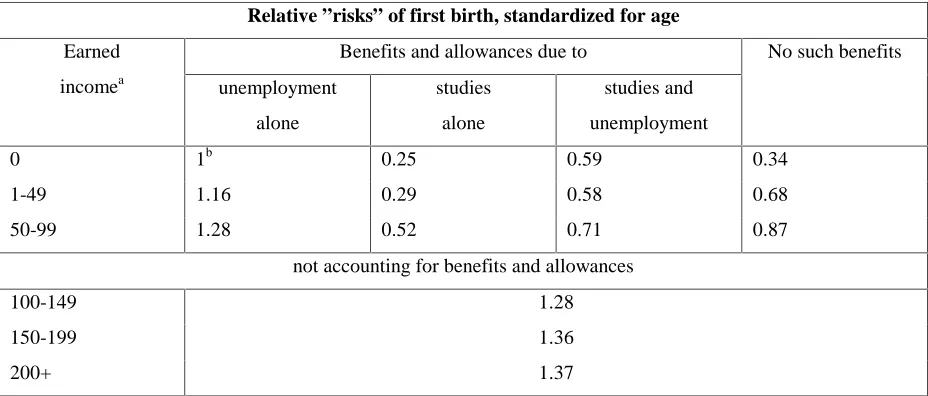
unemployment periods, we have produced another indicator, this time to represent the childless
woman’s labor-market or activity situation. The details of its definition are seen most easily in
[Table 2], which lists the relative ”risks” of first birth in an analysis that also includes the
woman’s age and municipal employment trends. (The effect of the latter covariate is much as in
[Table 1] and is not repeated here.) We have subdivided women with an annual income of less
than 100 thousand kronor (in fixed prices) according to unemployment benefits and educational
allowances received as well as according to their income from work, and have kept the three
income levels for those who earned more. As before, the latter subdivision does not reveal much
difference in childbearing behavior, but the activity situation of women with low incomes turns
out to be very important. (The different effect levels in Tables 1 and 2 are caused by the different
choices of baseline in the two tables. Note that each of the three first income categories in
Columns 4 and 5 of [Table 1] is replaced by four categories in the upper panel of [Table 2]. This
part of our analysis is based on data for childless women at ages 21-38. We have omitted women
at ages 17-20 because these days most of them go to school, and very few of them have children.)
As has been shown time and again (see, for instance, [13], Table 25 etc.; [3], [8], [2], [14]),
students clearly have by far the lowest fertility among all childless women ([Table 2]). In our
data, this is the case at each (low) income level, independently of whether the student has
on first births may be rather limited. Unemployment benefits often count on a par with income
when entitlements to parental-leave benefits are computed after a birth, so most unemployed
women should get a reasonable maternity benefit when they have their first child. An
unemployed woman may be pessimistic about her chances of landing a job anytime soon and
may want to use the waiting time to have her first child, particularly if she perceives child care as
readily available should a job offer come her way after the end of the maternity leave. Being
unemployed may thus entail inducements to start childbearing that are strong enough in a
woman’s eyes to outweigh her lowered chances of getting a job again during pregnancy and after.
(Our findings complement the few previous empirical results we have found in the literature
about the effect on childbearing of an individual’s own unemployment; see [13], Table 25 etc.,
[10], [11], p. 253. Previous results do not tally across investigations, which is natural since the
effects must depend strongly on data characteristics and circumstances in the study population.)
The situation is quite different for women who are enrolled in education (unless they have
had a job recently). Their maternity benefits are low (currently 60 kronor or some US $7 per day)
and a birth would most likely lead to a break in their studies. Starting childbearing cannot be an
enticing prospect under such circumstances. A stream of young women into educational activities
is a major intermediary cause of our declining fertility. It represents a strategy to sidestep current
difficulties in the job market and is a response to the underlying economic problems that drive
the behavior we study. (In 1989, 14.1 percent of all women at ages 21-24 received educational
allowances in Sweden. In 1996, the figure was 40.7. At ages 25-28, the figure increased from 9.1
to 21.7 percent.)
The results presented above are the outcomes of analyses based on our preferred model.
We have carried out a number of further experiments. To get a better understanding of the
character of income effects, for instance, we have replaced our labor-market or activity indicator
from Section 7 by the woman’s total income from work, unemployment benefits, and educational
allowances, taken together, subdivided according to whether she received public benefits and the
character of those benefits for women with low incomes, as in [Table 2]. We have also included
a woman’s income pattern over the two most recent calendar years preceding any current month,
not only the single most recent year. None of this changed the character of the results or even the
8 The effect of public policies
As we have seen, the natality of childless women is influenced both by their own individual
circumstances and by economic developments in their local community. They may also be
affected by changes in the level of public benefits. Families surely see such changes as signals
about authorities’ assessments concerning the country’s economic prospects, and these signals
are likely to amplify the direct consequences of purely economic factors because they affect the
expectations that families have about their own immediate future. Such expectations can be
gauged by data from a monthly survey of household purchase plans (Hushållens inköpsplaner)
run by Statistics Sweden for many years [15]. Among the information collected in this survey is
how respondents expect their own household’s economic situation to develop over the coming
twelve months. In [Figure 11] we give a picture of some of the survey outcome between early
1985 and mid-1998. We see that the respondent households were quite optimistic during the
second half of the 1980s, precisely when there was a strong increase in fertility. Expectations
changed in 1990, after which we got a period of pessimism during which Swedish natality
dropped in the manner described above. Positive signals about a pick-up in the economy
pro-duced some brief optimism during 1994, but this was reversed in parallel with cuts in family
benefits in 1995 and 1996, and it took until the end of 1997 for optimistic attitudes to return.
This late upturn came too late for us to see any effect in our childbearing data.
Our inclusion above of the individual woman’s income and activity situation and the
employment trend in her home municipality allowed us to ”explain” most of the period effect
except the rise in first births during the late 1980s and a residual decline after the mid-1990s. It is
possible that the remaining period effects are related to changes in the generosity of Swedish
family benefits, for they occur in years where such benefits were changed.
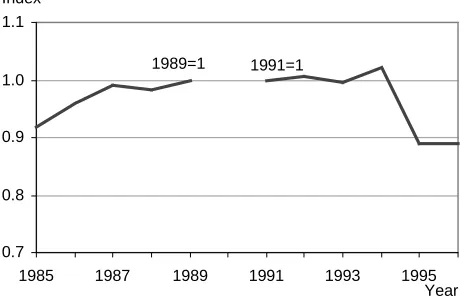
To produce an index for the development of family benefits is not straightforward, for
would get in maternity benefit (at fixed prices). To this amount we have added the child
allowance paid in the same year (also at fixed prices). The sum would give the major part of her
cash benefits during the first year after entry into motherhood if she took out all her maternity
leave continuously for the statutory number of months just after her first birth. (The system
actually allows her much greater flexibility than this [5].) We have then computed an index for
the years 1985 through 1989 by dividing the annual sum by the corresponding sum for 1989. For
1991 through 1996 we have divided by the sum for 1991. This two-tier procedure avoids
problems that would have arisen if we had produced an index for all years in the whole period,
because Sweden had a major tax reform in 1990. We have plotted the indexes for the two
sub-periods in [Figure 12] and are struck by the close resemblance with the curve for Model 2 in
[Figure 9]. We see this as evidence of an influence of directed public policies on first-birth
behavior in the Swedish population.
It is important to note that these ups and downs in Swedish first-birth rates are genuine and
not artificial consequences of tempo changes produced by reforms in family legislation, say, the
way some of the fluctuations in period Total Fertility are [Figure 1]. Some changes in social
policies in the 1980s induced a shorter spacing of births. This caused second and third births to
occur at a quickened pace ([9], [7], [1]), but it did not affect first births. Childbearing among
childless women has been affected by public policies and economic fluctuations (see also [5]),
9 Acknowledgements
This paper contains the most important findings from an earlier report [4] . The Swedish
Ministry for Social Affairs and Statistics Sweden financed our work on it. I am grateful to Jan M.
Hoem for extensive discussions concerning the present paper. Comments from the reviewers of
Demographic Research were also useful and induced me to make some of my reasoning more
References
1. Andersson, Gunnar. Childbearing trends in Sweden 1961-1997. European Journal of
Population, 1999, 15: 1-24.
2. Blossfeld, Hans-Peter (ed.). The New Role of Women: Family Formation in Modern
Societies. 1955, Boulder: Westview Press.
3. Hoem, Britta. Early phases of family formation in contemporary Sweden. In: Margaret
Rosenheim and Mark Testa (eds.). Early Parenthood and Coming of Age in the 1990s. 1992,
New Brunswick, N.J.: Rutgers University Press: 183-199.
4. Hoem, Britta. Barnafödande och sysselsättning: upp- och nedgången i fruktsamheten,
1985-97. Stockholm: Statistics Sweden, Demografiska rapporter 1998:1.
5. Hoem, Britta and Jan M. Hoem. Sweden's family policies and roller-coaster fertility. Journal
of Population Problems (Tokyo), 1996, 52 (3-4): 1-22.
6. Hoem, Britta and Jan M. Hoem. Fertility trends in Sweden up to 1996. New York: United
Nations, Population Bulletin, to appear.
7. Hoem, Jan M. Public policy as the fuel of fertility: effects of a policy reform on the pace of
childbearing in Sweden in the 1980s. Acta Sociologica, 1993, 36 (1): 19-31.
8. Kravdal, Øystein. The importance of economic activity, economic potential and economic
resources for the timing of first births in Norway. Population Studies, 1994, 48: 249-267.
9. Martinelle, Sten. Fruktsamheten nu och i framtiden. Stockholm: Statistics Sweden,
Välfärdsbulletinen, 1998, 2: 5-7.
10.Murphy, Mike. Unemployment among young people: social and psychological causes and
consequences. Youth and Policy, 1989, 29: 11-19.
11.Murphy, Mike. Economic models of fertility in post-war Britain – a conceptual and statistical
re-interpretation. Population Studies, 1992, 46: 235-258.
12.Ohlsson, Rolf (1986). Högre utbildning och demografisk förändring. Lund: Skrift 47 utgiven
13.Rindfuss, Ronald; S. Philip Morgan; and Gray Swicegood. First Births in America: Changes
in the Timing of Parenthood. 1988, Berkeley: University of California Press.
14.Santow, Gigi and Michael Bracher. Deferring the first birth in a climate of fluctuating fertility
in Sweden (working title). To appear.
15.Statistics Sweden. Hushållens inköpsplaner. 1998, Stockholm: Statistiska meddelanden P 13
Table 1:
First births in Sweden, 1986-97. Effects of individual income and local employment trends.
Relative “risks”, standardized for age
Regression with earned income,
standardized for calender year? Regression without
earned income
no yes
Employment
level relative
to 1985
Effect of employment trends,
also standardized for calender
year?
Effect of
employment
trends
Income effect Income effect Income
(1000
kronor)
yes no
(1)c (2) (3) (4) (5)
<85 1b 1b 1b 1b 1b 0
[85,90> 1.15 1.17 1.11 1.17 1.17 1-49
[90,95> 1.32 1.36 1.26 2.05 2.07 50-99
[95,100> 1.43 1.45 1.27 2.98 3.00 100-149
[100,105> 1.34 1.58 1.31 3.13 3.14 150-199
105+ 2.06 2.06 1.70 3.11 3.10 200+
NOTES:
For levels on employment trends, see left table margin. For income levels, see right table margin.
a At fixed prices, 1997=1.
b Baseline level.
c Summary of regressions:
(1) Effects of employment trends, standardized for age and calendar year.
(2) Effects of employment trends, standardized for age but not calendar year.
(3) Effects of employment trends, standardized for age, income, and calendar year.
(4) Effects of income, standardized for age, employment trends, and calendar year.
Table 2:
The effect of a woman’s own labor-market or activity situation
Relative ”risks” of first birth, standardized for age
Benefits and allowances due to Earned
incomea unemployment
alone
studies
alone
studies and
unemployment
No such benefits
0 1b 0.25 0.59 0.34
1-49 1.16 0.29 0.58 0.68
50-99 1.28 0.52 0.71 0.87
not accounting for benefits and allowances
100-149 1.28
150-199 1.36
200+ 1.37
NOTES:
a
Thousand kronor at fixed prices.
Figure 1:
Total Fertility Rate for Sweden. Smoothed monthly figures, January 1962–June 1998.
1.0 1.2 1.4 1.6 1.8 2.0 2.2 2.4 2.6
1962 1965 1968 1971 1974 1977 1980 1983 1986 1989 1992 1995 1998 Number of children
per woman
Year
Figure2:
Fertility by order of birth, 1986–1997.
The level for 1990=1 for each birth order.
0.0 0.2 0.4 0.6 0.8 1.0
1986 1988 1990 1992 1994 1996
Year Index, 1990=1
Second
Figure 3:
Per cent employed. Women and men at ages 20–34.
Source: Swedish Labor-force surveys, 1987-1997
0 20 40 60 80 100
1987 1989 1991 1993 1995 1997 Year Per cent 20 21 23 24 22 25-29 30-34 WOMEN 0 20 40 60 80 100
1987 1989 1991 1993 1995 1997 Year Per cent 20 21 23 22 24 25-29 30-34 MEN Figure 4:
Births per 1000 childless women, for each age, 17–36, 1975–1997
Figure 5:
Births per 1000 childless women, by age, 1990 and 1997
17 20 23 26 29 32 35 38
Age 1997 1990 Per 1000 0 40 80 120 160 Figure 6:
Per cent still childless at each age 17–36. Swedish women born in 1945 through 1976.
0 25 50 75 00
1950 1955 1960 1965 1970 1975
20 25 30 35 24 22 21 23 26 27 28 29 19 18 Per cent childless
Figure 7:
First births, 1986–1997, relative to 1990, all ages combined
0.0 0.2 0.4 0.6 0.8 1.0
1986 1988 1990 1992 1994 1996
Year Index, 1990=1
Figure 8:
First births, 1986–1997, relative to 1990, for selected ages
0.0 0.2 0.4 0.6 0.8 1.0 1.2
19-20 21-22 23-24 25-26 27-28 29-30 31-32 33-34 35-36 Age Index, 1990=1
1990
1988
1986
Figure 9:
First births: adjustments of the period effect due to employment trends in the home
municipalities
0,0 0,2 0,4 0,6 0,8 1,0 1,2
1986 1988 1990 1992 1994 1996 Year Index, 1990=1
1 2
Figure 10:
First births: adjustments of the period effect due to income earned
0.0 0.2 0.4 0.6 0.8 1.0
1986 1988 1990 1992 1994 1996
Year Index, 1990=1
1 2
Model 1:
Period+age
Model 2:
Period+age+employment trends
Model 1:
Period+age
Model 2:
Figure 11:
Expectations about their own household’s economic prospects over the next twelve months
Per cent who expect a ”better” situation, minus per cent who expect a ”worse” situation
-30 -20 -10 0 10 20
1985 1986 1987 1988 1989 1990 1991 1992 1993 1994 1995 1996 1997 1998 Percentage difference
Figure 12:
Estimated benefits for the year after a first birth, 1985–1989 and 1991–1996 (index). Women in
full-time employment, Fixed prices
0.7 0.8 0.9 1.0 1.1
1985 1987 1989 1991 1993 1995 Index