RESEARCH PAPER
Analysis of the Casing Collapse in Terms of
Geomechanical Parameters and Solid Mechanics
Farid Ghodusia,b, Hossein jalalifarb,*, Saeed Jafarib
a. ACECR Institute of Higher Education, Isfahan Branch, Petroleum Engineering Department, Isfahan, Iran
b. Petroleum Engineering Department, Shahid Bahonar University of Kerman, Kerman, Iran
Received: 22 April 2019, Revised: 15 June 2019, Accepted: 30 July 2019 © University of Tehran 2019
Abstract
Casing collapse is one of the major problems in oil fields, imposing a lot of costs on oil companies. This problem occurs not only at drilling times in some formations but also after the completion and production can lead to many problems. Analysis of the behavior of casing collapse in terms of geo-mechanics and solid mechanics could significantly meet the needs of the oil industry of Iran. In this study, at first, casing collapse behavior is investigated by considering the formation creep and casing production defects using numerical methods. Then, the effect of some solid mechanics parameters on the casing collapse is investigated. The results showed that casing construction defects, such as ovality and eccentricity and residual stress, could greatly reduce the casing collapse resistance. The resistance reduction of the casing is about 30.37, 9.65, and 46.87 percent respectively, so that when the casing is placed into the well, it undergoes high strain and finally could be reached to collapse. In addition, it was found that the construction defects show a higher effect on casing collapse than the salt rock creep.
Keywords:
Casing Collapse,
Casing Production Defects, Salt Rock Creep,
Geomechanics Numerical Modeling
Introduction
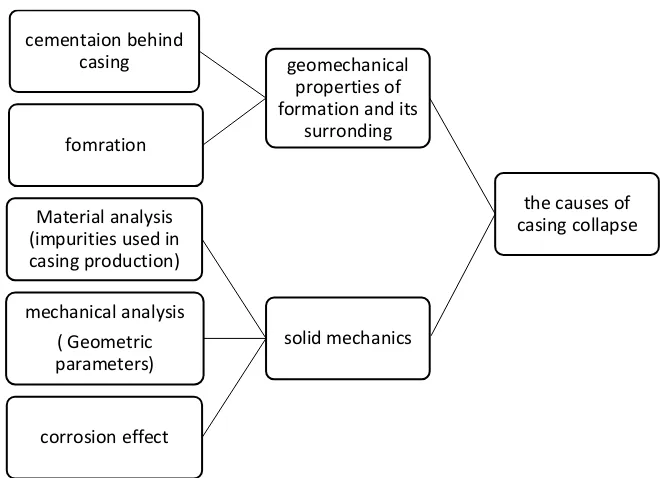
Casing Collapse is one of the major problems in upstream oil industries. Millions of dollars are annually spent on repairing, rehabilitation and re-drilling wells due to the casing collapse in oil wells worldwide. Casing collapse occurs due to a variety of factors, including soft rock creep such as salt and shale, and the creation of a point load on the casing due to the lack of good cementation behind the casing, sliding motion of the soft layer that is mechanically located between the two harder layers, reservoir subsidence due to excessive harvest or other factors such as casing production and so on. Fig. 1 shows the classification of the causes of the casing collapse in terms of geomechanical parameters (of formations) and solid mechanics.
The Geomechanical Role in Casing Collapse
In some cases, casing collapse occurs in salt formations due to salt rock creep. A time-dependent deformation which occurs under constant stress is called creep. Unlike sedimentary layers in which horizontal stresses are less than vertical tensions, tensions in salts in all directions are approximately equal to the overburden stress. Therefore, if the pressure inside the well is less than the In-situ salt strength, stress relaxation can greatly reduce the well radius. A well which its diameter decreases due to creep can stuck casings and causes many problems while casing sliding and eventually lead to casing failure, ovaling, bending, or collapse [1,2,3].
* Corresponding author
Fig. 1. classification of the causes of the casing collapse
The Role of Manufacturing Defects in Casing Collapse
It is sometimes observed that in a uniform formation in an oilfield, two casings of the same degree have been used, one of which is collapsed, but the other is not. Therefore, consideration of the casing collapse in terms of solid mechanics and manufacturing defects is important [4].
When manufacturing, casings with a completely circular cross-section are the most ideal for manufacturers, however, this is not always possible due to machine errors and the complexity of the casing production process. Thus, the casing deviates slightly from the full circular mode after its production and becomes oval [5].
The ovality of the casing is defined as follows:
𝑂𝑣 =𝑂𝐷𝑚𝑎𝑥− 𝑂𝐷𝑚𝑖𝑛
𝑂𝐷𝑎𝑣𝑒𝑟𝑎𝑔𝑒 (1)
where 𝑂𝐷𝑚𝑎𝑥 is the maximum diameter of the casing, 𝑂𝐷𝑚𝑖𝑛 is its minimum diameter and
𝑂𝐷𝑎𝑣𝑒 is its average diameter.
When producing the casing, the thickness of the casing produced may not be the same in all aspects due to machine errors and production mistakes. This defect is called casing eccentricity. If the produced casing is eccentric, the amount of external and internal pressures that it can withstand completely differs from the normal state. The casing eccentricity rate can be calculated as follows [6]:
ec =tmax− tmin
taverage (2)
where 𝑇𝑚𝑎𝑥 is the maximum thickness of the casing, 𝑇𝑚𝑖𝑛 is its minimum thickness and 𝑇𝑎𝑣𝑒 is its average thickness.
The time of the casing rupture is different. The casing collapse sometimes happens during drilling and cementing, however, in some cases, it differs from a short time immediately after running the casing into the well till over 15 years. Most of the casing collapse occurs in long times due to the rock creep including salt and shale. Here, a number of studies conducted on casing collapse are reviewed.
the causes of casing collapse geomechanical
properties of formation and its
surronding cementaion behind
casing
fomration
solid mechanics Material analysis
(impurities used in casing production)
mechanical analysis ( Geometric parameters)
Cheatham and Mc Ever [7] carried out a study that is still considered as the main source for the scholars. The results of this study are as follows:
- It is not economically possible to design the casings in the case of non-uniform heavy loads.
- If the space between the well and the casing is completely surrounded by cement or salt, the loading condition becomes uniform and its size is approximately equal to the overload pressure.
Zavarkesh et al. [8] investigated the effect of Nano silica on drilling fluid and its effect on the mechanical properties of cement and casing collapse and concluded that by adding one percent by weight of Nano silica to a cement slurry, casing collapse could be prevented.
Wilson et al. [9] obtained the size and time of loading from the salt formation to the casings by studying a sample in the Gulf of Mexico. Using finite element method, they showed that there is no need for cementation where the mouth of the well in the salt formations are uniform, and the load on the casing is evenly distributed and if the mouth of the well is non-uniform, the load is not evenly distributed on the casing, thereby accelerating the collapse; thus, cementation is needed.
Mohebi and Jalalifar [10] investigated the behavior of the casing in the Gachsaran salt formation and stated that the lack of cement behind the casing leads to the non-uniform stress on the casing surface; they declared that although the absence of cement behind the casing leads to the higher strain on the casing, in a long time, it can reduce its strain.
Nasehi et al. [11] indicated that in cement-covered casings for the types of cement with lower elasticity coefficient and Poisson ratio, the tensile stresses decreases with increasing cement thickness and the tangential stresses remained almost constant, and for types of cement with higher elasticity coefficient and Poisson ratio, most of the radial stresses over the thickness of the cement increase.
The results of a few studies conducted on the behavior of casing collapse in terms of solid mechanics which are summarized as follow:
Clinedinst [12] presented a theoretical formula that was accepted by the API as an elastic collapse pressure equation. Tamano and Mimaki [13] Tokimasa and Tanaka [14], as well as Issa and Crawford [15] investigated the effects of geometric defects in the resistance of the casing collapse and presented empirical equations using numerical analyses. Tamano and Mimaki [13] and also Tokimasa and Tanaka [14] claimed that lateral residual stresses greatly reduce the collapse pressure, however, Issa and Crawford [15] believed that their effect was very low and that the effect of residual stress was neglected in their equation. Nasehi et al. [16] modeled and analyzed the casings with high length exposed to non-uniform external pressure (taking into account the disturbance load) using the finite element method with ANSYS v12, and ultimately, compared the results from the analysis with experimental results and concluded that the buckling load is reduced as D/t ratio increases and the critical buckling load is reduced as turbulence load increases. As the turbulence load increases, its effect on the amount of the critical buckling load is reduced.
Well Data
In the well of the current study, which is referred to as Well A, sonic and density logs were run and then the dynamic elastic properties were found and using related equations converted to the static elastic properties. The data are shown in Table 1.
Also, several core trips were run in the reservoir interval aiming to get as much information as possible to fully characterize the subsurface formations. The cores were cut in 1 m length and topped up with diesel to avoid any further mud contamination or air exposure. Then, they were sent to the laboratory for further testing and obtaining mechanical properties.
Method of Analysis
Geomechanical Modelling
In the first section of this study, a multi-stage model has been developed in ABAQUS software. At first, the different components of the model, such as formation, cement, and casing, are produced for different states, and then the various characteristics of each component are allocated to the model. In this research, salt rock is considered as a viscoelastic substance and this is based on the exponential rule due to the creep behavior in the first and second stages. The casing is considered as an elastic-plastic material and cement behind the casing is regarded as an elastic material. XRD analysis of salt samples obtained during drilling showed the chemical composition of the salt in the studied field with more than 90% halite, and the remaining components are anhydrite and dolomite, which were considered in modeling the chemical composition of halite salt due to their non-fluidity. The behavioral parameters of the sample are given in Table 1.
The studied well is located in one of the oilfields in the southeast of Iran. This study aimed to investigate the behavior of the casing collapse in the vicinity of the second part of the Gachsaran salt formation, located at a depth of 2826 m. In this study, the power law and time-hardening mode have been used.
𝜀𝑐 = 𝐴𝜎𝑛𝑡𝑏 (3)
where A is the creep rate coefficient, n is the stress power and b is the hardening power. The behavioral parameters of salt rock are shown in Table 2. The cement profile used in the simulation is given in Table 3. In addition, the casing used in the 9.625-inch well has an N-80 grade with the properties listed in Table 4.
Table 1. Geomechanical parameters at a depth of 2826 meters [17] Value Abbreviation
Parameter
2214
Rock density (Kg/m3)
0.29
Static Poisson Coefficient
45
Angle of internal friction (degree)
48 h
Horizontal minimum stress (MPa)
56 H
Maximum horizontal stress (MPa)
8.897 sta
E Static Young's modulus (GPa)
37
. p p Pore pressure (MPa)
7.096 sta
K Bulk Modulus (GPa)
38
UCS
Uniaxial compressive strength (MPa)
148 . W
M Mud Weight (pcf)
0.221 C
Special heat (BTU / lb-F)
2.311 Kh
Table 2. Parameters of salt rock used in modeling [17]
Table 3. Properties of the cement used for bonding the casings to the formations in Well A [17]
Young's modulus (GPa) 2
Poisson coefficient 0.1
Density (Kg/m3) 1842
Special heat (BTU / lb-F) 0.422 Conductivity (BTU / hr-ft-fluid) 0.8
Arc Length Method
The static geometric model is used to investigate the effect of casing manufacturing defects. The analysis of a nonlinear static geometric model including plastic behavior and large deformations for the collapse and buckling is known. The load-displacement response yield a negative stiffness as illustrated in Fig. 2, so the strain energy release remains in equilibrium. A modified arc length or modified risk method is appropriate to solve these problems and has been used in the present study. This method involves a load amount, in the Load Proportionality Factor (LPF) as an additional unknown, which simultaneously solves load and displacement [5]:
𝑟(𝑈. 𝜆) = 𝐾(𝑈)𝑈 − 𝜆𝐹 (4)
where r is the Solution path a continuous set of points of equilibrium, K is the stiffness matrix, λ is LPF and F is load under this pressure. Load increment is calculated using the following equation:
𝜆 = ±√∆𝑠2− ∆𝑈
𝑛2 (5)
where arc length is equal to:
∆𝑠2 = 𝐹 𝑛𝑙𝑜𝑎𝑑 𝑠𝑡𝑒𝑜𝑠
(6)
As seen in Fig. 2 this approach yields a solution regardless of whether the response is stable or unstable [5].
Fig. 2. The displacement load curve for risk analysis [5] Value Abbreviation
Parameter
3.2879e-26 A
Power law multiplier
4.42 N
Stress power
0.5 B
Table 4. Properties of the casings used for drilling Well A [17] 9.625
external diameter (inch)
8.535 inner diameter (inch)
58.4 Weight (lb / ft)
Network-80 Grade
210×109 Modulus of elasticity (Pa)
0.545 Wall thickness (inch)
0.3 Poisson coefficient
7850 Density (Kg /m3)
Collapse Assessment
Bruno [18] proposed a correlation to calculate the critical strain that would lead to the casing collapse, considering the size and grade of the casing:
𝜀𝑐𝑟𝑖𝑡𝑖𝑐𝑎𝑙 > ( 2 𝐴𝑐) (
2𝐸𝑓𝐼
𝐸𝑐 )
0.5
(7)
where Ac is the cross-section; Ef is the young's modulus of Formation; I is the moment of inertia; the Ec is Young's modulus of the casing. This value is about 7.5% for 95
8 inch casing.
Results and Discussions
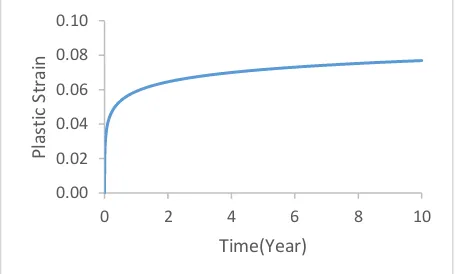
Fig. 3 shows the strain rate of the casing with no defect that has been located in well for a period of 10 years. This diagram represents the point with the most changes. As shown in the diagram, the casing strain represents elasto-plastic behavior and the rate of changes after nearly 10 years which is about 7.8%. This is higher than the critical strain calculated from the Bruno ratio (7%) and causes serious problems in the casing.
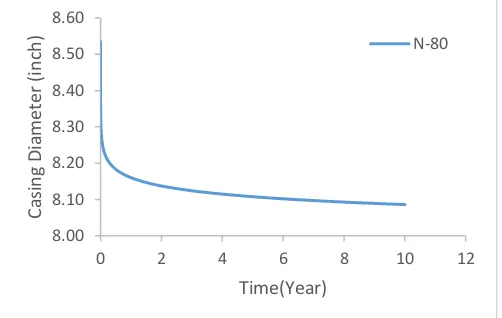
Fig. 4 shows the variations in the diameter of the casing over a period of 10 years. As shown in the Figure, the inner diameter of the casing reaches 8.19 inches after 10 years, indicating a reduction of 0.345 inches in diameter, causing serious problems during different well repair operations.
Fig. 3. Variations of strain rate for 10 years due to Gachsaran formation creep in the well.
The State of the Cement Behind the Casing
In this section, simulation is done while cement is located behind the casing. In this case, the casing is located exactly in the center of the well, and the cement works properly. This mode of simulation is an ideal condition, and the only problem is the defect of the pipe, which is not specified in geometry. The 9.625-inch N-80 grid with the specifications listed in Table 4 is included in this simulation.
0.00 0.02 0.04 0.06 0.08 0.10
0 2 4 6 8 10
Plastic
Stra
in
Fig. 4. Variation of casing diameter in the well due to creep of Gachsaran formation during 10 years
Fig. 5. a. Tension contour over well and casing at start time, b. at the end of the tenth year.
Fig. 6. Diagram of changes in the diameter of the casing in well in the Dehloran field due to the creep of the Gachsaran field during 10 years.
In Fig. 5a, the distribution of stress is shown for the case of the casing and the cement behind it at the start of the analysis. Also, in Fig. 5b, the distribution of stress for the casing and the cement behind it at the end of the 10-year period is shown. The stress on the casing increases with time. Also, as shown in a short time after the casing was inserted into the well, the casing was seriously deformed so that more than 99% of the casing diameter changes occurred in the first few days(Fig. 6).
In this part of the study, the effect of the casing resistance on its problem was investigated in one of the wells in the Dehloran field. For this purpose, a lot of casing with different resistance but 95/8-inch sizes were used for numerical simulations. The casings in this section are C95, P110, V150 and L80. Specifications for these casings are shown in Table 5.
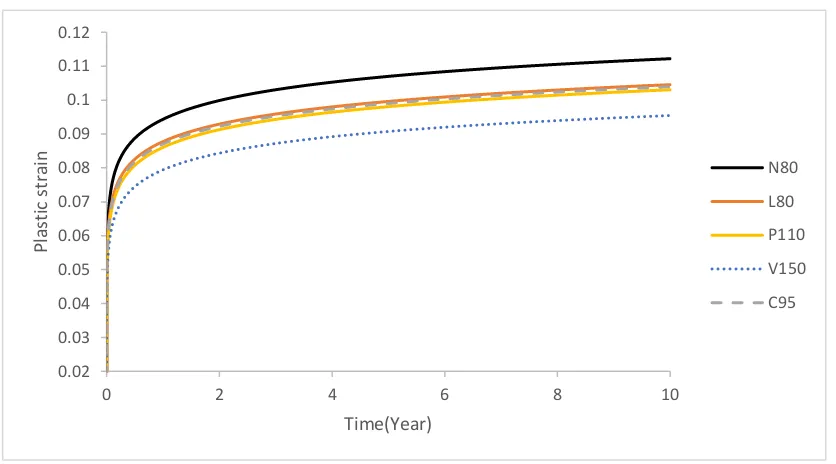
However, attention to several important forces such as bursting, tension, collapse, and the effects of composite loading in casing designing is vital. At first glance, according to Fig. 7, it
8.10 8.20 8.30 8.40 8.50 8.60
0 2 4 6 8 10
Cas
in
g
Diame
ter(
in
ch
)
Time(Year)
8.00 8.10 8.20 8.30 8.40 8.50 8.60
0 2 4 6 8 10 12
Cas
in
g
Diame
ter
(inch
)
Time(Year)
N-80
can be concluded that regardless of the economic issues of the V-150 it can withstand the tensions in well and collapse it later. But considering these points that the V-150 is not a standard grade API, it is not economically feasible for economic conditions and is not suitable for sour gas conditions as well as P-110 and C-95 are not economically feasible. The best choice for this well is L-80 grade, although its strength is the same as N-80, the L-80 casing is special for environments containing sour gas in the well. This is recommended from the point of view of the practice.
Investigating the Effect of Poisson's Ratio on Casing Collapse
In this section of the research, the effect of the Poisson ratio of cement has been studied. However, the effect of the cement Poisson ratio on the casing collapse is far less than other factors, but this parameter can be used under certain conditions, for example, when avoiding two extensions of the casing maroon oil fields to achieve cement with high resistance (low young modulus and high Poisson ratio). In order to study the effect of the Poisson ratio of cement, the simulation conditions are similar to those of the preceding ones, and the only difference between these states in applying Poisson coefficients is 0.1, 0.2, 0.15, 0.17, and 0.2. Fig. 8 shows the degree of plastic strain created in the casing due to salt creep of Gachsaran Formation. As can be seen from the figure, with increasing the cement Poisson's ratio, the plastic strain in the casing slightly increases.
Fig. 7. Variation of plastic strain rate in different casings in the well due to salt creep of Gachsaran field
Table 5. Specifications of the casing in numerical simulation
Grade Nominal Weight (lb/ft) O.D. (in) I.D. (in) Wall Thickness (in) Yield Pressure (Psi) Collapse Pressure (Psi) L-80 53.5 9 5/8 8.535 0.545 7930 6620 C-95 53.5 9 5/8 8.535 0.545 9410 7330 P-110 53.5 9 5/8 8.535 0.545 10900 7950 V-150 53.5 9 5/8 8.535 0.545 14860 8970 0.02 0.03 0.04 0.05 0.06 0.07 0.08 0.09 0.1 0.11 0.12
0 2 4 6 8 10
Fig. 8. Casing strain changes in different Poisson ratio of cement in the well during 10 years
Use of Two Tubes
One of the methods for controlling and stopping the rupture of the tubular in the salt sections is using lining and studies have shown that the tubes have the same resistance. In this method, the first 625.9 mm tubing was introduced into the well and then the 7-inch chimney is used. It should be noted that the distance between the two cement pipes will not be in the salt formations. The distance between the wall of the well and the first cement pipe is not due to the nature of the formation, which completely takes the space around the first pipe.
In order to investigate the problem of cavernous tubing caused by salt creep and its control, in this research, double-layered gauze is used in modeling. Fig. 9a and b respectively show the tension contour in the well wall and the two tubes at the beginning and end of the 10th year.
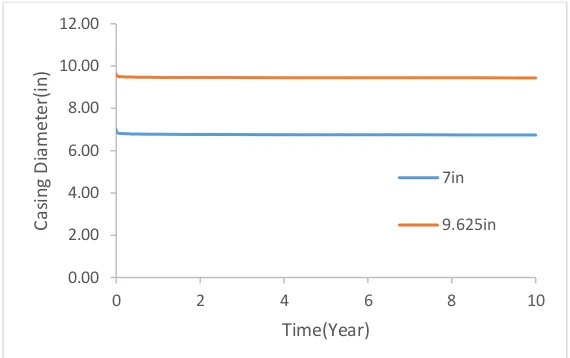
A comparison diagram of the diameters of the two tubes is shown in Fig. 10. According to the above figures, it is clear that using the two tubes could be quite enough if the only problem is the effect of rock salt creep. However, in choosing the casing, consideration should be given to the imperfections in their construction, so that if the two selected cutaway tubes have any defect, this tactic control method will not work and the cavity pipes will crumble at the same early stages.
Fig. 9. a. tension contour over well and casing at start time, b. at the end of the tenth year .
0.00 0.02 0.04 0.06 0.08 0.10 0.12
0 2 4 6 8 10
Cas
in
g
Stra
in
Time(Year)
PR=0.1
PR=0.12
PR=0.15
PR=0.17
PR=0.2
Fig. 10. Variation of diameters of two tubes in the case of simultaneous use of two tubes.
Modeling Solid Mechanics
Few models were considered in Abaqus 6.14 as follows in order to investigate and analyze the manufacturing defects of the casing.
1. 16 models in which only the casing ovality was simulated. 2. 11 models in which only the eccentricity was simulated. 3. 10 models in which only residual stress was simulated.
All models of ovality and eccentricity are mapped according to allowed tolerance calculations of diameter variation and thickness variation in API reports.
In this study, for all models, including normal states and those with structural defects, a Linear eigenvalue analysis was first performed. The placements for these modes were saved in a file as a primary defect (.fil) and used in the next analysis in order to use the effect of the shape of the modes in the buckling analysis. Otherwise, the software selectively selects the buckling mode, which usually results in unrealistic results. After the Buckle analysis, a nonlinear analysis can be used, which can be either a reciprocal or dynamic, to obtain a load-displacement curve. The maximum value of this curve is the buckling load. In the Static Risk analysis, arc-length analysis is used for post-buckling analysis.
Fig. 11 shows the model made for normal casing mode, since this casing is normal, with no structural defects (eccentricity, residual stress, ovality). This model has 400 mesh since the plastic state of the model should be determined by considering the linear independence principle. The shape of the elements was also quad dominated and the free-knitting technique was determined.
Fig. 11. FEM Model of the casing without imperfection (normal casing).
0.00 2.00 4.00 6.00 8.00 10.00 12.00
0 2 4 6 8 10
Cas
in
g
Diame
ter(
in
)
Time(Year)
7in
Modeling Validation
Validation of this modeling was conducted using data from one of the wells of the Cheshmeh Khosh oil field and the results of modeling have confirmed the accuracy and validity of the research.
Analysis of the Casing Collapse in Terms of the Ovality and Eccentricity
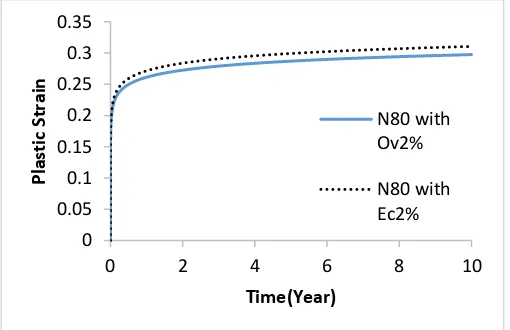
After modeling of two completely distinct modes, considering that the casing with N-80 grade has 2% of ovality, and in the second phase, this casing has 2% of eccentricity, the simulation results were as follows.
Fig. 12 shows the diagram of the plastic strain changes of the casing for the two modes, as shown in this figure. If the casing shows only 2% oval, the strain rate of the casing caused by the creep of Gachsaran formation substantially increases, and at the end of the 10 years, simulation of well conditions reaches a value of about 0.3.
Clearly, the plastic strain rate resulting from the creep of the Gachsaran Formation when the casing ovality is 2%, is higher than that of the normal casing. However, the plastic strain rate when the casing with no defect is used in the well is 0.078.
In Fig. 13, the variation in the diameter of the casing is shown for ovality and eccentricity as 2%. As shown in this figure., 2% ovality leads to the changes in the diameter of the casing as 0.335 inches when it is initially placed in the well and finally, its diameter reaches 7.85 inches after 10 years; in general, the inner diameter changes as 0.685 inch. However, the reduction in the diameter of the casing is higher than that of the casing with no defects (Fig. 13) if the casing ovality is 2%. The change in the inner diameter of the casing in the case where the casing has only 2% thickness variation is 535.0 inches, however in the first case, regardless of manufacturing defects, the change in casing diameter is 0.44 inches. In both cases, investigating casing defects has led to more than 90 % changes in casing diameter during the first few days in the well, and the casing is collapsed shortly after installation.
Fig. 12. Variation of plastic strain in the casing with initially 2% defect in eccentricity and ovality.
Results of Solid Mechanics Modeling
As stated earlier, the greatest change in the casing diameter in the Well-28 of Dehloran field occurs at the beginning of the casing installation in the well, and this indicates the necessity of solid mechanical modeling of the casing. After modeling in terms of solid mechanics, due to the fact that the casing collapse occurred during the cementation, the results were reported in several categories:
0 0.05 0.1 0.15 0.2 0.25 0.3 0.35
0 2 4 6 8 10
P
las
ti
c
Str
ai
n
Time(Year)
N80 with Ov2%
Effect of External Diameter to Casing Thickness Ratio
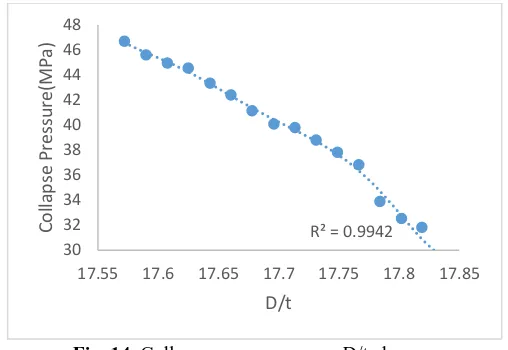
The external diameter to casing thickness (D/t) ratio for the casing, was investigated by numerical analysis for a finite range of approximately 17 to 18. The simulations, as mentioned earlier, have been done with little flaws. As shown in Fig. 14, with increasing of the d/t ratio, collapse pressure decreases. Thus, with respect to this ratio, collapse pressure could be greatly controlled.
The Effect of Ovality on the Casing Collapse
Fig. 15 illustrates the effect of ovality on collapse pressure. As shown in Fig. 15, with increasing of the casing ovality, the casing collapse pressure decreases, and this reduction in the collapse resistance is evident. The rate of collapse pressure reduction in terms of ovality variation after simulation was 30.37%.
Fig. 13. Different changes in the diameter of the casing formed in the wells, considering 2% of eccentricity and ovality due to creep of Gachsaran formation.
Fig. 14. Collapse pressure versus D/t changes
The Effect of Residual Stress on the Casing Collapse Resistance
As mentioned earlier, the production processes play a significant role in the residual stresses in the casings, and the amount and distribution of these stresses are different in the production process. After simulation and using the residual stresses from 60 to 300 MPa, which is shown in Fig. 16, collapse pressure decreases as residual stress increases. Therefore, ignoring the role of residual stress in the design of the casings leads to design errors. The percentage of casing collapse pressure reduction in terms of residual stress was obtained 46.87% using the numerical simulation.
7.80 7.90 8.00 8.10 8.20 8.30 8.40 8.50 8.60
0.00 2.00 4.00 6.00 8.00 10.00
C
as
ing
Di
am
ete
r(i
n
)
Time(Year)
N80 with Ec2%
N80 with Ov2%
R² = 0.9942 30
32 34 36 38 40 42 44 46 48
17.55 17.6 17.65 17.7 17.75 17.8 17.85
Collap
se
Pres
su
re
(MPa)
Fig. 15. Collapse pressure variation versus ovality changes
The Effect of the Casing Eccentricity on the Casing Collapse Resistance
Casing eccentricity is another flaw that occurs in the production process. After modeling for different eccentricities in the range of 1 to 17%, and performing numerical analysis of the required changes, the diagram of changes in the casing collapse was plotted with respect to the eccentricity changes. As shown in Fig. 17, the casing collapse resistance decreases with an increase in eccentricity.
The rate of collapse pressure reduction in eccentricity changes was 9.65%. Table 6 summarizes the amount of collapse pressure reduction for each of the structural defects of the casing (ovality, eccentricity and residual stress).
As shown in Table 6, the results of the numerical simulations indicate that each of the casing defects decreases the casing collapse pressure and residual stress affects the collapse pressure more than the two other parameters.
Fig. 16. Collapse pressure variations in terms of residual stress variation
Table 6. Percentage in collapse pressure reduction based on changes in structural defects of the casing Percentage of collapse pressure reduction
Parameter
30.37 Ovality
46.87 Residual stress
9.65 Eccentricity
R² = 0.99
25 30 35 40 45 50 55 60
0 0.5 1 1.5 2
Collap
se
p
re
ss
u
re
(MPa)
Ovality(%)
R² = 0.9434
20 25 30 35 40 45 50 55 60 65
0 100 200 300 400
Collap
se
Pres
su
re
(MPa)
Fig. 17. Variation of collapse pressure in terms of eccentricity changes
Conclusions
In this paper, geomechanical and numerical analyses were carried out to investigate the potential of casing damage in one of the oil fields in the west part of Iran. The results revealed that if the casing with no defect of initial production is placed in the well, it will collapse after a long period of time only due to the salt rock creep effect. However, if the casing with a defect of the initial production, such as ovality and eccentricity is used in the well, the rate of its plastic strain will be higher than the first mode, and it will collapse during drilling. These defects occur due to manufacturing processes and human and mechanical defects, having a significant effect on the collapse resistance, which are more effective than salt rock creep on the casing collapse, so that as the casing ovality, the residual stress, and the casing eccentricity decreases casing collapse resistance.
References
[1] Smith MB, Pattillo PD. Analysis of casing deformations due to formation flow. InApplied Oilsands
Geoscience Conference; 1980 Jan 15.
[2] Oliveira JE, Idagawa LS, Nogueira EC. Evaporite in Campos Basin: Geological Aspects and Drilling Problems. Report Cenpes-475. 1985.
[3] Dusseault MB, Maury V, Sanfilippo F, Santarelli FJ. Drilling through salt: constitutive behavior and drilling strategies. InGulf Rocks 2004, the 6th North America Rock Mechanics Symposium (NARMS) 2004 Jan 1.
[4] ICOFC, Linear tube and casing", Iranian Central Oil Fields Co, Tehran. 2014.
[5] Jamedari R. Collapse capacity for a pipeline with thick coating. [Master's thesis]. Ås: Norwegian University of Life Sciences; 2015.
[6] Huang X, Mihsein M. Finite element prediction of the ultimate collapse strength of casings. Proceedings of the Institution of Mechanical Engineers, Part C: Journal of Mechanical Engineering Science. 2000 Dec 1;214(12):1515-27.
[7] Cheatham Jr JB, McEver JW. Behavior of casing subjected to salt loading. Journal of Petroleum Technology. 1964 Sep 1;16(09):1069-75.
[8] Zavrakesh M, and Kazemi A. The Change of properties of drilling cement slurry using nanomaterial as an effective strategy for preventing the casing collapse. National Conference on Landscape 1404, and Technological Achievements in Engineering Sciences. 2015. (in Persian)
[9] Willson SM, Fossum AF, Fredrich JT. Assessment of salt loading on well casings. InIADC/SPE Drilling Conference 2002 Jan 1.
[10]Mohebi, R. and Jalalifar, H. "Analysis of the effect of cement on the casing stability in salt formations", Third National Conference on Oil and Gas and Related Industries. 2015. (in Persian)
R² = 0.9886
46 47 48 49 50 51 52 53
0 5 10 15 20
Collap
se
Pres
su
re
(MPa)
[11]Nasehi M, Kamali MT, Nasehi S. Analysis of stress in casings covered with cement in oil and gas wells using the finite element method. Third National Congress of Petroleum Engineering. 2011. (in Persian)
[12]Clinedinst WO. A rational expression for the critical collapsing pressure of pipe under external pressure. InDrilling and production practice. 1939 Jan 1.
[13]Tamano T, Mimaki T, Yanagimoto S. A new empirical formula for collapse resistance of commercial casing. Nippon Steel Tech. Rep.. 1985 Jul(26):19-26.
[14]Tokimasa K, Tanaka K. FEM Analysis of the Collapse Strength of a Tube. Journal of Pressure Vessel Technology. 1986 May 1;108(2):158-64.
[15]Issa JA, Crawford DS. An improved design equation for tubular collapse. InSPE Annual Technical Conference and Exhibition. 1993 Jan 1.
[16]Nasehi M, Kamali MT, Nasehi S. Buckling analysis of casing using finite element method. Third National Congress of Petroleum Engineering. 2011. (in Persian)
[17]ICOFC Drilling Program (Dehloran -28 oil well), Dehloran, Iran. 2012.
[18]Bruno MS. Geomechanical and decision analyses for mitigating compaction-related casing damage. SPE drilling & completion. 2002 Sep 1;17(03):179-88.
![Table 1. Geomechanical parameters at a depth of 2826 meters [17] Parameter Abbreviation Value](https://thumb-us.123doks.com/thumbv2/123dok_us/8948515.1857883/4.595.148.448.571.766/table-geomechanical-parameters-depth-meters-parameter-abbreviation-value.webp)
![Fig. 2. The displacement load curve for risk analysis [5]](https://thumb-us.123doks.com/thumbv2/123dok_us/8948515.1857883/5.595.199.401.585.748/fig-displacement-load-curve-risk-analysis.webp)
