University of New Orleans University of New Orleans
ScholarWorks@UNO
ScholarWorks@UNO
University of New Orleans Theses and
Dissertations Dissertations and Theses
Fall 12-17-2011
Data Exploration Interface for Digital Forensics
Data Exploration Interface for Digital Forensics
Varun Dontula
University of New Orleans, [email protected]
Follow this and additional works at: https://scholarworks.uno.edu/td
Part of the Computational Engineering Commons, Data Storage Systems Commons, and the Other Computer Engineering Commons
Recommended Citation Recommended Citation
Dontula, Varun, "Data Exploration Interface for Digital Forensics" (2011). University of New Orleans Theses and Dissertations. 1373.
https://scholarworks.uno.edu/td/1373
This Thesis is protected by copyright and/or related rights. It has been brought to you by ScholarWorks@UNO with permission from the rights-holder(s). You are free to use this Thesis in any way that is permitted by the copyright and related rights legislation that applies to your use. For other uses you need to obtain permission from the rights-holder(s) directly, unless additional rights are indicated by a Creative Commons license in the record and/or on the work itself.
Data Exploration Interface for Digital Forensics
A Thesis
Submitted to the Graduate Faculty of the University of New Orleans in partial fulfillment of the requirements for the degree of
Master of Science in
Computer Science Information Assurance
by Varun Dontula
ii
ACKNOWLEDGEMENT
iii
Table of Contents
Chapter 1. Introduction ... 1
Chapter 2. Tree Visualization Technique ... 5
2.1 Data Structure Tree ... 5
2.2 Radial Tree Layout ... 6
2.3 Bubble Trees ... 7
2.4 Treemap Structure ... 7
2.5 Sunburst Tree ... 9
2.6 Summary ... 9
Chapter 3. New Data Exploration Interface ... 11
3.1 JSON ... 11
3.2 Data processing pipeline ... 12
3.3 Visualization desigh sketch ... 12
3.3.1 File system heirarchy ... 13
3.3.2 Spatial heirarchy ... 14
3.3.3 Interaction between views ... 15
Chapter 4: Implementation ... 16
4.1 JSON input data interface ... 16
4.2 Technogies used ... 17
4.3 An example ... 18
4.3.1 Basic view ... 18
4.3.2 File system heirarchy view ... 18
4.3.3 Spatial heirarchy ... 20
4.3.4 Interaction between File system heirarchy and spatial heirarcy ... 26
Chapter 5: Conclusion ... 28
iv
v
List of Figures
Figure 1: EnCase Forensic main screen………..………...2
Figure 2: FTK interface………...3
Figure 3:Intella screenshot(Vound)………4
Figure 4: Example of Data structure tree……….………..5
Figure 5: Example of Radial Tree layout……….………..6
Figure 6: Example of a Bubble tree………..……….…7
Figure 7: President‘s 2011 Budget proposal………..8
Figure 8: Example of a Sunburst tree………...9
Figure 9: Overview of the process………...………..……….…….12
Figure 10: Design sketch………..…13
Figure 11: The basic view with Sunbust visualization, Treemap visualization and Filters……...….18
Figure 12: ‗AIM_6.8.12.4‘ node and its child nodes Expanded………..………....19
Figure 13: ‗AIM_6.8.12.4‘ and its child nodes collapsed/hidden………...……….20
Figure 14: ‗metal_ss.dll‘ is highlighted and with size: 362496kB………..21
Figure 15: Next hierarchical level of the selected node………...22
Figure 16: hierarchy of ‗metal_ss.dll‘……….….22
Figure 17: Highlights all files with keyword ‗excel‘ in name attribute………...……….23
Figure 18: File type filter ‗dll‘ selected, nodes of dll files displayed………..24
Figure 19: Files that are created in the time period 1992-2005………..…….25
vi
vii
Abstract
The fast capacity growth of cheap storage devices presents an ever-growing problem of scale for digital forensic investigations. One aspect of scale problem in the forensic process is the need for new approaches to visually presenting and analyzing large amounts of data. Current generation of tools universally employ three basic GUI components—trees, tables, and viewers—to present all relevant information. This approach is not scalable as increasing the size of the input data leads to a proportional increase in the amount of data presented to the analyst.
We present an alternative approach, which leverages data visualization techniques to provide a more intuitive interface to explore the forensic target. We use tree visualization techniques to give the analyst both a high-level view of the file system and an efficient means to drill down into the details. Further, we provide means to search for keywords and filter the data by time period.
1
Chapter 1: Introduction
Digital forensics analysts are currently struggling to keep up with the fast increasing size of forensic targets. Looking forward, we can expect the pressures of scale to increase further due to the following fundamental trends:
The size and complexity of forensic targets will continue to grow for the foreseeable future. Hard drives have recently reached the 3TB mark with realistic medium-term prospects of 14TB by 2018. ‖In FY09, the RCFL Program nearly doubled the number of TBs processed compared with only two years ago.‖ [1]
Human resources charged with the problem will not grow appreciably. Relative to the growth of the data, the growth in the number of analysts will be negligible as it is yet another cost to be born to maintain societal law and order.
There are real-world deadlines on most forensic analyses. Forensic lab managers and practicing analysts are acutely aware of this fact. In a criminal case, there might be the luxury of having more time to investigate the case; in civil/internal cases, there are strict limits on the time and resources clients will spend.
Put together, these trends mean that the forensic analyst will have to do substantially more work in about the same amount of time per case. Clearly, the forensic tools will need to become a lot faster and smarter. One particular aspect in which current tools a sorely lacking is their user interface.
2
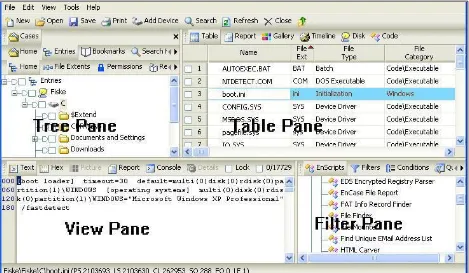
Figure 1: EnCase Forensic main screen.
EnCase Forensic is an integrated Windows-based graphical user interface suite of tools. The interface contains four different panes: tree, table, view and filter as shown in Figure 1. This interface helps the analyst navigate and to observe an object in detail.
3
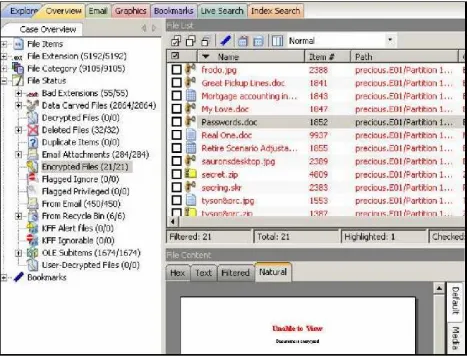
Figure 2: FTK interface.
Forensic Toolkit (FTK) is another commonly deployed forensic tool which is also operated on Windows platform. FTK toolkit interface has different tabs such as E-mail and images, to include specialized views for browsing particular file types. FTK analyzes the data located on the storage device, and then it will index all the files and group them together according to the file hierarchy of the system as shown in Figure 2. As more data is extracted from the source, the investigator is bombarded with more data and has to spend more time and put more effort to search through all the data. Even filter options might not scale properly and thus transfers the load on to the investigator.
4
space available with data interaction. Data interaction strongly depends on the given exploration task, such as searching, or filtering which certainly includes an easy and intuitive navigation with strong support for the user‘s orientation.
Figure 3: Intella screenshot (Vound).
5
Chapter 2: Tree Visualization Techniques
In this chapter we discuss most commonly used tree visualization techniques to represent the data. The tree view provides an overview of the dataset that facilitates navigation through the data, and provides context for the more detailed information available in the supplemental nodes. The leaves, while representing the individual data records, are both decorative and functional.
2.1 Data Structure Trees
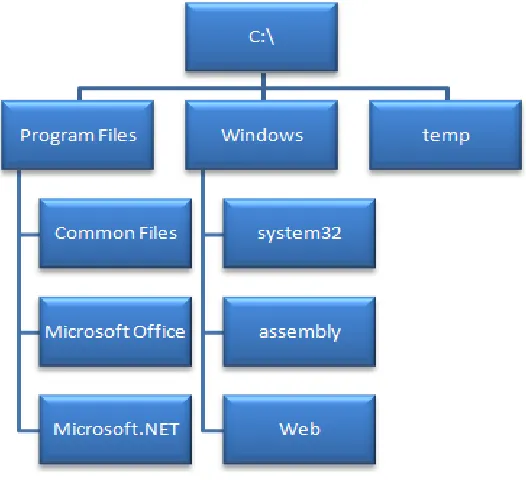
Data tree structure provides the viewer to understand the hierarchical relationships among the data items and helps in exploiting the organization of the data. Data structure trees are useful since a great deal of information is hierarchical: file systems, corporate relationships, a library cataloged to the decimal system to name a few.
Though this tree structure shows the hierarchy and relationships among the data, it does not give the details about individual items. In the Figure 4 we can only see one attribute, the name. It is possible to encode a second attribute by using color or using some special symbols. The number of nodes in each level increases, as distance from the root increases; therefore there is a large amount of wasted space.
6
In the example shown in Figure 4, note the wasted space in the corners of the tree. The width of conventional data structure trees increases exponentially relative to the height. This causes distortion and makes the tree difficult to read.
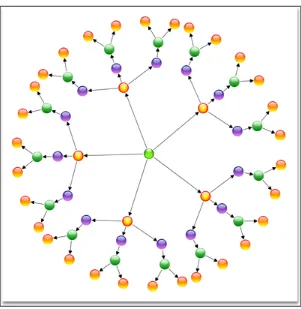
2.2 Radial Tree Layout
Radial tree layout is another tree technique which attempts to solve the space problem by rearranging the hierarchical data items, an example is shown in Figure 5. This tree structure obeys the chain of commands, but shows only limited attributes and does not work well for deep hierarchies. When the focus is shifted away from the root it is hard to understand the structure of file system. In this approach, the nodes that are on the outer edge of the large trees tend to be tiny and difficult to see, as they are constrained to fit the circular space.
7
2.3 Bubble trees
In bubble tree techniques, the space problem is reduced by converting the typical rooted data structure tree into a general graph-theory tree that efficiently utilizes page space [5]. These trees are abstract and only a limited number of hierarchical levels can be displayed. It is also difficult to perform tasks, such as comparison, because only limited sub-levels are shown for any node at a time. In Figure 6, it is difficult to compare descendants of node 1 with the descendants of node 3.
Figure 6: Example of a bubble tree.
2.4 Treemap
8
change either the size or colors of the items on the map [8]. The size of an item is the usual way of representing relationships between some values. Colors can also be used to visualize how often the size of the an object changes. For example, mapping the color of an entity to red when its properties change often and to green when its properties change rarely makes the changes clear.
The problem is when the tree is balanced, where each parent has the same number of children and each leaf has the same size. Then representation can make it difficult for the user to determine where the node is in the level and how the current node is related to other node at the same level. Figure 7, represents the President‘s 2011 Budget proposal, where different colors and levels of brightness can easily be spotted from treemap visualization.
Figure 7: President’s 2011 Budget proposal
9
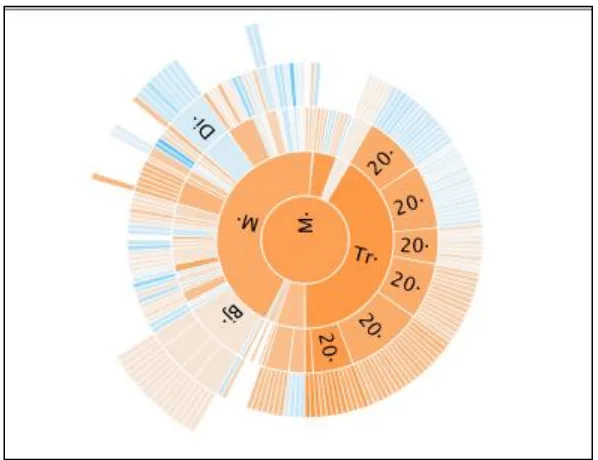
2.5 Sunburst
Another solution to space issues is to rearrange the tree to take better advantage of space. Sunburst trees are radial space filling technique, an example is shown in Figure 8. This technique takes a data structure tree in which each subtree is represented as a triangle and arranges the tree radially [9]. The subtrees become segments of the circles with the root as a small central circle. Each successive ring represents a level of the tree. The leaves are segments on the outermost circle. This addresses some of the space concerns about standard data structure tree by fitting the tree into a compact space that clearly preserves the hierarchy and allows comparisons of leaves to leaves within a level. Sunburst techniques clearly show the hierarchy, but also illustrate limited attributes and do not work well for a deep hierarchy.
Figure 8: Example of a Sunburst tree.
Summary
10
11
Chapter 3: New Data Exploration Interface
As we have explained earlier in Chapter 1, the current GUI designs are not suitable and might be too hard for the analyst to interpret and investigate massive targets of data. At the same time there has been a significant development in the web based tools and the success of these tools depends on the user interface design provided. These web tools provide GUI designs that can represent large amounts of data. The goal of this development is to provide an enhanced tool that is scalable and useful for managing the data using Web display and navigation. An open
architecture can directly benefitted from the fast development of visualization tools for the web and can be integrated at minimal effort.
In this section we present our user interface design that will be simple to use but more
scalable and that will be using certain web based technological tools to represent the digital
forensic data.
3.1 JSON
12
3.2 Data processing pipeline
The data we obtain is from the system and the information that is available to the system and recorded on the storage device is obtained from the target by forensic analyst. The recovered metadata is used by the investigators for future analysis processing. The metadata discusses the forensic value of the information that is found. Forensic value means the possibility to draw conclusions about events on the system from the data. So this metadata is of large size since it contains information of all the files on the storage device. Since JSON is a light weight data format, the metadata used for visualization is in JSON format.
Figure 9: Overview of the process.
Figure 9, shows the overview of the process, the extracted data from the file system is used as JSON format.
3.3 Visualization Design Sketch
User interface (UI) design and interaction are the major factors in designing visualization systems that help the user to explore the data. We can divide visualization systems in general into two main components: representation and interaction.
The representation component concerns the mapping of data into visual representations and comes from the field of computer graphics.
The interaction component comes from the field of human-computer interaction and involves the dialogue between the user and the system.
13
essential part of visualization systems because without it the visualization techniques just become static images or autonomously animated images [6].
In our design we have two visualization hierarchies, first is the file system hierarchy, as defined by the relationship between parent and number of child nodes and the other is spatial hierarchy, which uses space filling visualization that uses containment to show the parent child relationship. The file system hierarchy is represented using Sunburst visualization and the spatial hierarchy is represented using treemap visualization.
Figure 10: Design sketch.
3.3.1 File system hierarchy
14
nodes are drawn within the arc subtended by their parents. The angle of an item's arc corresponds precisely to the number of child nodes in the file structure.
User controls are added to the visualization to make it more user interactive. Hovering the mouse on to the node gives the time of creation of file and the name of the file. Another interactive control is the expand control which is used to hide or expand the parent and child node. At the start, file system hierarchy is set to expand view, so that all child nodes and parent nodes are visible. By clicking on a particular node the child nodes hide/collapse or expand depending on the present state of the node selected.
3.3.2 Spatial hierarchy
Next is the spatial hierarchy, we represented this using treemap visualization. In Figure 10, the design of treemap visualization is shown; the full display space is used to visualize the contents of the tree. Each node (as shown in the tree diagram) has a name. The size of leaves represent for instance the size of individual files. The treemap is constructed via recursive subdivision of the initial rectangle. The size of each sub-rectangle corresponds to the size of the node. The direction of subdivision alternates per level: first horizontally, next vertically, etc. As a result, the initial rectangle is partitioned into smaller rectangles, such that the size of each rectangle reflects the size of the leaf. The structure of the tree is also reflected in the Treemap, as a result of its construction. Color and annotation is used to give extra information about the leaves.
We define the following user controls to helps the investigator working with the visualization with interactions.
Hovering: Hover over a rectangle in layout and see to which child does this corresponds to and
the size of the file. This is an essential visualization as without it the rectangles are meaningless.
File type selection: Limit the data display to a specific file type group. At first ‗All File Type‘ is
selected we can narrow this to select any file type present in the data provided.
Zooming: ‗Zoom in‘ to a sub-cause having it occupy the whole screen to give more detail on the
15
Search: Using the search box, the investigator can search for the file by entering the name.
Timeline slider: One more interactive option is the timeline slider. The users can jump to
different times or choose time ranges in which to analyze the quality attributes. The Treemap show only the files accessed in that particular time period.
3.3.3 Interaction between views
Linking the two visualizations with each other allows the analyst to drill down into the data and makes the search easy. The triangular boxes/nodes in sunburst visualization show hierarchical level and the name of the node, and the clicked nodes affect the contents of treemap visualization. This allows analyst to connect both visualizations and drill down further into different parts of data, without losing the view of the entire data.
16
Chapter 4: Implementation
This chapter describes the implementation of the design presented in Chapter 3.
4.1 JSON input data interface
As defined in section 3 the generated file is in JSON (JavaScript Object Notation).The properties of JSON such as language-independence data interchange format makes it useful.
The JSON body file is an intermediate file when creating a timeline of file activity. It is a pipe delimited text file that contains one line for each file (or other even type, such as a log or registry key). The file contains the information about the deleted file as well. The body file produced consists of file name, file creation time and crtime.
JSON is built on two universal structures [7]:
A collection of name/value pairs represented as a user-defined object. An ordered list of values represented by an array.
In various languages, the collection of name pairs can be realized as an object, record, struct, dictionary, hash table, keyed list or associative array and ordered list is realized as an array, vector, list or sequence. Below example show the object and array types:
[
{"name":"Root/$OrphanFiles", "size":0, "crtime":"1970-01-01 00:00:00 UTC"},
{"name":"Root/WINDOWS/inf/oem3.inf (deleted)", "size":0, "crtime":"1970-01-01 00:00:00 UTC"},
{"name":"Root/$Secure:$SDH", "size":56, "crtime":"2008-10-20 14:26:07 UTC"},
{"name":"Root/Program Files/Microsoft Office/Office12/1033/STSLIST.CHM", "size":367096,
"crtime":"2006-08-17 19:50:18 UTC"},
{"name":"Root/WINDOWS/Fonts/RAVIE.TTF", "size":74416, "crtime":"1998-07-14 21:42:16 UTC"}
]
17
second attribute is the size attribute, which shows the size of the file. This is a numeric value, and size of file is in kB. The last attribute is the crtime, which give the creation time. This attribute is represented in UTC format, which is calculated into seconds and used for future purposes.
4.2 Technologies used
We wanted to have a lightweight and ubiquitously available modular visualization tool for the analysis of the run-time behavior of quality variability, we chose Adobe Flash [8] as the target programming environment. Adobe Flash Player is a cross-platform browser plug-in and so this tool can therefore be used on various platforms that have Adobe Flash Player. Flash applications are compiled into the SWF file format (SWF is not an acronym, although it is associated with Shockwave Flash) [9] and are run on an ActionScript Virtual Machine 2 [10] (AVM) inside Flash Player.
The following are the languages we used:
MXML: MXML is an XML markup language that is used to layout user interface components. We use MXML in combination with Action Script to develop rich internet applications.
Flex Library project: Flexlib project is an open source user interface components for Adobe Flex. Currently there are many mxml enhanced components, like TreeGrid, FlowBox etc. We used Flexlib libraries mainly for Draggable Slider component.
Action Script: Action Script Language adds the complex interactivity and data display in the application. Action Script contains a large amount of built in library with which we can create such a visual application. Flex builder supports more than one version of action script; we used action script 3.0 which thoroughly follows the rules of object oriented programming style. Action Script 3.0 executes extremely fast which makes it perfect for complex visualizations and data manipulations.
18
has many usable visualization techniques, it is not a ready to use tool, rather a toolkit for the developers to use to create visualization intended for data visualization [11].
4.3 An example
4.3.1 Basic view
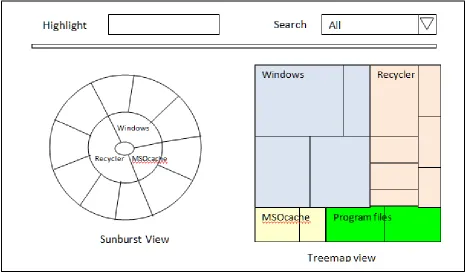
The Visualization shown in Figure 11 is an example of the prototype system. The application is an SWF file and this SWF file can be played in any Adobe Flash Player, working on a browser. The basic view of the project is shown in Figure 11.
Figure 11: The basic view with sunbust visualization, treemap visualization and Filters.
This figure show two views the sunburst visualization and the treemap visualization, along with the filter: highlight, file type filters and Timeline Slider.
4.3.2 File system hierarchy view
19
difference in depth. When a particular node is clicked the, if it has any child node all the child node hide/collapse and expand depending on the present state of the node. As shown in Figure 12, When we move the mouse over the node the name of the file is shown, and clicking on ‗AIM_6.8.12.4‘ node the child nodes of this parent collapse as shown in Figure 13.
20
Figure 13: ‘AIM_6.8.12.4’ and its child nodes collapsed/hidden.
4.3.3 Spatial hierarchy
21
Figure 14: ‘metal_ss.dll’ is highlighted and with size: 362496kB.
By moving the cursor over the node the name of the node ‗metal_ss.dll‘ is shown in Figure 14, and the hierarchy is also shown. It also highlights the size of the file. The number shown in the bottom of the box is the creation time in seconds.
22
Figure 15: Next hierarchical level of the selected node.
Clicking on the selected node again zooms in to visualize the next hierarchical level. The parent node of the hierarchical level displayed is shown in the bottom left corner. In figure 16, we can see the consecutive parent nodes of the ‗metal_ss.dll‘
23
Figure 17: Highlights all files with keyword ‘excel’ in name attribute.
24
Figure 18: File type filter ‘dll’ selected, nodes of dll files displayed.
25
Figure 19: Files that are created in the time period 1992-2005.
Another most important interactive option is the timeline slider. In the figure 19 we show the files that are created in the time period selected. The timeline slider also has an option of dragging the visible region.
26
4.3.4 Interaction between file system hierarchy and spatial hierarchy:
Most important is the interaction between the views. In Figure 20 and 21, we can see the whole view and the changed treemap visualization when the node ‗Temp‘ is selected in sunburst visualization.
27
28
Chapter 5: Conclusion
In this work, we argued that the current generation of forensic tool user interfaces is inadequate in terms of helping forensic analysts cope with the rapid growth in the size of digital forensic targets. We presented a new approach to designing data exploration interfaces based on data visualization techniques that builds on the experience of web technologies
Specifically, we demonstrated the successful use of sunburst and treemap visualizations to render topological and special relationships in the file system‘s hierarchy. Unlike existing techniques, this allows a quick and intuitive way to both present an aggregate view of the data and to drill down into the details. We integrated three filtering techniques—keyword search facility, file type filter, and time interval filter. Together, these present an easy way to control the most frequently used filtering techniques. The results of the filters can be observed on the data visualizations in real time, thereby giving the investigator immediate feedback and a chance to build a high-level mental map of the evidence.
29
References
[1] Richard, G., Roussev, V. Next Generation Digital Forensics: Strategies for Rapid Turnaround of Large Forensic Targets. Communications of the ACM, Vol. 49(2), Feb 2006.
[2] EnCase Forensics URL:http://www.guidancesoftware.com/ .
[3] FTK toolkit URL: http://accessdata.com/ .
[4] Intella eDiscovery URL:http://www.vound-software.com/ .
[5] Richard Boardman. Bubble trees. In Extended Abstracts Conference on Human Factors in Computing Systems, The Hague, 2000.ACM Press.
[6] Fekete JD., Plaisant C. (2002) Interactive Information Visualization of a Million Items. In: Proceedings of the IEEE Symposium on Information Visualization, October 28-29, 2002, Boston, Massachusetts, USA, pp. 117–124.
[7] John Stasko and Eugene Zhang.Focus + context display and navigation techniques for enhancing radial, space-Filling hierarchy visualizations. Technical Report GIT-GVU-00-12, Georgia Institute of Technology, 2000.
[8] Yi J. S., Kang Y. a., Stasko J.T. &Jacko J.A. (2007) Toward a Deeper Understanding of the Role of Interaction in Information Visualization. In: IEEE Transactions on Visualization and Computer Graphics 2007, Vol.13 Issue 6, pp. 1224–1231.
[9] ―JSON‖ URL: http://www.json.org/ .
[10] Adobe Flash platform. URL: http://www.adobe.com/flashplatform/.
[11] Adobe SWF File Format Specification Version 10. (Accessed 1.2.2010). URL:
http://www.adobe.com/devnet/swf/pdf/swf_file_format_spec_v10.pdf.
[12] Adobe ActionScript Virtual Machine 2 (AVM2) Overview. (Accessed 1.2.2010). URL:
http://www.adobe.com/devnet/actionscript/articles/avm2overview.pdf. [13] Flare Introduction URL: http://flare.prefuse.org / .
[14] Ka-Ping Yee, Danyel Fisher, RachnaDhamija, and Marti Hearst,‖Animated Exploration of Dynamic Graphs with Radial Layout‖, InfoVis 2001.
[15]Flare prefusetreemap layout URL:
http://flare.prefuse.org/api/flare/vis/operator/layout/TreeMapLayout.html .
[16]"SquarifiedTreemaps" In Data Visualization 2000, Proceedings of the Joint Eurographics and IEEE TCVG Symposium on Visualization, 2000, pp. 33-42. URL:
30