TEXTILE TECHNOLOGY
Fiber Micronaire, Fineness, and Maturity Predictions Using NIR Spectroscopy
Instruments on Seed Cotton and Cotton Fiber, in and Outside the Laboratory
Jimmy Zumba, James Rodgers, and Matthew Indest
J. Zumba (formerly) and M. Indest, Oak Ridge Institute for Science and Education (ORISE), 1100 Robert E. Lee Blvd., New Orleans, LA 70124; and J. Rodgers*, USDA-ARS– SRRC, 1100 Robert E. Lee Blvd., New Orleans, LA 70124. *Corresponding author: cottondoc1948@gmail.com
ABSTRACT
Micronaire is an important fiber quality parameter in the cotton and textile industry. Mi-cronaire is a function of maturity (the degree of
the fiber secondary wall development) and fine
-ness (linear density). In prior research, bench-top near infrared (NIR) spectroscopy demonstrated
the ability to measure micronaire, maturity,
and fineness in and out of the laboratory. Small, portable handheld NIR instruments have been introduced and a program was established to
measure micronaire in and outside the laboratory
on seed cotton fiber and cotton lint, and conse
-quently to measure maturity and fineness in the fiber. Adding new data to the original commercial lint-only samples, including data from different environments (laboratory and greenhouse) and fiber type conditions (laboratory ginned lint and seed cotton) made the calibration more robust, in
-creasing the accuracy of the two NIR instruments (MicroNIR 2200 and Luminar5030) used in this experiment. Each instrument has its individual strengths. It is advisable to use the instrument that best fits the laboratory research objectives.
M
icronaire is an important fiber quality parameter in the cotton industry (USDA-AMS,2005). High or low fiber micronaire measurements can impact the downstream fiber processing and final product quality. The current traditional fiber quality
analysis for micronaire uses a compression method, such as a high volume instrument (e.g., Uster®
HVI™) and Fibronaire. HVI is a modular system
that measures several cotton fiber quality parameters
at once, including micronaire; Fibronaire is an instrument that measures micronaire only. The HVI
is used by the USDA-Agricultural Marketing Service (AMS) as the primary instrumental method for cotton classing and it is used widely internationally for cotton classing and cotton quality measurements, including micronaire. The sample size for the HVI micronaire measurement is approximately 10 g;
often, for samples whose sample size is not sufficient
for HVI micronaire measurement or for laboratories that do not have a high volume instrument system, the Fibronaire is used (3.24-g sample size). The HVI and Fibronaire micronaire values are similar and in close agreement—often within ±1 micronaire unit (Rodgers et al., 2015). Both instruments use pressurized air and a compressed sample, measuring
the air flow resistance in a given fiber weight and
volume, but HVI can be expensive and both require
controlled lab conditions. To perform cotton fiber
micronaire measurements by traditional methods, the
cotton first has to be harvested in the field, then the seed cotton is ginned and fiber samples for analyses labeled. Once labeled, the fiber samples are sent to the fiber lab for quality analysis. In the laboratory, fiber testing is performed under controlled conditions
(21 ±1 ºC and 65 ±2% relative humidity [RH]) after
the fiber has been conditioned a minimum of 24 h (ASTM, 2015). Thus, from field harvesting to laboratory analysis, the fiber quality analysis is a
tedious and lengthy process that can take days to complete.
Fiber micronaire is the function of maturity (the
degree of the fiber secondary wall development) and fineness (linear density) (Wakelyn et al., 2007).
An instrument used globally for measuring cotton
fiber maturity and fineness (along with several other
properties) is the Uster® Advanced Fiber Information
System (AFIS). A recently introduced laboratory instrument, the Cottonscope, accurately and
pre-cisely measures cotton fiber fineness, maturity, and
ribbon width using polarized light microscopy and
image analysis on individual longitudinal fibers in
a water medium (Gordon and Naylor, 2012; Paudel et al., 2013; Rodgers et al., 2012). The maturity and
fineness than the AFIS (Rodgers et al., 2013). The
Cottonscope also has the capability to measure
micronaire, and the differences between the Cot -tonscope and HVI, and Fibronaire micronaires are acceptable and often within ±0.3 micronaire units (Rodgers and Delhom, 2015). The Cottonscope is
especially useful for fiber measurements where only
a small quantity of cotton sample is available (e.g., a
single cotton boll down to a few milligrams of fiber).
Indest (2015) demonstrated that only instruments
that analyze individual fibers or fiber sections (e.g.,
Cottonscope) can capture how variable a cotton variety genotype is within an environment and that micronaire alone is a poor representation of both
fiber maturity and fineness.
As noted above, the current laboratory micro-naire techniques demonstrate the need for new, rapid, reliable, and accurate complementary
tech-niques for the measurement of fiber micronaire and its components (maturity and fineness) that can
be performed both in and outside the laboratory,
without the need of a substantial amount of fiber, fiber preparation, and laboratory conditioning. A
technology that addresses these needs is near in-frared (NIR) spectroscopy. Burns (1985) described the NIR spectral region as the region between the visible and mid-infrared spectral region, from 800 to 2500 nm with the primary NIR spectra region occurring between 1100 to 2500 nm. NIR absor-bance is obtained from the light interaction with
the sample; the intensity of the diffuse reflectance
from the sample received by the detector is de-pendent on both the sample chemical components (molecular absorbance) and physical properties
(scattering/specular reflectance). NIR spectra are
composed of overtones and valence vibrations of XHn groups (CHn, NHn, and OH) and the
combina-tions of the valence and bending vibracombina-tions of such
groups (Perkampus, 1995; Workman, 2001). There
are many advantages of using NIR analyzers that include rapid, accurate, and precise measurements; nondestructive sample analyses; no sample prepara-tion needed; easy maintenance and operaprepara-tion; and ability to measure simultaneously several properties of interest. The main disadvantages of NIR are its need of a large number of samples to calibrate the instrument and its use of statistical modeling for the calibration.
NIR Spectroscopy in Cotton Fiber Analysis. NIR has been used extensively for both
quantita-tive and qualitaquantita-tive (classification or identification)
measurements in several industries (Fernández de
la Ossa et al., 2014; Moffat et al., 2010; Montoya
et al., 2013; Riccour, 2011; Sorak et al., 2012), including the textile and cotton industries (Devos et al., 2008; Rodgers and Beck, 2009; Tincher and Luk, 1985). Most of the NIR techniques reported
for measuring cotton fiber micronaire in the labora -tory concentrate on the use of bench-top, research grade NIR spectrometers (Montalvo and Von Hoven,
2004; Rodgers et al., 2010a). In prior cotton fiber
studies using NIR, Liu et al. (2015) and Rodgers et al. (2010a) concluded that the broad absorptions between approximately1150 to 1300 nm were from the second overtones of CH stretching modes, and
their first overtones appear in the approximately
1675 to 1860 nm spectral region; the absorptions between approximately1300 to 1400 nm spectral region was ascribed to combination bands of CHn
vibrations. The absorptions between approximately 1400 to 1500, 1900 to 2000, and 2050 to 2250 nm spectral regions were due primarily to OH overtone and combination bands, with the absorptions at ap-proximately 1490 and 2100 nm due primarily cotton and the absorption at approximately 1930 nm often denoted as a “moisture” peak due to the OH group. Ramey (1982) performed exploratory investigations
to estimate cotton fiber quality components, includ -ing micronaire. Thomasson and Shearer (1995)
examined the relationships between NIR reflectance and fiber quality characteristics, including micro -naire, using a bench-top, scanning NIR instrument from 1100 to 2500 nm. Montalvo et al. (1993, 1994), and Montalvo and Von Hoven (2004) examined the ability of a bench-top, scanning visible-NIR
instru-ment (400-2500 nm) to predict fiber micronaire on
cleaned cottons from successive growing seasons (2001 and 2002) in three states (Texas, Georgia, Mississippi). Liu et al. (2010) also examined cotton
fiber quality attributes, including micronaire, using
a bench-top, scanning UV-visible-NIR instrument (220-2200 nm). In addition, they examined the
UV-visible-NIR instrument’s capability to classify fibers
according to their micronaire region. Ge et al. (2010)
determined useful reflectance spectral wavebands and bandwidths for predicting several cotton fiber
quality parameters, including micronaire. Rodgers et al. (2010a) established the universal nature of the
NIR measurement of fiber micronaire, maturity, and fineness through a comparison of several bench-top,
The miniaturization and portability of spectrom-eters have opened NIR technology to new applications. Research using small, portable NIR instruments on
cotton fiber micronaire and its components (maturity and fineness) has not been extensive and has been
performed primarily in the laboratory. Rodgers et al. (2010b, c) demonstrated the potential and capabilities of portable NIR analyzers to measure micronaire us-ing a portable NIR instrument in the laboratory and
in the cotton field. In laboratory evaluation, a com -parative evaluation was used to develop and establish
the laboratory measurement of fiber micronaire with
a portable NIR instrument (high R2, low residual,
and few outliers). Vogt et al. (2011) concluded that excluding the water band from 1900 to 2000 nm during the data analysis had a minimal impact on the NIR micronaire prediction. The moisture band was
of serious concern for field/outside the laboratory measurements as fluctuations in the relative humidity and temperature in field conditions could result in dif
-ferent moisture content in the fiber and could impact
instrument performance, which could impact the water band and, thus, possibly the micronaire prediction capabilities of the portable NIR instrument. Rodgers
et al. (2010b) performed preliminary field evaluations
at three locations over two crop years or growing sea-sons. Measurements were made directly on the cotton
bolls both in the cotton field and at nonlaboratory loca
-tions near the cotton field. Distinct micronaire trend levels (high-medium-low micronaire) were identified
for 80% of the samples. In addition, the impact of dif-ferent laboratory ginning methods (saw, roller, hand ginned) on the reference micronaire measurements and portable NIR instrument micronaire measurement was shown to be minimal (Rodgers et al., 2015).
As previously described, research on cotton fiber micronaire and its components (fiber maturity and fineness) by NIR spectroscopy has been performed
primarily using bench-top NIR spectrometers, with emphasis on micronaire alone. In addition, the
cur-rent cotton fiber quality analysis process, using HVI,
AFIS, or Fibronaire, is a laboratory-only process, but measurements of micronaire and its components are desired in nonlaboratory environments and with small samples. These factors have revealed the need
for rapid and accurate in-field and outside the labora
-tory/on-site analysis for cotton fibers micronaire and its components maturity and fineness. The outside
the laboratory NIR measurements would
comple-ment, not replace or supplant, the laboratory fiber
quality measurements and process. Recently, small
and micro NIR spectrometers have been introduced. Cotton industry stakeholders from Cotton Incorpo-rated, cotton breeders, and international researchers have shown increasing interest in the measurement of
fiber micronaire, maturity, and fineness using small,
portable NIR spectroscopy instruments for both laboratory and outside the laboratory micronaire. A program was implemented to determine the ability of new portable NIR instruments to accurately measure
micronaire, fineness, and maturity in cotton lint and
seed cotton, to develop protocols and to increase the robustness of the calibration data set, and to reduce variability and improved predictability of the NIR results. All measurements were performed in the greenhouses and laboratories at the Southern Re-gional Research Center of the Agricultural Research Service of the United States Department of Agri-culture (USDA, ARS, SRRC) in New Orleans, LA.
MATERIAL AND METHODS
Cotton Samples and NIR Measurements. NIR measurements were made using two portable units, the Viavi MicroNIR 2200 and the Brimrose Luminar 5030, on seed cotton (laboratory and greenhouse) and saw-ginned cotton lint (laboratory). The vendor’s recommended operational procedures for each NIR instrument were followed. The portable Brimrose Luminar 5030 NIR (Brimrose Corp. America, Sparks, MD) uses Acousto-Optic Tunable Filter (AOTF)
tech-nology and the spectra are filtered by the interaction
between ultrasonic waves and light in an acousto-optic crystal (Brimrose, 2015). The Brimrose Luminar 5030 has a spectral range of 1100 to 2300 nm. Viavi Solutions (formerly JDS Uniphase; San Jose, CA) introduced new miniaturized spectrometers called the MicroNIR spectrometers. The MicroNIR 2200 was used in this evaluation, as it has an extended spectral range of 1150 to 2150 nm. The ultra-compact
MicroNIR spectrometers uses thin-film linear vari
-able filter (LVF) technology for the light dispersing
element, and the miniaturization of spectrometers are partly driven by microelectromechanical systems (MEMS) (O’Brien, et al., 2012). The instrument is small, with the light source, collection optics, and electronics housed in a case that is less than 2 in. in diameter and height (JSDU, 2014). The NIR results from MicroNIR 2200 were compared to the NIR results from the Brimrose Luminar 5030 instrument
(used in previous field evaluations) to determine the
measurements, a minimum of three samples/fluffs
were combined based on micronaire Cottonscope values (for example, three low Cottonscope naire bolls were combined and yielded a low micro-naire sample for Fibromicro-naire; three high Cottonscope micronaire bolls were combined and yielded a high micronaire sample for Fibronaire, and so on). After combining the samples to obtain the micronaire ref-erence values using the Fibronaire, those combined samples spectral values were averaged so that the total number of samples were 73 each for GSC, LSC, and LL (Rodgers et al., 2010c, 2015). For complete data analysis the micronaire values were obtained using
the Fibronaire, and the maturity and fineness were
obtained using the Cottonscope. The samples were split into two samples sets, a set used to calibrate the NIR instruments, and a set to validate and verify the calibration for the NIR instruments (Table I).
The prediction set of the LL, LSC, and GSC sets
were evaluated for micronaire, maturity, and fineness
using the present laboratory lint-only calibrations (140 calibration cottons). The laboratory lint-only
calibra-tion was developed previously from a well-defined
and diverse set of lint cottons from a reference set of 104 domestic and international cottons (Hequet et al., 2006) and 36 cottons covering four crop years from Texas, Georgia, and Mississippi, and AMS micronaire standards, covering a wide micronaire range (2.52-5.65 mic units). After the initial evaluation with the laboratory lint-only calibration (140 calibration cot-tons), the calibration set was expanded with the LL, LSC, and GSC calibration samples to determine if it was feasible to improve the robustness and prediction capability of the original lint-only NIR calibrations. The combined data sets (lint-only plus new accession) were evaluated with the prediction samples of the LL, LSC, and GSC sets (n = 37 each; Table 1).
outside the laboratory measurements of micronaire,
maturity, and fineness on individual cotton bolls.
A new accession (LA2010) composed of three cot-ton check varieties (FM958, DP393, and SG105) from the Cotton Incorporated Regional Breeders Testing Network (RBTN) 2010 crop grown in Alexandria, LA., were used for this evaluation (n = 222). Three environ-mental conditions–cotton-type measurement conditions were made: greenhouse seed cotton measurements (GSC, n = 222), laboratory seed cotton measurements (LSC, n = 222), and laboratory lint measurements (LL, n = 222). The seed cotton measurements were made on individual cotton bolls. In the greenhouse, seed cotton measurements were made under high temperature and high humidity (> 27 °C and 80% RH) conditions. In
the laboratory, the NIR measurements on seed cotton and saw-ginned seed cotton lint were performed in a conditioned laboratory for a minimum of 24 h (21±1
°C and 65±2%)(ASTM, 2015). The seed cotton was
ginned on a laboratory table-top 10-saw gin (Dennis Manufacturing, Athens, TX).
The Cottonscope instrument was used to obtain
the reference maturity and fineness values for indi -vidual cotton bolls/lint samples. Because the original laboratory lint-only calibrations for micronaire were based on HVI measurements, Fibronaire micronaire measurements and results were used as the reference values for micronaire (excellent micronaire method agreement between HVI and Fibronaire [Rodgers et al., 2015]). HVI measurements were not used for micronaire reference values for the new three cotton varieties accession because HVI requires a sample size of approximately 10 g; however, Fibronaire micronaire was used because Fibronaire micronaire samples require a minimum of 3.24 g, and single cot-ton boll lint weighted between 1.0 to 1.5 g each. Due to sample weight needed to perform these Fibronaire
Table 1. Calibration and validation data sets
Data set Calibration Prediction
N MIC MR FN N MIC MR FN
LA2010
Min 36 3.69 0.83 176.71 37 4.02 0.87 178.24
Max 36 5.93 1.06 246.71 37 5.87 1.07 248.04
Avg 36 4.99 0.97 209.92 37 5.02 0.97 211.07
SD 36 0.52 0.05 16.62 37 0.47 0.04 16.17
140 Samples
Min 140 2.52 0.46 136.29
Max 140 5.65 1.10 245.11
Avg 140 4.23 0.87 181.99
SD 140 0.59 0.10 21.05
Data Analysis. The micronaire, maturity, and fineness data were analyzed using SAS PROC GLM. Estimates of means and standard errors were generated through LS MEANS with calibration and
prediction as class and micronaire, maturity and fine -ness as response. Pearson correlation was performed using PROC CORR among micronaire, maturity, and
fineness at the 0.05 level of probability (version 9.4;
SAS Institute, Cary, NC).
The primary comparison parameters and sta-tistics of interest were the average of the sample sets (AVG), the residual analysis SDD (Standard
Deviation of Differences, the standard deviation of the differences between the reference method and the
NIR methods for each sample; a residual analysis),
and the bias/difference (Δ) between the reference micronaire, maturity, and fineness AVG and the NIR
determined AVG for each sample set. The lower the
SDD and Δ, the better the method agreement between the reference values and the NIR results. The target Δ
values for acceptable NIR performance are ±0.3 for
micronaire, ±0.1 for maturity and ±15 for fineness; if Δ values were outside of these property ranges, the
samples were considered outliers.
The spectral data from the MicroNIR 2200 and Luminar 5030 units were transferred to the Camo®
Unscrambler software package (version 9.8, Camo
Software AS, Woodbridge, NJ). NIR calibrations and
predictions were performed with Unscrambler, using derivative mathematics and partial least-squares cali-brations. Scatter plots of the residuals were generated in Unscrambler to verify that the assumptions of linearity and normality for residuals were met. Data were transformed and optimal spectral results were
obtained using first derivative Savitzky-Golay (SG)
with 9-points smoothing algorithms. The MicroNIR 2200 and Luminar 5030 instruments were compared to each other.
RESULTS AND DISCUSSION
Micronaire, Maturity, and Fineness Mean Dif-ferences and Correlations. The descriptive statistical values for the calibration and prediction combined data set are shown in Tables 2A and 2B. In this experiment, a
new accession of three different commercial varieties (n = 36) was added to the well-defined lint-only calibration
data set (n = 140), and then the combined calibrations was validated on the new accession prediction data set (n = 37). For this experiment, as a group, it was
preferred not to have a difference statistically between
the new accession calibration and the new accession validation (prediction) data sets to reduce the impacts of seed cotton and environmental conditions (e.g., out-side the laboratory measurements in the greenhouse) on the NIR results. Table 2A demonstrates that there
were no differences statistically between the calibration and prediction data sets for all three fiber parameters (micronaire, maturity, and fineness).
Table 2A. New accession data set mean analysis
Method N Micronairez Maturityz Finenessz
Calibration 36 4.99 a 0.97 a 209.92 a
Prediction 37 5.02 a 0.98 a 211.08 a
* p < 0.05
Table 2B. Calibration and prediction data set analysis
Method N Micronairez Maturityz Finenessz
Calibration 176 4.39 b 0.89 b 187.70 b
Prediction 37 5.02 a 0.98 a 211.08 a
z p < 0.05
The descriptive statistics for the combined cali-bration data set and new accession prediction data set were analyzed and shown in Table 2B. Because the combined calibration has a larger number of samples, which includes the lint-only calibration
set with 140 samples, it was expected to be different
statistically from the group means. For the calibra-tion set, individual samples have a wider range of
micronaire, maturity, and fineness values than the average micronaire, maturity, and fineness for the
prediction set, so there is not a concern that the
micronaire, maturity, and fineness in the prediction data set are different statistically of the calibration set.
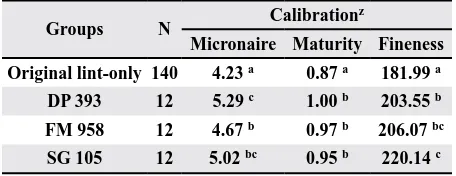
Table 3. Mean analysis for the calibration data set
Groups N Calibration
z
Micronaire Maturity Fineness
Original lint-only 140 4.23 a 0.87 a 181.99 a
DP 393 12 5.29 c 1.00 b 203.55 b
FM 958 12 4.67 b 0.97 b 206.07 bc
SG 105 12 5.02 bc 0.95 b 220.14 c
z All were statistically different at p < 0.0001
In Table 3, the results demonstrate that the aver-age property values for the new varieties are higher than the average property values for the original
lint-only samples (n = 140). The well-defined, original lint-only sample group was statistically different compared to the new fiber accession (FM958, DP393,
fineness, and it was the lowest average value on
all three variables. Thus, within the calibration and
prediction data set, average differences among the
original lint-only and the new varieties were ex-pected to improve the robustness of the calibration
data set. The well-defined lint-only sample group
exhibited the lowest average micronaire (4.23) and
was statistically different from the mean average mi -cronaires of the new varieties (FM958, DP393, and SG105). The FM958 cotton lint exhibited the lowest mean micronaire (4.67), and the DP393 cotton lint had the highest mean micronaire (5.29) for the new
fiber accessions. Further, for maturity and fineness, there were statistical differences between the original lint-only group and the new fiber accession groups.
The prediction data set showed similar statistical
differences as observed for the calibration data set. The fiber micronaire results were highly corre
-lated with the maturity and fineness results within
the calibration data set (Table 4). The variables in the prediction data set were also highly correlated, with a p value < 0.0001 in both cases. The correlations were expected, as micronaire is determined by the
fiber’s maturity and fineness. The micronaire and fineness were the highest correlated, with a correla -tion value of 0.90 for the calibra-tion data set. The
correlations between maturity and fineness were the lowest. When the fiber’s maturity is increased, the fiber becomes larger, coarser, and has a higher fine -ness size (higher mtex). However, the maturity and
fiber coarseness do not increase at the same rate or
extent, with some cottons (e.g., extra long staple)
ex-hibiting low coarseness (very fine) at high maturities.
of 140 lint samples (original lint-only laboratory calibrations) were used for validation (projection) of these three varieties under these three conditions.
The samples results under each measurement condition (LL, LSC, and GSC) for micronaire are presented in Table 5, for maturity in Table 6, and for
fineness in Table 7 (both instruments and all cotton
varieties). Across all three varieties (FM958, DP393,
SG105) and within each fiber property (micronaire,
maturity, and fineness), large differences were observed between the reference values (MIC) and
AVG, as observed for Δ, the SDD, and the number
of predicted samples (OUT %) outside of the
tar-geted property ranges for all samples (micronaire Δ > ±0.30; maturity Δ > ±0.10; fineness Δ > ±15.00).
As indicated in Table 5, both instruments
exhib-ited large differences between the reference and NIR
predicted values, as indicated for each variety by high
Δ, high SDD, and a large number of outliers for all varieties combined. The Δ results for each variety dem
-onstrated a variety effect for all three conditions and for each instrument, with FM958 being distinctly different
from DP393 and SG105. Between conditions (LL, LSC,
GSC), a definite AVG and Δ difference was observed
between the lint and seed cotton cotton-types for all three varieties for the MicroNIR 2200 unit
(cotton-type impact); the AVG and Δ difference between the
lint and seed cotton results (under the same condition) was much smaller for the Luminar 5030 unit (minimal
cotton-type impact). The rationale for the different
instrumental responses is that the two instruments
employ a different measuring surface. The MicroNIR 2200’s measuring surface is flat and wider than that
of the Luminar 5030, which is similar to a tapered cone; thus, the MicroNIR 2200 measuring surface compresses the entire sample, permitting some cotton seed to be present at the measuring surface, whereas the Luminar 5030’s cone measuring surface is smaller in contact size and able to move around the cottonseed more readily, resulting in only slight or no measurement of the seed surface. In addition, between conditions (LL,
LSC, GSC), a definite AVG and Δ difference was ob -served between the lab and greenhouse environmental conditions for all three varieties for the Luminar 5030
unit (environmental condition impact); the AVG and Δ difference between the lab and greenhouse results for
seed cotton was much smaller for the MicroNIR 2200
unit (minimal environmental condition impact). Differ -ences in hardware between the two NIR instruments result in the observed environmental condition impact
differences observed for the instruments.
Table 4. Combined calibration correlations
Groups N Mean SD Correlations
z
Mic Maturity Fineness
1. Micronaire 176 4.39 0.65 1
2. Maturity 176 0.89 0.1 0.67 1
3. Fineness 176 187.7 23.13 0.9 0.41 1
z All were statistically different at p < 0.0001
Micronaire, Maturity, and Fineness Valida-tions Using Original Lint-only CalibraValida-tions. NIR measurements were made using both the Viavi MicroNIR 2200 and the Brimrose Luminar 5030
instruments on a new cotton fiber accession of three
commercial varieties (FM958, DP393, and SG105) under three conditions: GSC, LSC, and LL under controlled conditions. Previously developed NIR
Table 5. Micronaire results on the original lint-only calibration
GROUP MIC MicroNIR 2200 Luminar 5030
AVG Δ SDD OUT(%) AVG Δ SDD OUT(%)
ALL
LL 5.29
4.82 -0.47 0.29 32 5.97 0.68 0.28 32
LSC 4.50 -0.79 0.32 32 5.83 0.53 0.47 59
GSC 4.42 -0.87 0.29 38 4.61 -0.68 0.44 57
DP393 LL
5.17
4.87 -0.30 0.26 5.84 0.67 0.26
LSC 4.41 -0.76 0.31 5.39 0.22 0.37
GSC 4.43 -0.74 0.31 4.48 -0.69 0.44
FM958 LL
5.32
4.71 -0.61 0.16 6.11 0.79 0.26
LSC 4.51 -0.81 0.14 6.21 0.89 0.32
GSC 4.24 -1.08 0.17 4.65 -0.67 0.45
SG105 LL
5.40
4.86 -0.54 0.34 5.98 0.58 0.28
LSC 4.58 -0.82 0.46 5.91 0.51 0.46
GSC 4.61 -0.79 0.27 4.72 -0.68 0.47
MIC = Micronaire; LL = Lab measured lint samples; LSC = Laboratory measured seed cotton samples; GSC = Greenhouse measured seed cotton samples
Table 6. Maturity results on the original lint-only calibration
GROUP MR MicroNIR 2200 Luminar 5030
AVG Δ SDD OUT(%) AVG Δ SDD OUT(%)
ALL
LL 0.98
0.98 0.00 0.00 14 1.17 0.19 0.13 46
LSC 0.84 -0.14 0.07 18 1.21 0.23 0.19 71
GSC 0.81 -0.17 0.11 30 1.38 0.40 0.32 81
DP393 LL
1.00
0.99 -0.01 0.05 1.11 0.11 0.10
LSC 0.85 -0.15 0.08 1.04 0.03 0.08
GSC 0.82 -0.18 0.09 1.09 0.09 0.36
FM958 LL
0.96
0.97 0.01 0.07 1.25 0.29 0.10
LSC 0.86 -0.10 0.08 1.38 0.42 0.10
GSC 0.81 -0.15 0.14 1.67 0.71 0.18
SG105 LL
0.96
0.99 0.03 0.07 1.14 0.18 0.11
LSC 0.82 -0.14 0.06 1.22 0.27 0.13
GSC 0.80 -0.16 0.09 1.38 0.42 0.38
MR = Maturity; LL = Lab measured lint samples; LSC = Laboratory measured seed cotton samples; GSC = Greenhouse measured seed cotton samples
Table 7. Fineness results on the original lint-only calibration
GROUP FN MicroNIR 2200 Luminar 5030
AVG Δ SDD OUT(%) AVG Δ SDD OUT(%)
ALL
LL
210.98
181.11 -29.87 14.22 32 271.65 60.67 14.80 32
LSC 171.74 -39.24 17.59 35 305.21 94.23 20.55 45
GSC 164.05 -46.93 22.39 51 157.04 -53.94 40.43 71
DP393 LL
206.10
178.07 -28.03 12.92 274.55 68.45 12.13
LSC 170.85 -35.35 13.39 299.45 93.36 19.44
GSC 162.80 -43.30 20.23 181.41 -24.69 38.61
FM958 LL
203.64
179.41 -24.23 11.16 266.62 62.97 14.18
LSC 169.81 -33.83 16.15 303.24 99.60 20.85
GSC 158.45 -45.19 26.18 123.88 -79.76 22.60
SG105 LL
223.81
186.14 -37.67 15.21 273.69 49.88 11.66
LSC 174.68 -49.13 19.20 313.48 89.67 20.71
GSC 171.15 -52.66 19.71 164.70 -59.11 36.80
For maturity, the results for the LL, LSC, and GSC samples, using the original lint-only calibration, are shown in Table 6 for both instruments by cotton variety and all varieties combined. As observed for
the micronaire results, large differences often were
observed for each variety between the reference MR values and predicted NIR MR values for AVG and
Δ (> ±0.1). In addition, a large number of outliers were observed for all varieties combined. However,
the differences observed for maturity were overall in
better agreement than observed for micronaire. The
MicroNIR 2200 exhibited the best overall Δ agreement with the reference values (lower AVG and Δ), and fewer outliers were observed. The Δ differences for
LL observed with the Luminar 5030 were bias-related
primarily. The Δ results by variety demonstrated a
minimal variety impact MicroNIR 2200 results, but a distinct variety impact was observed with the Luminar 5030 results, especially for FM958. As observed for the micronaire results, between conditions (LL, LSC,
GSC), a definite difference was observed between the
lint and seed cotton cotton-types for the MicroNIR
2200 unit (cotton-type impact), and a definite difference
was often observed between the lab and greenhouse environmental conditions for the Luminar 5030 unit (environmental condition impact).
For fineness, the results for the LL, LSC, and
GSC samples, using the original lint-only calibration, are shown in Table 7 for both instruments by cotton variety. As observed for the micronaire and maturity results, when using the original lint calibrations, large
differences were also observed between the reference fineness values and predicted NIR maturity values AVG and Δ (> ±15) for all samples. Based on the AVG and Δ
results, a small but distinct variety impact for the three cotton varieties was observed for both instruments, primarily for SG105. Between conditions (LL, LSC,
GSC), a distinct difference was observed between the
lint and seed cotton cotton-types and between the lab and greenhouse environmental conditions for all three varieties for both instruments, with the MicroNIR 2200 exhibiting the smallest impacts.
New Combined Calibration for Micronaire,
Maturity, and Fineness Using Three Conditions. The results above demonstrated that lint-only calibra-tions required improvements to minimize the observed cotton-type and environmental conditions impacts. The initial calibration was for laboratory measurements of commercially ginned lint only. It did not
satisfac-torily predict the fiber properties on the hand-picked
individual cotton bolls, especially for the seed cotton and outside the laboratory samples. Thus,
combin-ing a subset of these diverse samples was required to obtain more robust calibrations that were capable of measuring both laboratory and outside the laboratory cottons, both seed cotton and lint from individual bolls. Samples from the LL, LSC, and GSC data sets were added to the original lint-only calibrations to develop new combined calibrations for micronaire, maturity,
and fineness that include lint and seed cotton samples
and lab and outside the lab (greenhouse) samples (n = 176). The results for the new and improved combined
calibrations using both instruments and on LL, LSC, and GSC are shown in Table 8 for micronaire, Table 9
for maturity, and Table 10 for fineness.
The combined calibration NIR results for micro-naire (Table 8) yielded improved method agreement compared to the original lint-only calibrations (Table 5).
Significant improvements were observed in the AVG, Δ, and outlier results for all varieties. The Δ targeted limit
(±0.3 micronaire units) was achieved for all varieties, cotton-types, and environmental conditions. The best results were obtained with the MicroNIR 2200
instru-ment with lower ∆ and fewer outliers (< 30% outliers
for all samples for LL, LSC, and GSC). The combined
calibration significantly minimized and reduced the va -riety, cotton-type, and environmental condition impacts. For maturity, the combined calibration (Table 9) yielded much improved method agreement compared to the results for the lint-only maturity calibration
(Table 6), reducing significantly the difference (Δ)
between the reference maturity values and the NIR maturity results (AVG) and with < 10% outliers (Table
9). The Δ targeted limit (±0.1 maturity units) was
achieved for all varieties, cotton-types, and environ-mental conditions. The NIR results for the MicroNIR 2200 and Luminar 5030 instruments were similar for
all varieties. The combined calibration significantly
minimized and reduced the variety, cotton-type, and environmental condition impacts (Table 9).
For fineness, the combined calibration (Table
10) results yielded much improved method agree-ment compared to the lint-only calibration (Table 7),
with significantly reduced differences (Δ) between the reference fineness values and the NIR fineness
results (AVG), and with < 15% outliers for all but one
condition for all varieties. The Δ targeted limit (±15
mtex) was achieved for all varieties, cotton-types, and environmental conditions (Table 10). The best results were obtained with the MicroNIR 2200 instrument, with fewer outliers (< 15% outliers for all samples).
The combined calibration significantly minimized and
reduced the variety, cotton-type, and environmental
Table 8. Micronaire results on the combined calibration
GROUP MIC MicroNIR 2200 Luminar 5030
AVG Δ SDD OUT(%) AVG Δ SDD OUT(%)
ALL
LL 5.29
5.28 -0.01 0.22 16 5.32 0.03 0.24 19
LSC 5.31 0.02 0.29 27 5.24 -0.05 0.38 49
GSC 5.35 0.05 0.29 24 5.12 -0.17 0.47 57
DP393 LL
5.17
5.17 0.00 0.22 5.10 -0.07 0.23
LSC 5.19 0.02 0.28 5.06 -0.11 0.38
GSC 5.36 0.19 0.27 4.93 -0.24 0.41
FM958 LL
5.32
5.29 -0.03 0.14 5.40 0.08 0.20
LSC 5.27 -0.05 0.15 5.34 0.02 0.31
GSC 5.22 -0.10 0.17 5.21 -0.11 0.51
SG105 LL
5.40
5.39 -0.01 0.29 5.47 0.07 0.27
LSC 5.48 0.07 0.40 5.34 -0.06 0.46
GSC 5.45 0.05 0.34 5.24 -0.16 0.53
MIC = Micronaire; LL= Lab measured lint samples; LSC = Laboratory measured seed cotton samples; GSC = Greenhouse measured seed cotton samples
Table 9. Maturity results on the new combined calibration
GROUP MR MicroNIR 2200 Luminar 5030
AVG Δ SDD OUT(%) AVG Δ SDD OUT(%)
ALL
LL 0.98
0.98 0.00 0.04 3 0.97 -0.01 0.05 3
LSC 0.98 0.00 0.04 3 0.97 -0.01 0.05 5
GSC 1.00 0.02 0.04 8 0.96 -0.02 0.06 5
DP393 LL
1.00
0.99 -0.01 0.03 0.96 -0.04 0.03
LSC 0.99 -0.01 0.04 1.00 -0.01 0.05
GSC 1.02 0.02 0.04 0.98 -0.02 0.06
FM958 LL
0.96
0.97 0.01 0.05 0.99 0.03 0.05
LSC 0.98 0.02 0.04 0.96 0.01 0.06
GSC 1.00 0.04 0.05 0.95 -0.01 0.05
SG105 LL
0.96
0.98 0.02 0.03 0.96 0.01 0.04
LSC 0.96 0.00 0.03 0.95 -0.01 0.06
GSC 0.97 0.01 0.05 0.96 0.01 0.07
MR = Maturity; LL = Lab measured lint samples; LSC = Laboratory measured seed cotton samples; GSC = Greenhouse measured seed cotton samples
Table 10. Fineness results on the new combined calibration
GROUP FN MicroNIR 2200 Luminar 5030
AVG Δ SDD OUT(%) AVG Δ SDD OUT(%)
ALL
LL
210.98
210.60 -0.38 8.57 5 210.68 -0.30 7.65 3
LSC 210.30 -0.68 9.13 8 210.32 -0.66 11.15 11
GSC 211.55 0.57 9.35 11 207.94 -3.04 15.12 35
DP393 LL
206.10
206.13 0.03 6.66 205.06 -1.04 5.43
LSC 207.43 1.33 7.92 206.41 0.31 10.13
GSC 212.29 6.19 6.74 204.87 -1.23 13.24
FM958 LL
203.64
210.38 6.74 4.99 210.42 6.78 5.51
LSC 206.78 3.14 6.37 205.63 1.99 9.71
GSC 203.69 0.05 9.97 200.36 -3.28 16.45
SG105 LL
223.81
215.66 -8.15 6.86 217.04 -6.77 5.44
LSC 216.94 -6.87 10.09 219.25 -4.56 13.26
GSC 218.62 -5.19 7.95 218.83 -4.98 16.67
It is interesting to note that the NIR results for
maturity have lower ∆, SDD, and far fewer outliers
compared to the NIR results for micronaire and
fineness. Micronaire is a combination of the fiber’s maturity and fineness. For maturity, the NIR is mea
-suring the cellulose content in the fiber, a chemical property; for fineness, the NIR is measuring the scattering and surface reflectance from the fiber, a
physical property. NIR responds well to chemical
property differences, but differences between pure
physical properties can be challenging to determine (Burns, 1985). Thus, the variability in the NIR results
for fineness can be a major contributor impacting
the micronaire results, resulting in the observed variability observed for micronaire.
SUMMARY
Comparative evaluations were performed to de-terminate the potential of portable NIR instruments
to accurately measure micronaire, maturity, and fine -ness simultaneously on seed cotton (greenhouse and laboratory measurements on individual cotton bolls) and on ginned lint from the seed cotton (laboratory measurements) using the portable Viavi MicroNIR 2200 and the Brimrose Luminar 5030 NIR instru-ments. The simultaneous NIR measurements on the
fiber of three cotton varieties under three distinct
measurement variables (measurement location, environmental conditions, type cotton) were fast (< 1 min. per sample), easy to perform, accurate, and
required minimal sample preparation.
For the original lint-only calibration developed
from a well-defined and diverse sample set, NIR re -sults on the seed cotton and ginned lint samples often
exhibited variety effects for both instruments. For mi -cronaire and maturity, the MicroNIR 2200 exhibited a cotton-type impact (lint vs. seed cotton), and the Luminar 5030 exhibited an environmental condition impact (lab vs. greenhouse measurements). Samples of lint and seed cotton were added to the original lint-only sample set to develop new NIR calibrations
for micronaire, maturity, and fineness. Distinct and significant improvements in method agreement (Δ) were obtained, and the significant reduction of number
outliers of all samples using the optimized combined calibration data sets was encouraging. These positive
results establish that including samples from different environments (laboratory and greenhouse) and fiber
type conditions (lint and seed cotton) into ginned lint cotton-only calibration data sets results in stronger,
more robust, and improved calibrations for micronaire,
maturity, and fineness. In addition, the impact of vari -ety on the NIR results was minimized. The accuracy of the prediction was improved with both instruments. The two portable NIR instruments, the MicroNIR 2200 and the Luminar 5030, yielded similar results, with the MicroNIR 2200 yielding superior results for
micronaire and fineness. Due to the similarities in
the NIR results with the combined calibrations, both
instruments were shown to satisfactorily measure fiber micronaire, maturity, and fineness both inside and
outside the laboratory for both ginned and seed cotton.
ACKNOWLEDGMENTS
The authors wish to thank Mrs. Jeannine Mo-raitis for her outstanding work in running all samples.
DISCLAIMER
The use of a company or product name is solely
for the purpose of providing specific information
and does not imply approval or recommendation by the United States Department of Agriculture to the exclusion of others.
REFERENCES
American Society of Testing Materials [ASTM]. 2015. Standard Practice for Conditioning and Testing Textiles, ASTM D1776/D1776M-15. Book of ASTM Standards, ASTM International, West Conshohocken, PA.
Brimrose. 2015. Luminar 5030 miniature hand-held AOTF-NIR analyzer [Online]. Available at http://www.brimrose. com/products/nir_mir_spectrometers/sort_by_spectrom-eters/5030.html(verified 19 Sept. 2017).
Burns, D. 1985. Modern near infrared reflectance analysis. p. 7–21. ACS Short Course. 23-24 Feb. 1985. New Orleans, LA.
Devos, O., A. Durand, and J. Huvenne. 2008. Quantita-tive analysis of cotton-viscose textile products from 12-points near infrared spectra. NIR News. 19(3):10–12.
Fernández de la Ossa, M. C., García-Ruiza, and J. Manuel Amigo. 2014. Near promising future of near infrared hyperspectral imaging in forensic sciences. NIR News. 25(4):6–9.
Gordon, S.G., and G.R.S. Naylor. 2012. Cottonscope: a new instrument for maturity and fineness measure-ments: instrument design. CSIRO Materials Science and Engineering, Geelong Laboratory, Belmont, Vic 3216, Australia. [Online]. Available at https://publications.csiro.
au/rpr/download?pid=csiro:EP118064&dsid=DS2 (veri-fied 19 Sept. 2017).
Hequet, E., B. Wyatt, N. Abidi, and D.P. Thibodeaux. 2006. Creation of a set of reference material for cotton fiber maturity measurements. Textile Res. J. 76(7):576–586.
Indest, M.O. 2015. Factors affecting within-plant variation of cotton fiber quality and yield. Ph.D. diss. Louisiana State Univ., Baton Rouge, LA.
JDSU. 2014. MicroNIRTM Pro Spectrometer. [Online].
Available at www.camo.com/downloads/partners/jdsu/ micronirpro-ds-co-ae.pdf (verified 19 Sept. 2017).
Liu, Y., B. Campbell, C. Delhom, and V. Martin. 2015. Variation and relationship of quality and near infrared spectral characteristics of cotton fibers collected from multi-location field performance trials. Textile Res. J. 85(14):1474–1485.
Liu, Y., G. Gamble, and D. Thibodeaux. 2010. UV/visible/ near-infrared reflectance models for the rapid and non-destructive prediction and classification of cotton color and physical indices. Trans. ASABE. 53(4):1341–1348.
Moffat, A.C., S. Assi, and R.A.J. Watt. 2010. Identifying counterfeit medicines using near-infrared spectroscopy. J. Near Infrared Spectrosc. 18:1–15.
Montalvo, J., and T. Von Hoven. 2004. Analysis of cotton. p. 671–728. In C. Roberts et al. (ed.) Near-Infrared Spec-troscopy in Agriculture. Agronomy Monograph No. 44. American Society of Agronomy, Madison, WI.
Montalvo, J., S. Buco, and H. Ramey. 1994. Studies to measure cotton fiber length, strength, micronaire, and color by vis/nir reflectance spectroscopy. Part I: Principal components regression. J. Near Infrared Spectrosc. 2:185–198.
Montalvo, J., S. Faught, H. Ramey, and S. Buco. 1993. Stud-ies to measure cotton fiber length, strength, micronaire, and color by vis/nir reflectance spectroscopy. Part I: Descriptive statistics of fiber properties and reflectance spectra. J. Near Infrared Spectrosc. 1:153–173.
Montoya, M., J. Laxalde, M. Veleva, J. Rosas, and F. Soulas. 2013. Control of raw materials with near infrared spec-troscopy: a qualitative approach. NIR News. 24(6):4–6.
O’Brien, N., C.A. Hulse, D.M. Friedrich, F.J. Van Milligen, M.K. von Gunten, F. Pfeifer, and H.W. Siesler. 2012. Miniature near-infrared (NIR) spectrometer engine for handheld applications. p. 1–8. In M.A. Druy and R.A. Crocombe (ed.) Next-Generation Spectroscopic Tech-nologies V. Proc. SPIE. Vol. 8374, 837404.
Paudel, D.R., E.F. Hequet, and N. Abidi. 2013. Evaluation of cotton fiber maturity measurements. J. Ind. Crops Prod. 45:435–441.
Perkampus, H. -H. 1995. NIR spectroscopy. p. 387–388. In
Encyclopedia of Spectroscopy. VCH, New York, NY.
Ramey, H. 1982. Estimating quality components of natu-ral fibers by near–infrared reflectance. Textile Res. J. 52(1):20–25.
Riccour, T. 2011. Fast analysis of different kinds of soil by near infrared spectrometry to determine quantitative parameters. NIR News. 22(2):13–20.
Rodgers, J., and K. Beck. 2009. NIR characterization and measurement of the cotton content of dyed blend fabrics. Textile Res. J. 79(8):675–686.
Rodgers, J., and C. Delhom. 2015. Simultaneous measure-ments of cotton fiber maturity, fineness, ribbon width, and micronaire. p. 733–741. In Proc. AATCC. 24-26 Mar. 2015. Savannah, GA.
Rodgers, J., C. Delhom, C. Fortier, and D. Thibodeaux. 2012. Rapid measurement of cotton fiber maturity and fineness by image analysis microscopy using the Cottonscope. Textile Res. J. 82(3):259–271.
Rodgers, J., C. Delhom, D. Hinchliffe, H.J. Kim, and X. Cui. 2013. A rapid measurement for cotton breeders of maturity and fineness from developing and mature fibers. Textile Res. J. 83(14):1439–1451.
Rodgers, J., C. Fortier, C. Delhom, and X. Cui. 2015. Labora-tory ginning and blending impacts on cotton fiber micro-naire measurements. AATCC J. Res. 2(4):1–7.
Rodgers, J., S. Kang, C. Fortier, J. Montalvo, X. Cui, and V. Martin. 2010b. Near infrared measurement of cotton fiber micronaire by portable near infrared instrumenta-tion. Textile Res. J. 80(15):1503–1515.
Rodgers, J., S. Kang, C. Fortier, X. Cui, G. Davidonis, E. Clawson, D. Boquet, and W. Pettigrew. 2010c. Prelimi-nary field measurement of cotton fiber micronaire by portable NIR. Spectroscopy. 25(9):38–44.
Rodgers, J., J. Montalvo, G. Davidonis, T. Von Hoven. 2010a. Near infrared measurement of cotton fiber micronaire, maturity, and fineness—A comparative investigation. Textile Res. 80(9):780–793.
Sorak, D., L. Herberholz , S. Iwascek , S. Altinpinar, F. Pfeif-er, and H. Siesler. 2012. New developments and applica-tions of handheld Raman, mid-infrared, and near-infrared spectrometers. Appl. Spectrosc. Rev. 47(2):83–115.
Tincher, W., and A. Luk. 1985. NIRS analysis of cotton/poly-ester yarns. Textile Chemist and Colorist. 17(10):25–29.
United States Department of Agriculture, Agricultural Mar-keting Service [USDA AMS]. 2005. Cotton classification, understanding the data. [Online]. Available at http:// www.ams.usda.gov/sites/default/files/media/Cotton%20 DB%20Understanding%20the%20Data.pdf (verified 19 Sept. 2017).
Vogt, F., R. Luttrell, and J. Rodgers. 2011. New approaches for field analyses of cotton quality by means of near-IR spectroscopy supported by chemometric. Analytical Let-ters. 44:2466–2477.
Wakelyn, P., N. Bertoniere, A. French, D. Thibodeaux, B. Triplett, M. Rousselle, W. Goynes, J. Edwards, L. Hunter, D. McAlister, and G. Gamble. 2007. Physical properties of cotton. p. 107–114. In M. Lewin (ed.) Cotton Fiber Chemistry and Technology. CRC Press, Boca Raton, FL.
Workman, J. 2001. NIR Spectroscopy calibration basics. p. 123–150. In D. Burns and E. Ciurczak (ed.) Handbook of