University of New Orleans University of New Orleans
ScholarWorks@UNO
ScholarWorks@UNO
University of New Orleans Theses and
Dissertations Dissertations and Theses
5-20-2005
Utility Stock Splits: Signaling Motive Versus Liquidity Motive
Utility Stock Splits: Signaling Motive Versus Liquidity Motive
Maria Mercedes Miranda University of New Orleans
Follow this and additional works at: https://scholarworks.uno.edu/td
Recommended Citation Recommended Citation
Miranda, Maria Mercedes, "Utility Stock Splits: Signaling Motive Versus Liquidity Motive" (2005). University of New Orleans Theses and Dissertations. 269.
https://scholarworks.uno.edu/td/269
This Dissertation is protected by copyright and/or related rights. It has been brought to you by ScholarWorks@UNO with permission from the rights-holder(s). You are free to use this Dissertation in any way that is permitted by the copyright and related rights legislation that applies to your use. For other uses you need to obtain permission from the rights-holder(s) directly, unless additional rights are indicated by a Creative Commons license in the record and/ or on the work itself.
UTILITY STOCK SPLITS: SIGNALING MOTIVE VERSUS LIQUIDITY
MOTIVE
A Dissertation
Submitted to the Graduate Faculty of the University of New Orleans
in partial fulfillment of the requirements for the degree of
Doctor of Philosophy in
The Financial Economics Program
by
Mercedes Miranda
To my son Gustavo
who shared with me long nights of study while pursuing the Ph.D.
ACKNOWLEDGMENT
My special appreciation goes to my dissertation advisor, Dr. Tarun Mukherjee for his advise, guidance and insightful comments through this research. I sincerely thank the members of my dissertation committee, Drs. Janet Speyrer, Oscar Varela, Philip Wei, and Gerald Whitney for their invaluable time and helpful suggestions that improved this dissertation.
I owe special thanks to my parents who have taught me the value of education and supported me through all these years of study. I could not have finished the Ph.D.
TABLE OF CONTENTS
LIST OF TABLES ...v
LIST OF FIGURES ...vi
ABSTRACT……...vii
CHAPTER 1: INTRODUCTION ...1
CHAPTER 2: LITERATURE REVIEW ...6
2.1. Theories of stock splits ...6
2.2. Utility industry...19
CHAPTER 3: HYPOTHESES...24
CHAPTER 4: METHODOLOGY …….. ...28
4.1. The market reaction to public utility stock splits ...28
4.2. Signaling measures ...29
4.3. Liquidity measures ...30
4.4. Regression analysis ...31
CHAPTER 5: DATA DESCRIPTION …….. ...34
5.1. Data ...34
5.2. Sample summary...35
CHAPTER 6: RESULTS ……… ...42
6.1. The market reaction to public utility versus industrial stock splits ....42
6.2. Impact of EPACT on announcement returns ...43
6.3. Tests of the signaling versus liquidity/marketability hypothesis ...47
6.4. Multivariate analysis and robustness check ...67
CHAPTER 7: CONCLUSION ……. ...75
REFERENCES…. ...78
APPENDIX: Theories of Regulation ……. ...84
LIST OF TABLES
Table I: Sample Selection Criteria ...36
Table II: Annual Distribution of Electric Utility Stock Splits ...37
Table III: Delisting of Utility Companies, 1986-2002...38
Table IV: Distribution of Electric Utility Splits by Split Factor, 1986-2002 ...39
Table V: Descriptive Statistics………...41
Table VI:Announcement Return of Electric Utility versus Industrial Stock Splits ...44
Table VII:Summary of Major Provisions after the Enactment of EPACT ...46
Table VIII:Split Factors and AbnormalReturns ...49
Table IX: Analysis of Operating Performance for Electric Utility Split Sample ...52
Table X: Electric Utility Prices, 1986-2002 ...56
Table XI: Electric Utility Prices by Time Period...57
Table XII: Percentage Changes in the Number of Shareholders ...63
Table XIII:Changes in Trading Patterns around Utility Splits… . ...66
Table XIV:Regression Results…...68
Table XV: Beta Estimates Preceding and Following Utility Stock Splits ...72
LIST OF FIGURES
Figure I: Histogram of Prices before Utility Stock Splits, 1986-1992……….. 58
Figure II: Histogram of Prices after Utility Stock Splits, 1986-1992…. ...59
Figure III: Histogram of Prices before Utility Stock Splits, 1993-2002...60
ABSTRACT
Despite the rich literature on theories of stock splits, studies have omitted public utility firms from their analysis and only analyzed split by industrial firms when
examining mana gerial motives for splitting their stock. I examine the liquidity-marketability hypothesis, which states that stock splits enhance the attractiveness of shares to individual investors and increase trading volume by adjusting prices to an optimum trading range. Changes in the regulatory process, resulting from EPACT, have opened a window of opportunity for the study and comparison of the two traditional motives for splitting stock --signaling versus liquidity- marketability motives. Public electric utility firms provide a clean testing ground for these two non-mutually exclusive theories as liquidity/marketability hypothesis should dominate before the enactment of the EPACT since the conventional signaling theory of common stock splits should not apply given the low levels of information asymmetry in regulated utility companies. In the post-EPACT period, however, the signaling effect is expected to play a more dominant role. Based on both univariate and multivariate analyses, my results are
consistent with the hypothesis posed. For the pre-EPACT period, liquidity motive seems to predominate in explaining the abnormal announcement return of utility stock splits. On the other hand, the results support the signaling motive as a leading explanation of
CHAPTER 1
INTRODUCTION
In a stock split a certain number of new shares are substituted for each outstanding share.
The only changes are par value and number of shares outstanding adjusted by the split factor.
All other capital accounts remain unchanged. However, previous research documents that
investors react positively to the announcements of stock splits suggesting that there are benefits
associated with splitting stocks.1 Grinblatt, Masulis and Titman (1984), for example, report a
significant announcement period abnormal return of approximately 3 percent for splitting firms.
McNichols and Dravid (1990) conclude that stock splits reveal information about future dividend
and earning changes. In addition, Ikenberry, Rankine and Stice (1996) and Desai and Jain (1997)
find that splitting firms experience significant long-run excess returns as well.
Two major theories have emerged in the financial literature to explain the positive
abnormal returns at the announcements of stock splits; the signaling theory and the trading range
theory. The signaling theory posits that firms split their shares to reveal favorable future
information. Asquith, Healey, and Palepu (1989) argue that managers announce stock splits to
reveal future earning information. Brennan and Hughes (1991) and Schultz (1999) suggest that
since stock splits reduce share price resulting in higher commission fee per share, they draw
greater attention from security analysts. Because the primary role of the analysts is to generate
information, more firm- specific information is revealed subsequent to the split announcements.
In addition, Desai and Jain (1997) find that the majority of firms splitting stocks increase their
1
cash dividends subsequent to the announcements. They conclude that stock splits convey
information about near-term cash dividend growth.
On the other hand, the trading range theory advocates that splits realign per-share prices
to a preferred price range. This preferred price range is mainly justified on the basis that it
improves liquidity and marketability. This theory is also supported by managers surveyed by
Baker and Gallagher (1980) and Baker and Powell (1993). Managers believe that, by lowering
share prices, firms make their stocks more affordable to smaller investors and hence broaden the
stockholders’ base. Lakonishok and Lev (1987) find that splitting firms experience stock price
run- ups prior to the announcements and the share price after splits are comparable to the average
share price of other firms in the industry. A lower share price also improves trading liquidity by
increasing numbers of shares traded and converting odd- lot holders to round- lot holders.
D’Mello, Tawatnuntachai, and Yaman (2003) find that firms split stock to make the subsequent
SEO more marketable to individual investors who are attracted to low-priced shares. The trading
range hypothesis and liquidity/marketability hypothesis are not mutually exclusive explanations.
Individuals may have a preference for a specific trading range because liquidity is higher at that
price range.
Despite the rich literature on the theories of stock splits, studies have omitted public
utility firms from their analysis and only analyzed split by industrial firms when examining
managerial motives for splitting their stock. However, several studies in the financial literature
address the differences between public utility industry and other industries when examining
market reaction to announcement of other corporate events.2 Asquith and Mullins (1986) and
Masulis and Korwar (1986) study the share price response associated with the issuance of new
that industrial firms experience larger negative excess returns than utility firms. Both studies
suggest that the information asymmetry is much lower for utility firms than industrial firms since
the former are subject to regulation. Szewczyc (1992) concludes that regulation of public
utilities may affect the market’s response to announcement of security offerings.
Public electric utility industry has been deregulated starting with the enactment of the
Energy Policy Act (EPACT) of 1992. Changes in the regulatory process, resulting from EPACT,
have opened a window of opportunity for the study and comparison of the two traditional
motives for splitting stock --signaling versus liquidity- marketability motives. Public electric
utility firms provide a clean testing ground for these two non- mutually exclusive theories as
liquidity/marketability hypothesis should dominate before the enactment of the EPACT since the
conventional signaling theory of common stock splits should not apply given the low levels of
information asymmetry in regulated utility companies.3 In the post-EPACT period, however, the
signaling effect is expected to play a more dominant role. In other words, the liquidity and
marketability motives should play a more important role in the pre-EPACT era, while signaling
motive should dominate in the post- EPACT era due to the increase of information asymmetry.
Two major hypotheses that I propose to test in this dissertation are as follows. First, in the
pre-EPACT period, the announcement effect of stock splits would be lower than similar
announcements by industrial firms; while in the post-EPACT period, the announcement effect
related to stock splits between the two groups would be similar. Second, in the pre-EPACT era,
the liquidity- marketability motive dominates behind stock splits by electric utilities as opposed to
post-EPACT era when signaling motive is expected to dominate.
3
My sample consists of 158 electric and gas utilities with stock splits during 1986- 2002
period. The results show that the stock price reaction to announcement of public utility splits is
significantly positive but lower than the excess returns found for industrial stock splits during the
1986 through 2002 period. When the sample is broken down into pre- EPACT period
(1986-1992) and post- EPACT period (1993-2002), I find that the market reaction is always greater for
industrial stock splits than public utility splits regardless of the time period. This is consistent
with the idea that regulation of public utilities may affect the market’s response to announcement
of corporate events and also the findings of previous studies in the context of other corporate
events.
I test the signaling hypothesis by examining the announcement period return, the relation
between split factors and abnormal returns, and the changes in operating performance of the
splitting firms. Finding significant abnormal excess stock returns, a positive relation between
split factors and abnormal return, and abnormal increase in earnings around the split are
consistent with signaling explanations. The marketability and liquidity argument is tested by
examining the changes in prices before and after the split, the number of shareholders, and
trading volume.
Based on both univariate and multivariate analyses, my results are consistent with the
hypothesis posed. For the pre-EPACT period, liquidity motive seems to predominate in
explaining the abnormal announcement return of utility stock splits. On the other hand, signaling
motive dominates as a leading explanation of abnormal returns in the post- EPACT period.
The rest of this dissertation is organized as follows: Chapter 2 reviews previous literature
related to both stock split announcements and the regulated utility industry; Chapter 3 explains
Chapter 4 describes the methodology used to test the hypotheses; Chapter 5 provides data
description; Chapter 6 analyzes the results and Chapter 7 summarizes and concludes the
CHAPTER 2
LITERATURE REVIEW
This Chapter is divided into two sections. In section 2.1, I present the theories that
explain the positive effect of stock split announcements and the literature supporting these
theories. In section 2.2, I give an overview of the utility industry, which includes the EPACT
and its impact on information asymmetry and empirical evidence on utility companies.
2.1. Theories of stock splits
Stock splits represent a puzzling phenomenon. After a split, the number of shares
outstanding increases but the corporation’s cash flows is unaffected. Each shareholder retains
his/her proportional ownership of shares, and the claims of other classes of security holders are
unaltered, yet the market reacts positively to stock splits announcements. Two theories, the
signaling theory and the trading range theory have emerged in the finance literature as the
leading explanations for splitting stock.
2.1.1. Signaling theory
According to the signaling theory, firms split stocks to convey favorable private
information about their current value. Finding positive excess returns around split
announcements would be consistent with this hypothesis.
Fama, Fisher, Jensen, and Roll (1969) study firms that announce stock splits during the
period of 1927 through 1959. They find that splitting firms experience an increase in cash
higher cash dividend in the year subsequent to the announcement than the average security listed
on the New York Security Exchange. Their study supports the idea that stock splits reveal
information about an imminent increase in cash dividends. Fama et al. (1969) also find
abnormal returns around the split month, suggesting that the market considers stock split good
news because the announcements resolve uncertainty of cash dividend increase.
Grinblatt, Masulis, and Titman (1984) argue that previous studies (Fama et al., 1969;
Bar-Yosef and Brown, 1977) may not accurately reflect the effects of stock splits announcements
since they use monthly instead of daily data. Also, both Fama et al. (1969) and Bar-Yosef and
Brown (1977) do not control for potential effects of other information such as merger, earnings,
and dividend release around stock split announcements. To correct for these problems, Grinblatt
et al. (1984) examine a special subsample of splits for which no other announcement were made
on split declaration date (obtained from CRSP) and two days after the declaration date. They
find consistent results with the previous literature (Fama et al., 1969; Bar-Yosef and
Brown,1977) that splitting firms experience abnormal returns during the announcement period.
Specifically, they find an average increase in shareholders wealth of about 3.9% in the two days
around the split announcement. This significant positive announcement effect leads them to
hypothesize that firms signal information about their future earnings or equity values through
their split decision. Contrary to Fama et al. (1969), Grinblatt et al. (1984) find that
announcement returns cannot be explained by forecast of near term cash dividend increases.
Two-day announcement period returns are not significantly related to subsequent cash dividend
change, but are positively related to split factor, and negatively related to firm size and returns
because of their higher levels of information asymmetry, smaller firms’ stock split
announcements contain greater information.
Asquith, Healy, and Palepu (1989) study a sample of 121 firms that announced stock
splits during 1970 through 1980 that never paid cash dividend before the split announcement
date. Similar to Grinblatt et al. (1984), they report that the majority of their sample (81 percent)
do not pay cash dividends during a five-year period after stock splits and only 9 percent of their
total sample initiates cash dividends within a year after the announcement. Nevertheless, the
same sample of firms experience unusual earnings growth for several years prior to split
announcements and the increase in earnings continues for at least four years subsequent to the
announcement. Therefore, Asquith et al. (1989) conclude tha t stock split announcements reveal
information about future earnings, rather than future cash flows.
Brennan and Copeland (1988) expand the study of stock-split behavior with a model in
which the split serves as a signal of managers’ private information because stock trading costs
depend on stock prices. They use Ross’s (1977) argument that for a signal to be valid, it must be
costly to mimic. Brennan and Copeland (1988) signaling theory rests on the assumption that
stock splits are costly because the fixed cost element of brokerage commission increases the
per-share trading costs of low-priced stocks. In addition, investors who previously owned round lots
will pay higher fees for odd lots after split announcements. Therefore, managers will trade off
the benefits derived from an increase in the firm’s share price with an increase in transaction
costs. Managers who observe the true value of the firm’s cash flow choose a target price, which
is defined as the preannouncement share price divided by the split factor. The empirical
evidence supports the prediction of their model that trading costs increase subsequent to the
to the number of shares outstanding following stock splits, suggesting that the number of shares
that will result after the split supply a useful signal to investors about managers’ private
information.
Following the same line of research, Brennan and Hughes (1991) develop a new model in
which they predict that the flow of information about firms is an increasing function of firm size
and a decreasing function of share price. Under the typical structure of brokerage fees based on
number of shares traded, security analysts tend to do more research on firms with low share
prices as they are likely to fetch higher commissions per share. Thus, by splitting their stock and
reducing share price, firms can draw more attention from investment brokers. Only those
managers with private good information have the incentive to call the attention of security
analysts so that they forecast earnings to investors. One of the assumptions of the model is that
investors will only purchase those stocks they know about. Thus, the role of security analysis is
assumed by brokers who receive compensation for their efforts in the form of brokerage
commissions from the investors who trade in the particular stocks. By examining a sample of
stock splits during 1976 through 1977, Brennan and Hughes (1991) find evidence supporting
their model; the number of analysts following firms is positively related to firm size and
negatively related to stock price.
Other studies such as McNichols and Dravid (1990) provide further evidence on the
signaling hypothesis by testing whether stock dividends and split factors convey information
about future earnings, and by testing whether the split factor itself is the signal. McNichols and
Dravid (1990) follow Spence’s (1973) and Riley’s (1979) signaling notion in which three
relations must hold in a fully revealing signaling equilibrium. In the first relation, the level of
(1990) test whether the split factor reflects management’s priva te information about future
earnings. Management’s private information about earnings is proxied by analyst’s earnings
forecast error. This error is measured as the percent difference annual earnings reported after the
split and the median analysts’ pre-split earnings forecast. The second relation that must hold is
that agents’ inferences about the unobservable attribute correspond to the level of the signal.
They test this relation that investors inferences correspond to the split factor signal by testing for
a positive correlation between announcement period return prediction errors and an estimate of
the split factor signal. The third relation that must hold in the signaling equilibrium of
McNichols and Dravid (1990) is that inferences about the leve l of the unobserved attribute
correspond to the level of the unobserved attribute. Therefore, they test if there is a relation
between revision of investors’ beliefs about the value of the firm and the firm’s future earnings.
Looking at a sample compromised of stock dividends and splits occurring from 1976-1983, they
find evidence supporting the signaling hypothesis. Their results show that split factors are
significantly correlated with earnings forecast errors, suggesting that firms incorporate their
private information about future earnings in choosing their split factor. They also note that there
is a positive relationship between abnormal announcement returns and split factors, suggesting
that investors use split factors as a signal of future performance. The last test divides the split
factor signal into a component that is correlated with earnings forecast errors and an uncorrelated
component. McNichols and Dravid (1990) find that the announcement earning returns are
significantly correlated with split factors. Thus, they also find a significant coefficient on the
uncorrelated split factor, which suggests that other attributes are also signaled through split factor
choice. They conclude that earnings forecast errors measure management’s private information
A study by Han and Suk (1998) links the level of inside ownership of a firm with the
abnormal returns at the announcement of stock splits. They observe whether investors consider
the level of insider ownership of a firm as useful information for evaluating stock splits. If stock
splits signal management’s inside information, the credibility of the signal will vary depending
on different levels of managerial ownership. They first hypothesize a positive relation between
the level of insider ownership and the announcement effect of stock splits. However, the level
of information asymmetry influences the extent to which investors find the knowledge of inside
ownership useful. Under the absence of information asymmetry, investors and managers have
the identical information set about firm’s prospects. Therefore, knowledge of insider ownership
is of little value to investors. Using firm size as a proxy for the level of information asymmetry,
they also hypothesize that the valuation effect of insider ownership should increase as firm size
decreases. While their first hypothesis predicts a positive relation between announcement effects
and the level of insider ownership, hypothesis 2 predicts that such a positive relation should be
more prominent for firms with higher information asymmetry. Using a sample of 262 splits
announced by NYSE and AMEX firms from 1983 to 1990 they find that split announcements by
firms with higher insider ownership have a more positive effect on the market than those by
firms with lower insider ownership. The average two-day abnormal return around the split
announcement is 4.2 percent for those firms with the highest insider ownership, compared with
0.9 percent for the portfolio with the lowest insider ownership. With respect to the joint effect of
insider ownership and information asymmetry, they find a significant positive relation between
announcement returns and insider ownership for small firms. This positive relation is not
observed within large firms. The results suggest that the market evaluates stock split decisions
Szewczyk and Tsetsekos (1993) study the relationship between the level of institutional
ownership and the magnitude of the share price response to new equity issues by industrial firms.
They argue that institutional owners possess more information about the firm than individual
investors. As a result, announcements by firms with larger concentration of institutional
ownership should contain less information to the market, diminishing the market’s reaction to a
new stock issue. Results from industrial firms indicate that there is a direct relationship between
the level of institutional ownership and the market response to new equity issue. However,
Fielbeck and Hatfield (1999) find that there is a lack of relationship between the level of
institutional ownership and the magnitude of the share price response to the announcement of
new equity issue by public utility firms. They conclude that the regulatory nature of public
utilities reduces the role played by institutional investors in the reduction of information
asymmetry.
2.1.2. Trading range theory
A different explanation for the positive abnormal returns of stock splits is the trading
range theory. The trading range theory advocates that splits realign per-share prices to a
preferred price range. This preferred price range is mainly justified on the basis that it improves
marketability and liquidity. According to Ikenberry, Rankine, and Stice (1996) trading ranges
might also arise for other reasons, including a desire by managers to increase ownership by
individual investors (Lakonishok and Lev, 1987) and a desire by firms to control relative tick
size at which their shares trade (Anshuman and Kalay, 1994; Angel, 1997; Shultz, 2000). Under
pre-split price run-up. Therefore, this hypothesis links pre-splits more to past performance than to future
performance.
Lakonishok and Lev (1987) suggest that there is an ideal range in which companies
prefer their stocks to be traded. The range is chosen to be comparable to the average stock price
in the industry. Since splitting firms experience unusual growth in earnings and dividends, their
stock prices increase beyond the customary trading range. Therefore, managers decide to split
their firms’ shares to restore stock prices to the range and thus increase trading liquidity.
Lakonishok and Lev (1987) compare the operational performance and other characteristics of
firms that split their stocks with those of a control group of nonspliting firms. Their results show
that, relative to control firms with the same four-digit SIC code and asset size, stock splits are
performed by firms that have enjoyed an unusual increase in stock prices over the five-year
period prior to the announcement. The main reason for the split appears to be the return of the
stock price to a normal range following a high growth period. In so doing, the firm affords small
investors the opportunity to purchase stocks at lower price in round lots. They also find that 32
percent of split factors are explained by pre-announcement stock price relative to the market and
the industry average prices. In terms of volume of trade or marketability, they look at the
monthly number of shares traded relative to the number of shares outstanding at the same date
for a given stock. Findings suggest that stock splits do not permanently affect the volume of
trade. Composition of stockholders and the number of stockholders are also other aspects of
marketability that might be affected by stock splits.
Mann and Moore (1996) develop a simple model supporting the trading range hypothesis.
They base their model on the assumption that firms split stocks to minimize total dollar trading
model. They analyze NYSE and AMEX stock splits during the period 1967 to 1989. Mann and
Moore (1996) results show that firms with high institutional ownership experience greater
pre-split increases in share prices relative to those with high individual ownership. Consequently,
post-split share prices of firms in which the majority is owned by institutions are higher than
those of firms in which the majority is owned by individual investors. The rationale behind their
findings lies in the fact that institutions pay lower brokerage costs with high-priced stocks while
small investors are better off with low-priced stocks.
The trading range hypothesis of stock splits is also supported by survey-based research.
Based on a survey of chief financial officers of firms listed on New York Stock Exchange, Baker
and Gallagher (1980) report that around 65 percent of financial executives agree that the stock
split is a useful device to lower stock price. Consequently, a lower price is perceived as an
attraction to investors, broadening the ownership base. In a later study, Baker and Powell (1993)
survey managers of 251 NYSE and Amex firms who issued stock splits between 1988 and 1990.
They conclude that the most important motive of a split is to move the stock price into a better
trading range, while the second most important motive is to improve trading liquidity. However,
the empirical finding of Conroy, Harris, and Benet (1990) shows that managerial expectations
are not realized: indeed, splits result in decreased liquidity. The disparity between what
managers expect and what actually happens might be a result of how managers and empirics
view liquidity. Managers appear to define greater liquidity as increasing the number of
shareholders and widening the ownership base, whereas some empirical studies (Conroy et al.,
1990) appear to measure liquidity in terms of decreased bid-ask spreads.
Conroy et al. (1990) study the relationship between stock splits and shareholders liquidity
sample of 143 non-splitting NYSE stocks, they find that shareholders liquidity, measured by the
percentage bid-ask spread, is actually worse after stock splits. Two different tests are developed
in analyzing the changes in bid-ask spreads in their study. The first is a t-test comparing the
cross-sectional mean from the pre-announcement period to the cross sectional mean after the
split. The second test calculates for each stock the difference between the mean spread before
the announcement and after the ex-date. They conclude that the absolute bid-ask spread as a
percentage of closing stock price increases after the ex-date suggesting the existence of liquidity
costs. Conroy et al. (1990) suggest that the liquidity cost implies that stock splits are a valid
signal of favorable information.
Harris (1997) argues that a larger tick may be associated with fewer trading errors and
fewer misunderstanding about agreed- upon transaction prices. Having a larger tick size in
several ways may reduce the cost of market making. Thus an increase in the relative tick size
following a split implies a wider minimum spread. Schultz (2000) also addresses the traditional
explanation that stock splits increase the number of small shareholders as increased bid-ask
spreads give brokers higher incentives to promote the splitting firm’s stock. He hypothesizes
that a real consequence of a stock split is an increase in the tick size in proportion to the stock’s
price. This is an important change because a larger tick size may result in more profitable market
making, providing brokers with additional incentives to promote or sponsor the newly split
stock. Schultz (2000) studies a sample of intraday trades and quotes around splits of 146
NASDAQ and 89 NYSE/AMEX stocks. The evidence shows that stocks are being promoted or
sponsored following a split. Therefore, his results are consistent with the notion that splits are
appears to be accompanied by humble declines in some of the costs of making markets, which is
consistent with splits acting as an incentive to brokers to promote stocks.
2.1.3. Other theories
The tax option theory suggests that since stock splits increase trading liquidity due to
lower share prices and higher numbers of shares outstanding, they provide several opportunities
for investors to trade- in stocks and realize capital gains. Since investors benefit from these
options, there is a favorable reaction to the announcement.
Lamoureux and Poon (1987) suggest that, under the U.S. tax law during the pre-1985
period, investors preferred long-term capital gains to short-term. Therefore, a stock with a wide
price fluctuation has a higher value since investors have greater chances to manage their capital
gain or loss. According to Copeland (1979), the liquidity of a stock is actually reduced by a
split. Ohlson and Penman (1985) show that, subsequent to split ex-days, stock volatilities
increase by an average thirty- five percent. If this is the case, how can the positive reaction
around the announcement of stock splits be justified in light of increased risk and reduced
liquidity? Lamoureux and Poon (1987) explain this positive abnormal return in the context of
Constantinides’ (1984) “tax option” model. According to this “tax option” model investors are
willing to pay a premium for securities with higher volatilities given the nature of the U.S. tax
code. Therefore, the tax-option value hypothesis predicts that subsequent to split
announcements, return volatility increases and an increase in volatility is positively related to the
announcement period returns. Lamoureux and Poon (1987) use empirical evidence based on
large stock splits during 1962 through 1985. Their results support the tax-option hypothesis in
around the announcement of a split. Thus, there is an increase in volatility that is diversifiable or
desirable, particularly to those investors in high tax brackets, as it expands their tax opportunities
of owning the stock. They further predict that the market reaction to stock splits would be lower
under the 1986 Tax Reform Act that treats capital gains and ordinary income equally, thereby
eliminating the tax option available to investors.
Ikenberry et al. (1996) study the “self selection” hypothesis as a synthesis of the trading
range and signaling theories. They do not treat the signaling and the trading range hypothesis as
mutually exclusive, instead they contend that managers use splits to move share prices into a
trading range, but condition their decision to split on expectations about the future performance
of the firm. Their sample includes 1,275 two- for-one stock splits announced by NYSE and ASE
firms between 1975 and 1990. Their results show that nearly four out of five sample firms
traded at prices at or above the 80th percentile in comparison to firms of similar size. This price
run- up prior to the split announcement suggests that firms split their shares after experiencing a
dramatic increase in stock price. Thus, post-split prices are generally lower tha n the median
price observed for firms of comparable size in the same four-digit SIC code. These results
support the view that splits are generally used to realign share prices to a normal trading range.
In order to study the signaling hypothesis, Ikenberry et al. (1996) also measure long-run
performance. First, they find a 3.38 percent five-day announcement return, which confirms prior
research that splits convey favorable information. Their stock split sample generates a
significant excess return of 7.93 percent in the first year after the split, and excess returns of
12.15 percent in the three years following the split. Finally, their results suggest that splits
realign prices to a lower trading range, but managers self-select by conditioning their decision to
Other papers (Rozeff, 1998; Fernando, Krishnamurthy, and Spindt, 1999) examine
different theories of stock splits using evidence from mutual funds. Rozeff (1998) uses a sample
of 120 mutual fund stock splits during 1965 through 1990. He develops new explanations for
the mutual fund split. The four major theories that appear in the literature, namely signaling,
trading range, tick size, and tax-options do not apply in the context of mutual funds. The
signaling theory does not apply because there is no higher cost of transaction at lower prices for
mutual funds. The trading range argument too falls short in justifying splits as liquidity is not a
major concern for mutual funds. However, liquidity is not a consideration within mutual funds.
For the most part, shares of mutual funds are easily traded or redeemed without any additional
cost. Tick size is a different consideration included in the literature of stock splits that do not
apply in the context of mutual fund splits as mutual funds have a continuous tick size. Therefore,
Rozeff (1998) includes three different explanations for mutual fund stock splits. The first
explanation is money illusion, in which investors might stay away from high-priced mutual fund
stocks because they believe that a high price makes it more likely that the price can decline. The
second explanation is that the fund expects to make high capital gains tax distributions in the
future. By attracting new investors who buy into the tax liability, current shareholders benefit.
The third explanation is that shareholders tend to prefer to have more shares than a fraction. It is
more convenient for shareholders to have more shares with a lower price than fewer shares with
a higher price in case they decide to make a gift of shares or liquidate small amounts.
Rozeff (1998) concludes that the money illusion hypothesis does not hold. Under this
hypothesis, there should be fewer shareholders and/or fewer assets under management for funds
with prices higher than average prices, which is not the case. His results also show that about
common stocks. This frequency of mutual fund splits is far less than that of common stock
splits, suggesting that company managers have more compelling reasons to split than fund
managers. As in the case of common stock, mutual fund splits occur in high-priced funds after
unusually high returns. The post splitting results however differ from common stock splits.
Mutual fund splits do not subsequently outperform non-splitting funds. Finally, he finds that
post-split number of shareholders and assets do not increase compared with funds having similar
rates of asset growth. However, mutual fund splits bring per account shareholdings back up to
normal levels.
2.2. Utility industry
The basic difference between industrial companies and utility companies is the regulatory
process. Utility companies are regulated primarily by the state regulatory commissions as well
as federal regulation agencies. Although the extent of regulation varies somewhat from state to
state, the general purpose of regulation is to make sure that customers get safe and reliable
service at a reasonable price. Furthermore, they act to balance the interest of the customer and
the shareholder.4
State commissions in forty- four states are authorized to regulate the issuance of public
utility securities.5 However, stock splits are not regulated by state commissions. According to
the Division of Investment Management of the Security and Exchange Commission, utility
companies that split go through the same procedure as ordinary companies. They file proxy
4
A detailed explanation of the theories of regulation can be found on Appendix A. 5
statements, ask shareholders for formal approval of the split, and adjust their accounting in
accordance with SEC procedures.
2.2.1. EPACT and its impact on information asymmetry.
In 1992 Congress enacted the Energy Policy Act (EPACT) to encourage the development
of a competitive, national, wholesale electricity market with open access to transmission
facilities owned by utilities to both new wholesale buyers and new generators of power. In
addition, the EPACT reduced the regulatory requirements for new non-utility generators and
independent power producers. The Federal Energy Regulatory Commission initiated rulemaking
to encourage competition for generation at the wholesale level by assuring that bulk power could
be transmitted on existing lines at cost-based prices. Under this legislation and rulemaking
generators of electricity, whether utilities or private producers, could market power from
underutilized facilities across state lines to other utilities.
In general, as an industry is deregulated, managers are less subject to subsidized controls
by regulatory agencies that otherwise acted as a substitute for internal governance mechanisms.
Moreover, managers in a deregulated environment are less subject to close supervision by
regulatory agencies and are not required to have full disclosure of information. As a
consequence, it is expected to be more difficult for the public to observe and judge manager’s
actions. Kim (1998) lists different factors for the increase of information asymmetry in
deregulated markets. For instance, after deregulations managers have more opportunities for
discretionary actions which are completely unknown to the public. Government intervention
determines firms strategy and imposes constraints upon strategic decisions. Therefore, the
markets are deregulated restrictions imposed on strategic moves disappeared increasing the
sensitivity of firm value to managerial decisions.
2.2.2. Empirical evidence on utility companies.
In this section, I address two different issues in the financial literature with regards to the
differences between public utility industry and other industries. First, I look at the market
response to new equity issues by utility companies. Then, the capital structure of a regulated
firm is addressed.
A) Share price response to new equity issue by utility companies.
A number of studies investigate the share price response associated with the issuance of
new equity for utility companies and how these results differ from industrial companies (Asquith
and Mullins, 1986; Masulis and Korwar, 1986; Filbeck and Hatfield, 1999). Asquith and Mullins
(1986), and Masulis and Korwar (1986) both find that industrial firms experience larger negative
excess returns than utility firms. Both studies suggest that the information asymmetry is much
lower for utility firms than industrial firms since the former are subject to regulation.
Filbeck and Hatfield (1999) investigate the relationship between the level of institutional
ownership and the magnitude of the share price response to new equity issues by public utility
firms. They argue that due to the regulatory environment that exists for public utility companies,
the monitoring role of institutional investors is mitigated. They look at a sample of 325 stock
issues by public utility companies from 1977 to 1994. They hypothesize that the number of
institutional investors and the proportion of shares owned by institutional investors are
The ability of institutional shareholders to signal information about a new equity issue is
superseded by the presence of regulation. Their results show that there is a lack of relationship
between the level of institutional ownership and the magnitude of the share price response to the
announcement of a new equity issue by a public utility firm.
B) Capital structure of a regulated firm
A different issue that is also addressed in the literature regarding to the difference
between the utility industry and other industries is the effect of regulation on capital structure.
Taggart (1981) analyses possible “price- influence” effects of a regulated firm’s capital
structure. For a firm subject to rate-of-return regulation, the output price is set by an outside
agency so as to yield a “fair” return to providers of capital, and, if effective, this process reduces
monopoly profits. But if the regulator’s price-setting rule depends on the firm’s capital structure
in some predictable way, the firm may be able to influence price and hence earn additional
profits by choosing its financing mix. Taggart (1981) shows that firms have the incentive to
change their capital structures given the regulated environment, specifically under rate-of return
regulation. The magnitude of the change depends on the specific details of regulatory
price-setting procedures.
Spiegel and Spulber (1994) create a model of the regulatory process in which the capital
structure of firms plays a role in the strategic interaction between regulators and firms. He
suggests that firms choose a positive amount of debt as a consequence of regulation despite the
presence of high bankruptcy costs. Debt serves to raise the regulated rate-of-return as the
invests less than the social optimal level, which in turn raises regulated rates above the optimal
CHAPTER 3
HYPOTHESES
Information asymmetry and the resulting signaling implication associated with various
managerial decisions have repeatedly been tested on industrial firms. Up until 1993,electric
utilities were regulated and consequently, researchers considered the level of information
asymmetry in utility firms to be less pronounced than firms in unregulated industries. In studying
signaling implications of corporate events, most researchers, therefore, excluded utility firms
(see Conroy, Harris, and Benet, 1990; Maloney and Mulherin, 1992). A few studies that have
included utilities in their analyses find evidence of lower signaling effect from managerial
decisions of firms in the utility industry. For example, Asquith and Mullins (1986) and Masulis
and Korwar (1986) study the share price response associated with the issuance of new equity for
utility companies and how these results differ from industrial companies. They find that
industrial firms experience larger negative excess returns than utility firms. Both studies suggest
that the information asymmetry is much lower for utility firms than industrial firms since the
former are subject to regulation.
The regulatory environment for electric utilities has changed dramatically with the
enactment of the EPACT in 1992. This act encourages the development of a competitive,
national, wholesale electricity market with open access to transmission facilities owned by
utilities to both new wholesale buyers and new generators of power. The benefits of competition
insured that more open markets for generation would spread creating diversity among generators.
Before the enactment of the EPACT, the regulatory environment alleviated information
monitoring by regulatory agencies that otherwise acted as a substitute for internal governance
mechanisms. Moreover, increased competition resulting from the EPACT leads firms to be
more responsive to consumer demands, monitor costs more closely, and compete on the basis of
price.6 As a consequence, it is expected to be more difficult for the public to observe and judge
managers’ actions. Therefore, after the enactment of the EPACT the characteristics of this
environment change increasing the levels of information asymmetry between managers and
investors. Kim (1998) lists different factors for the increase of information asymmetry in
deregulated markets. For instance, in a regulated market, government intervention determines
firm’s strategy and imposes constraints upon strategic decisions. In contrast, when markets are
deregulated restrictions imposed on strategic moves disappeared increasing the sensitivity of
firm value to managerial decisions. Managers have more opportunities for discretionary actions
which are completely unknown to the public. Therefore, the strategic decision-making shifts
away from public officials to managers. A low level of information symmetry in the pre-EPACT
era and increased information asymmetry in the post-EPACT period provide a clean backdrop to
test signaling hypothesis linked to many managerial decisions. A firm’s decision to split stocks is
one of such decisions.
There is strong evidence that points to investors’ positive reaction to the announcements
of stock splits (see, among others, Fama, Fisher, Jensen, and Roll, 1969; Bar-Yosef and Brown,
1977; McNichols and Dravid, 1990; Ikenberry, Rankine, and Stice, 1996; and Desai and Jain,
1997). This evidence suggests that there are benefits associated with splitting stocks. Two major
theories have emerged in the financial literature to explain the positive abnormal returns at the
announcements of stock splits-- the signaling theory and the trading range theory.
6
The signaling theory posits that firms split their shares to reveal favorable future
information. Empirical work in this area finds strong evidence of the presence of signaling effect
related to stock splits by industrial firms. (see, among others, Asquith, Healey, and Palepu, 1989;
Brennan and Hughes, 1991; Desai and Jain, 1997; and Schultz, 2000). The trading range theory
advocates that splits realign per-share prices to a preferred price range. This preferred price
range is mainly justified on the basis that it improves liquidity and marketability. This theory is
also supported by managers surveyed (see Baker and Gallagher, 1980; and Baker and Powell,
1993) as well as empirical findings (see, among others, Lakonishok and Lev, 1987; and D’Mello,
Tawatnuntachai, and Yaman, 2003). Based on their sample of American Depository Receipts
(ADR), Muscarella and Vetsuypens (1996) conclude that liquidity argument prevails in
explaining the positive reaction to stock split announcement, since ADRs can not be motivated
by any managerial desire to signal favorable information.
In this dissertation, I examine both the signaling argument and the liquidity/marketability
argument by comparing the pre-EPACT period with the post-EPACT period. As such, my
approach is an improvement on the approach taken by Muscarella and Vetsuypens (1996). This
is so because this dissertation can better distinguish between signaling and
liquidity/marketability motives for stock splits simultaneously within the same sample, given the
changes in the level of information asymmetry experienced by the electric utility firms.
In this dissertation, I test three major hypotheses. The first hypothesis is
H1: The excess return related to stock split announcement would be lower
The rationale behind this hypothesis is as follows. Asquith and Mullins (1986) and Masulis and
Korwar (1986) find that industrial firms experience larger negative excess returns than utility
firms in reaction to the issuance of new equity. They attribute this result to lower information
asymmetry in utility firms due to regulation. Since before 1992 regulation prevailed and it started
dissipating after 1992, the underlying expectation in H1 is justified.
Grinblatt, Masulis, and Titman (1984) and Ikenberry, Rankine, and Stice (1996) conclude
that stock splits employed by firms with high level of information asymmetry convey more
information and thus the market reacts more positively to their announcements. This leads to my
second hypothesis.
H2: The excess return related to stock split announcement would be lower in
the pre-EPACT period than the post-EPACT period.
My third hypothesis is in the same vein as the first two in that it stems from level of information
asymmetry in the two periods.
H3: In the pre-EPACT period the liquidity motive of stock split dominates for
CHAPTER 4
METHODOLOGY
The methodology section is composed of four different sub-sections. In sub- section 4.1 I
test hypothesis 1 by looking at the market reaction to public utilities stock split announcement.
In sub-section 4.2 I explain the signaling measures which include the procedure for calculating
changes in operating performance. Sub-section 4.3 presents the liquidity measures used in the
study. Finally, in sub-section 4.4 I discuss the regression analysis.
4.1. The market reaction to public utility stock splits
To capture price responses around split announcement, for each company j, I form a three
day cumulative abnormal return (ARj) centered on the split announcement day. This abnormal
announcement period return is defined as the return in excess of the value-weighted market
return cumulated over the three-day window. ARj is calculated as the sum of daily abnormal
returns (arjt) where
arjt = rjt – rmt (1)
r = Daily return on a stock;
rm = Daily return on the value-weighted CRSP index;
t = Day relative to the split announcement day (t = 0).
The market-adjusted model is used to calculate the abnormal announcement period return
model. Thus, Campbell, Ederington, and Vankudre (1991) find that there is an upward bias in
the intercept term of the market model parameter that lowers estimates of abnormal
announcement period returns due to the significant run-up in stock prices in the period before the
split.
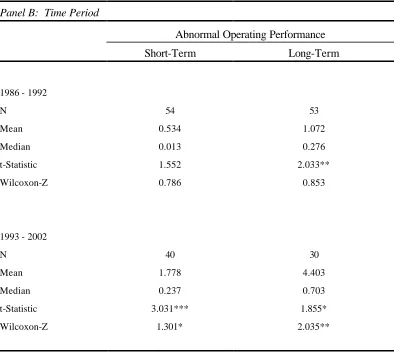
4.2. Signaling measures
This study tests the signaling hypothesis by looking at the relation between split factors
and abnormal return, and the changes in operating performance of the splitting firms. Asquith,
Healy, and Palepu (1989) find that splitting firms experience earnings growth for at least four
years subsequent to the announcement. In addition, Desai and Jain (1997) show that splitting
shares significantly outperform by about 7 percent in the year following the split and by about 12
percent in the three years following the split. Rozeff (1998) finds that splitting funds do not
subsequently outperform non-splitting funds. He argues that this result is inconsistent with
managerial signaling. Therefore, it is important to study post-split operating performance of
utility stock splits to access whether managers deliberately attempt to convey information when
they announce a split. Abnormal Operating Performance for short-run (AOS) and long-run
(AOL) are defined as follows:
AOS = (2)
AOL= (3)
TA= Standardized variable, total assets measure;
Med= Median firm in the industry;
Subscripts -1= Fiscal year-end prior to the announcement;
Subscripts 0= Fiscal year-end immediately after the announcement;
Subscripts +2= Two fiscal year-end after the announcement.
Therefore, the short-term (long-term) abnormal operating performance measures the one
year (three year) difference between the standardized operating performance of the splitting
sample and the standardized median operating performance of the industry. Where the industry
is defined as all companies within the 4900s SIC codes that have not split within the sample
period.
4.3. Liquidity measures
The literature on stock splits has used different proxies for liquidity. For instance, by
using trading volume as a proxy of liquidity, Copeland (1979) and Lamoureux and Poon (1987)
find that dollar trading volume declines after OTC, NYSE, and AMEX stock splits. Conroy,
Harris and Benet (1990) report that there is a decrease in split-adjusted volume following a stock
split, while Arnold and Lipson (1997) find that trading volume increase subsequent to a stock
split. Share price volatility, as a measure of liquidity, has been shown to increase following a
stock split (Conroy, Harris, and Benet, 1990; Desai, Nimalendran, and Venkataraman, 1998;
Dubofsky, 1991).
Another measure of market liquidity is the relative bid-ask spread supported by traders.
(1998) find that bid-ask spread expressed as a percentage of stock price increases after a split,
indicating a decline in liquidity, while Murray (1985) provides no evidence of such an effect.
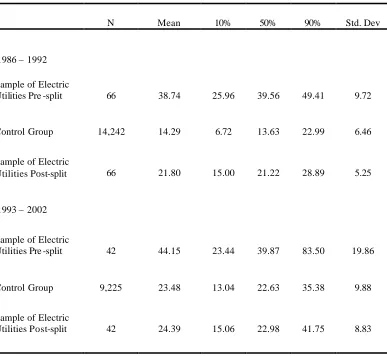
In this study I use two measures of liquidity, change in the number of shareholders and
trading patterns around public utility stock splits. The change in the number of shareholders is
calculated between the fiscal year-end before and after the split ex-date. For the study on trading
patterns, I follow Muscarella and Vetsuypens (1996) and collect all trades for 120 trading days
before and after the split ex-date for my sample of electric utility firms. By examining pre and
post-split characteristics of the full sample of all transactions, I am able to identify whether or
not small investors might have become more active in the market after the split as result of
liquidity improvements.
4.4. Regression analysis
The next step is to analyze the cross-sectional variation in the price reactions to the stock
split announcements. A linear regression is estimated where firm characteristics, split factor,
price run- up, percentage change in the number of shareholders, firm asset value, and change in
operating performance are included as independent variables. I will run the following
regression:
AR = a+ ß1 SPLIT + ß 2 RUNUP + ß 3 LNAT + ß 4∆SHO
+ ß 5 ∆OPER + et (4)
AR= Three-day announcement period return;
a= Intercept;
SPLIT= Size of split factor;
RUNUP= Stock price increase from day -120 to day -6;
LNAT= Natural logarithm of the firm’s total assets;
∆SHO= Percentage change in the number of shareholders;
∆OPER= Abnormal change in operating performance;
and e = Error term.
LNAT is the natural logarithm of the firm’s total assets the fiscal year-end previous to the split
announcement7, ∆SHO is the percentage change in the number of shareholders from the fiscal
year-end previous to the split announcement to the fiscal year-end immediately after the split,
and ∆OPER is the one- year abnormal change in operating performance defined in section 4.2
above.
By using these variables I test the liquidity versus the signal motive of splitting stocks.
Both, the price run-up and the change in the number of share holder variables are testing whether
abnormal returns can be explained by changes in liquidity and marketability after the split. The
variable run-up measures the stock price increase from day -120 to day -6. If the stock price
increase is abnormally large, then managers will be inclined to split their stocks to bring share
prices to a typical trading range. Thus, this variable acts as a forecast of the forthcoming stock
split. Hence, RUNUP should be negatively related to the announcement returns of stock splits
according to the marketability hypothesis. On the other hand, the change in the number of
shareholders is predicted to be positive under the liquidity hypothesis.
The next three variables, total assets, change in operating performance, and size of the
split factor, are included in this regression to examine whether investors view splits as a signal of
7
future performance. Following Grinblatt et al. (1984), I include firm size to test whether
investors perceive split announcements from smaller firms somewhat different than
announcement from larger firms. The split announcement of smaller firms should create greater
market interest than it would in the case of larger firms since the former have fewer
announcements published in the financial media and therefore, are less followed. Hence, there
should be an inverse relationship between announcement period abnormal returns and the size of
the firm. Signaling explanations are consistent with abnormal increase in earnings and/or
dividends after the split. Thus, abnormal excess returns are observed at the split announcement
because investors implicitly conclude that the split decision signals manager’s belief that stock
prices will continue to increase given future increase in earnings. The following variable, split
factor SPFAC, has been used in a number of studies.8 These studies find a positive relation
between SPFAC and announcement returns. Larger split factors represent bigger percentage
moves from the current price. Therefore, SPFAC is expected to be positively related to the
announcement return.
CHAPTER 5
DATA DESCRIPTION
In section 5.1 I describe the data selection criteria. In section 5.2 I discuss some of the
financial and asset characteristics of the sample of public utility splitting firms and compare them
with non-splitting firm.
5.1. Data
The data for this study were drawn from two sources: the Center for Research in Security
Prices (CRSP) Daily Master Tape, and the annual Compustat Tape. This study focuses on
electric utility stock splits of five- for- four or greater that are listed on the American Stock
Exchange (AMEX), the New York Stock Exchange (NYSE) and the National Association of
Secur ities Dealers Automated Quotation System (NASDAQ) from 1986 through 2002.9 I
deleted 1 stock distribution with split factor less than 0.25. Table I presents the sample selection
criteria. Following Grinblatt, Masulis, and Titman (1984), the event date (day 0) is defined as
the earlier of the declaration date of the event on the CRSP daily master tape or the
announcement date in the Wall Street Journal. The split data is the CRSP distribution code 5523.
I include all electric and gas utility companies reported on CRSP under Standard Industrial
Classification (SIC) codes 4900 – 4939 for every year of the sample selection. Gas production
and distribution companies are included in this study due to the high degree of interconnection
between them and electricity suppliers. Thus, there are many mergers of electric utilities with
9
natural gas utilities within the sample period justified on the basis of power source
diversification. The final sample from CRSP includes 158 electric and gas utility stock splits.
Further, to eliminate the effects of contemporaneous announcements, I delete 50 observations for
which the Wall Street Journal Index reported earnings or dividend information during a
three-day period from one three-day before to one three-day after the stock split announcement date (three-day 0). After
1998, the Wall Street Journal Index stopped the announcement of stock splits. Therefore, the
Mergent Public Utility Annual Report was used to verify the split announcement date. These
screening procedures identify 108 observations. To remain in the sample for this study,
companies must have data available in the Compustat annual files. Of the original 80
companies, 70 meet these criteria. The final sample includes 95 electric utility stock splits (70
electric companies) during 1986 to 2002.
In addition to the test sample, a control sample is constructed by taken all companies
within the 4900’s SIC codes that did not split during the sample period. These criteria resulted
in 249 electric utility companies that did not split during 1986 and 2002.
5.2. Sample summary
Stock splits are quite a frequent event within public utility firms. Table II presents the
frequency of utility stock splits; that is, the number of splits dividend by the total number of
utility companies. This frequency varies from a low of 0.77 percent in 1995 to a high of 7.14
percent in 1987. Generally speaking, more splits are observed following bull markets. The
average annual frequency from 1986 through 2002 is 4.98 percent. Lakonishok and Lev (1987)
report that common stock split frequency averages 6.03 percent from 1963 through 1982,
A recent study from Michayluk and Kofman (2001) find that the total number of stock
splits with a split factor of at least 25 percent rose by almost 300 percent from 245 in 1990 to 724
in 1998. However, the results for public utility firms show that the number of stock splits has not
increased in the last years of the sample.
Table I
Sample Selection Criteria
This table presents sample selection criteria, the number of splits and companies deleted under each criterion. The final sample includes 70 electric utility companies that announced 95 stock splits during 1986 to 2002.
Criteria Number of Number of
Splits Companies
Electric and Gas Utilities stock splits (SIC 4900 - 4939) announced during 1986 and
2002 from CRSP 159 112
Split Factors less than 0.25 1 1
Original sample 158 111
Corporate announcement released during a
three day period centered around day 0a 50 47
Clean sample 108 80
Data not available on Compustat 13 10
Final Sample 95 70
a
The total number of electric utility companies has decreased from 247 in 1986 to 173 in
2002. This industry has undergone a major restructuring through mergers and acquisitions since
its deregulation in the 1990’s. Table III shows the number of delisting companies during 1986 to
2002. From the total number of mergers (160) during the sample period (1986-2002), 98 or 61.3
percent occurred during 1997 through 2002.
Table II
Annual Distribution of Electric Utility Stock Splits
The “Total Number of Utility Companies” column shows the total number of utility companies reported on CRSP under SIC codes 4900 – 4999 for every year of the sample selection. The column label “Number of Splits” shows the distribution by year of 108 electric utility stock splits from 1986 through 2002. The “Split Frequency” column shows the frequency of electric utility stock splits in a given year. That is, the number of splits divided by the total number of utility companies.
Year
Total Number of Utility Companies
Number of Splits
Split Frequency
1986 247 17 6.88
1987 252 18 7.14
1988 260 3 1.15
1989 253 8 3.16
1990 256 2 0.78
1991 254 2 0.79
1992 262 16 6.11
1993 258 12 4.65
1994 263 3 1.14
1995 261 2 0.77
1996 258 7 2.71
1997 256 2 0.78
1998 243 2 0.82
1999 229 5 2.18
2000 208 4 1.92
2001 182 3 1.65
Table III
Delisting of Utility Companies, 1986-2002
The table shows the delisted number of utility companies by year during 1986 to 2002. The ‘Mergers’ column shows the number of companies with delisted codes 231,233, and 241 on CRSP during the sample period. The ‘Insufficient Capital / Delinquent Filling’ column shows the number of companies with delisting codes 560,561 and 580 on CRSP. The ‘Other’ column shows all other delinquent codes on CRSP found for electric utility companies.
Delisted
Year Mergers
Insufficient Capital
Delinquent Filling Other Total
1986 9 1 1 11
1987 0 2 0 2
1988 9 1 1 11
1989 5 1 0 6
1990 5 4 3 12
1991 2 2 0 4
1992 4 3 5 12
1993 7 2 1 10
1994 7 2 5 14
1995 9 3 1 13
1996 5 2 3 10
1997 15 4 4 23
1998 18 1 3 22
1999 18 4 6 28
2000 31 1 4 36
2001 8 2 2 12
2002 8 0 5 13
Total 160 35 44 239
Table IV shows the distribution of split factors in the 108 clean sample. Panel A shows