I J H S
Original Article
International Journal of Health Studies
Extracting Rules for Diagnosis of Diabetes Using Genetic Programming
Fatemeh Ahouz1, Mehrdad Sadehvand1, Amin Golabpour2*
1 Department of Computer Engineering, School of Engineering, Behbahan Khatam Alanbia University of Technology, Behbahan, Iran. 2 School of Medicine, Shahroud University of Medical Science, Shahroud, Iran.
Received: 8 November 2019 Accepted: 10 December 2019
Abstract
Background: Diabetes is a global health challenge that cusses high incidence of major social and economic consequences. As such, early prevention or identification of those people at risk is crucial for reducing the problems caused by it. The aim of study was to extract the rules for diabetes diagnosing using genetic programming.
Methods: This study utilized the PIMA dataset of the university of California, Irvine. This dataset consists of the information of 768 Pima heritage women, including 500 healthy persons and 268 persons with diabetes. Regarding the missing values and outliers in this dataset, the K-nearest neighbor and k-means methods are applied respectively. Moreover, a genetic programming model (GP) was conducted to diagnose diabetes as well as to determine the most important factors affecting it. Accuracy, sensitivity and specificity of the proposed model on the PIMA dataset were obtained as 79.32, 58.96 and 90.74%, respectively.
Results: The experimental results of our model on PIMA revealed that age, PG concentration, BMI, Tri Fold thick and Serum Ins were effective in diabetes mellitus and increased risk of diabetes. In addition, the good performance of the model coupled with the simplicity and comprehensiveness of the extracted rules is also shown by the experimental results.
Conclusions: GPs can effectively implement the rules for diagnosing diabetes. Both BMI and PG concentration are also the most important factors to increase the risk of suffering from diabetes.
Keywords: Diabetes, PIMA, Genetic programming, KNNi, K-means, Missing value, Outlier detection, Rule extraction.
*Corresponding to: A Golabpour, Email: [email protected] Please cite this paper as: Ahouz F, Sadehvand M, Golabpour A. Extracting rules for diagnosis of diabetes using genetic programming. Int J Health Stud 2019;5(3):23-32
I
ntroduction
Diabetes is a chronic and metabolic disease that is becoming a global challenge, in which its prevalence is increasing every year. This disease occurs when either the pancreas does not generate enough insulin or the body cannot effectively use the insulin that the pancreas produces.1 Type 1
diabetes (diabetes in juvenile or childhood-onset), type 2 (diabetes in adult-onset) and gestational diabetes (GDM) are the common types of diabetes.2 Type 2 diabetes is the most
common form of the disease.1,3 This type is characterized by
insulin resistance and relative insulin deficiency.4 Based on the
international diabetes Federation report in 2017, there were approximately 5 million deaths worldwide in people aged 20 to 99 suffering from diabetes. According to this report, the number of people suffering from diabetes in 2017 was 451 million worldwide and is expected to rise to 693 million by 2045.5 In Iran, the number of people with diabetes is
4,985,500.6 In Iran, at the fourth round of the periodic national
survey of risk factors for non-communicable diseases project in 2011 (SuRFNCD-2011), it is estimated that by 2030, 9.2 million Iranians will have diabetes.7 It is predicted that nearly
half of people suffering from diabetes worldwide have not been diagnosed.5,8 In addition to the damage directly caused by
diabetes, the disease is the main leading cause of other diseases such as kidney9 failure, heart attacks, stroke,10 and blindness. In
2010, diabetes retinopathy was reported to account for 2.6% of the world's blindness.11 In 2017, the global cost of health care
for diabetics is also estimated at $ 850 billion.5
The steady increase in the prevalence of diabetes reveals a high burden of disease in Iran and also in the world, resulting in higher costs of medical care, decreased quality of life, and increased mortality. According to the international diabetes federation, 80% of the problems are caused mainly by type 2 diabetes, which can be prevented or delayed by early detection of people at risk.5 Hence, it is critical to develop some methods
for early detection of this disease in order to prevent the occurrence of severe problems and complications "because of the large number of deaths in diabetic patients due to late diagnosis".12
Regarding the ability of data mining methods to both extract and discover hidden patterns in the dataset as well as to discover useful relationships for data analysis, many researchers have utilized data mining methods to achieve leading-edge methods in the early detection of diabetes, including.12-17 These methods help to make medical decisions
and diagnoses by discovering the patterns in patients suffering from diabetes.18 Among these methods, the rule extraction has
obtained increasing popularity as in addition to analyzing the relationships between data and identifying the unnecessary parameters and eliminating them in order to increase efficiency, they provide interpretation and reasoning capability.17
Genetic programming (GP), which is a development of genetic algorithm (GA),19 is one of the data mining methods in
rule extraction. In recent years, GP have been applied in medical classification problems, while its performance has been investigated in terms of predictability and understanding of manufacturing rules in such researches.20-22 However, based
on our knowledge, the algorithm's rule extraction capability has not yet been utilized to diagnose diabetes on the PIMA dataset, and that capacity has been lost. Thus, this paper presents a GP-based method to implement rule extraction. Here, the aim is to achieve the optimal, comprehensive, and simple rules so that human beings can achieve high accuracy.
Leema et al.2 has developed a decision support system for
gestational diabetes. Their model consists of three parts: preprocessing, training, and classification. The preprocessing phase includes removing the noisy data and imputing the missing values. During the RBFNN train, each sample in the train dataset is considered as fuzzy rules, in which the extracted weights are applied to prune the generated fuzzy rules. The fuzzy inference system implements these stored rules to classify the samples in the train dataset. The final system consists of 98 rules. The accuracy, sensitivity and specificity of the proposed model on PIMA dataset were reported as 88.3, 79.31 and 93.75%, respectively.
In 2017, Mansourypoor and Asadi,4 proposed a fuzzy
rule-based system with reinforcement learning algorithm to diagnose diabetes, which is based on RLEFRBS evolutionary algorithm. Their model includes the rule base and the rule optimization. After generating the rule database using numerical data without basic rules, there were two pruning phases. One is to eliminate the redundant rules while the other is to eliminate the redundant conditions in the rule antecedent. The GA was then designed to choose the appropriate set of rules. Moreover, the effective rule extraction method is developed to handle non-cover samples. The PIMA database's final rules database contains 19 rules with 91 conditions in antecedent. The accuracy of their model on the PIMA dataset was 0.76% on the train dataset, and 0.84% on the test dataset. Nevertheless, 51 samples of the train and 3 samples of the test were un-labeled.
Cheruku et al.3 applied a spider monkey optimization
algorithm to design an effective rule miner so-called SM-RuleMiner to diagnose diabetes. In this paper, it is claimed that their proposed method, called SMO, a population-based metaheuristic optimization method, is capable to generate an optimal set of rules via high accuracy, balanced sensitivity, and specificity. By dividing the PIMA dataset into 691 train dataset and 77 test dataset, the average accuracy and sensitivity of their proposed model using 10-fold cross validation were reported to 89.87% and 94.6%, respectively. On average, their proposed method produced 4.1 rules with a mean length (MRL) of 2.025. The authors stated that due to an imbalance in the number of positive and negative samples in the dataset, the specificity was and reported 80.11%.
In 2012, Koklu et al.17 provided an optimization method
based on an artificial immune system algorithm called CLONALG to extract the medical data rules. Their method is then investigated on four datasets including PIMA. The authors attribute the differentiation of their method to directly rule extraction from the data itself. The data is also coded optimally to divide it. The result of implementing the CLONALG method on the PIMA dataset consists of 26 rules (13 rules for class zero and 13 rules for class 1). For this dataset, the model accuracy is reported at 77.2%.
In 2014, Sankaranarayanan and Pramananda18 developed
two algorithms by utilizing a set of association rule mining methods called FP-Growth and Apriori to diagnose diabetes through the discovery of frequent patterns. The produced rules are in the form of induction rules. In FP-Growth, a new data structure, a frequent pattern tree, is implemented to store
compressed and critical information about common patterns. Their model output on the PIMA dataset contains 25 rules. Although the validity of the procedure is not mentioned, the authors claimed that these rules have the potential to improve the expert system and also can make better clinical decisions.
In 2013, EL Habib Daho et al.23 proposed a Neuro-fuzzy
classification model, briefly NefClass. The PSO is designed to set the antecedent parameters of the rules in NefClass. This method is applied to set the parameters of the membership functions. Their proposed method consists of eight rules. The accuracy of the model using a 10-fold CV on the PIMA dataset was reported to be 82.32%.
In 2017, Sag and Kahramanli24 focused on the rule
extraction process as a multi-objective optimization problem (MOP). Considering the relationship between rule discovery and optimization, a new approach to derive classification rules from multi-class datasets has been proposed to determine the optimal interval for each attribute in each class. To optimize the problem in this paper, the non-dominated sorting Genetic Algorithm Ⅱ (abbreviated NSGA-Ⅱ) algorithm is developed, which is run for each class separately. The number of rules extracted on the PIMA dataset is 51 rules including 7 rules for class 0 (healthy people) and 34 rules for class 1 (people suffering from diabetes). The accuracy of the system is reported to 100%.
The proposed method in Lekkas and Mikhailov25 discusses
a method for using fuzzy clustering that allows data to be processed online through recursive modification of the fuzzy rule base on a per-sample basis. Their fuzzy rules are derived from the first-order Takagi Sugeno Kang (TSK) model. They utilized the eClass architecture to derive the fuzzy rule-based system and modified it to improve the input data order using a simple optimization strategy, where dependencies in the data sequence give different results. The accuracy of the model on the PIMA dataset was reported to be 79.37% under 7 rules.
The method proposed by Choubey and Paul26 consists of
two phases. In the first phase, the genetic algorithm was used to extract the attributes on the PIMA dataset, which resulted in the selection of four characteristics of plasma glucose concentration, 2-hour serum insulin, BMI and age from the 8 attributes in the PIMA dataset. In the second phase, the J48graft decision tree was considered to classify and predict the attributes selected by the genetic algorithm, which resulted in the production of 12 rules. By dividing 30 into 70 test and train data, the classification accuracy on the test dataset was 74.78%, while its ROC is obtained as 0.786.
Materials and Methods
in this data is reported in table 1. As the dataset is standard, the sample size analysis has not been calculated.
Table 1. Pima diabetes dataset information27
Attribute name Mean [Min, Max] Pregnancies 3.8 ± 3.4 0,17 PG concentration 120.9 ± 32.0 0,199 Diastolic BP (mm Hg) 69.1 ± 19.4 0,122 Tri fold thick (mm) 20.5 ± 16.0 0,99 Serum ins (Mu U/ml) 79.8 ± 115.2 0,846 BMI (kg/m2) 32.0 ± 7.9 0,67.1
DP function 0.5 ± 0.3 0.078,2.42
Age 33.2 ± 11.8 21,81
One of the challenges of classifying diabetes in the PIMA dataset is the missing values and outliers. The first work on this dataset dates back to 1988, where Smith et al.28 performed an
evaluation through a ADAP neural network model to predict the diabetes in the Pima Indians population.14 Smith et al.
determined that the dataset contained unknown values in PG concentration, Diastolic BP, Tri Fold thick, Serum ins and BMI. These unknown values, denoted in the dataset as zero, are listed in many papers under the name missing values.12,13,15,27,29-32 Table 2 listed the number of valid and
missing values in this dataset calculated with SPSS. In fact, the characteristics mentioned medically cannot have a value of zero; for example, it is not reasonable for a living human to have zero sugar blood.33
Table 2. Information about the number of valid and zero values exist in PIMA
Features Missing Valid N
N Percent
Pregnancies 0 - 768
PG concentration 5 0.65 763
Diastolic BP 35 4.56 733
Tri fold thick 227 29.56 541
Serum ins 374 48.7 394
BMI 11 1.43 757
DP function 0 - 768
Age 0 - 768
Diabetes 0 - 768
As the missing values and outliers in the dataset can affect the performance of machine learning systems for classification,34 missing values and outliers should be imputed
and eliminated, respectively before rule extraction. Different imputation algorithms including mean,27 MICE,14 K-means,35
and KNN29 have been developed to handle missing values in
PIMA. Among the proposed methods, the K-NN method has the best performance.13,29,30,36,37 It has also shown good
performance among the methods proposed to detect and eliminate outlier data from the K-means algorithm.12,13,31 The
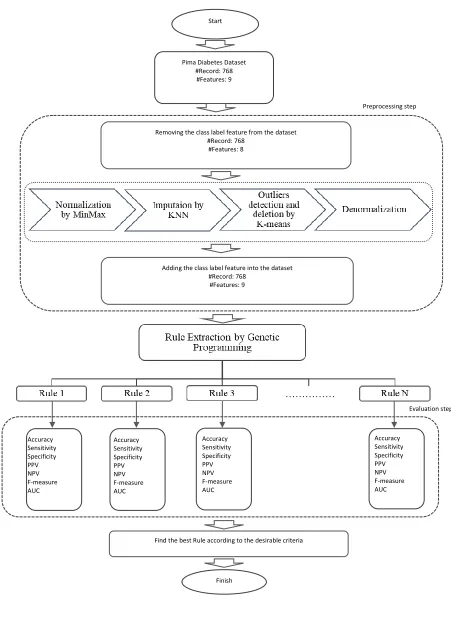
phases and components of the proposed model are illustrated in figure 1. Before imputing the missing values using KNN and discovering the outliers K-means algorithm, the data is normalized in order to remove the impact of different data scales. This is due to the criterion for selection of neighbors in these two methods, which is based on Euclidean distance. Furthermore, the class label attribute in the last column of the dataset is removed from the dataset to prevent having bias. After the missing values of all samples were quantified using kNN,37 the K-means algorithm is implemented to detect and
eliminate outliers. After removing the outliers, the Diabetes property is added to the dataset as a sample label. Ultimately, at
the last stage of the preprocessing, the data is decomposed and the complete PIMA dataset is sent to the next phase of the model.
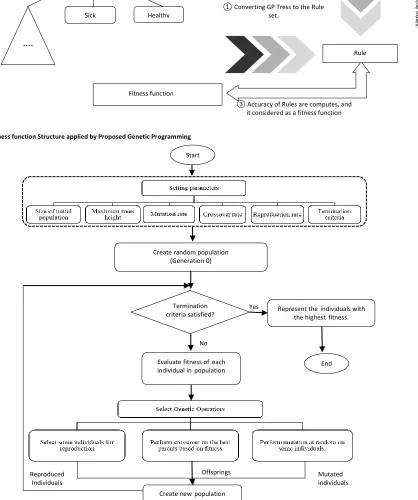
In classification, the aim is to generate a rule that classifies the class. The GP fulfills this purpose, which is part of the evolutionary genetic algorithm. Koza19 first introduced this
algorithm. In GP solutions, some candidates or persons are considered as syntax trees, and then the crossover and mutation operators are applied to these tree structures. The fitness function of proportion depends on the type of task and the desired attributes of the heuristic solution. In data mining tasks, discovered knowledge must have accuracy, comprehensibility, and interesting attributes.38 The evaluation function can
represent the percentage of elements that were correctly classified. Figure 2 depicts the structure of the fitness function for each tree (candidate solution). The fitness function is calculated as shown in figure 2. The decision tree is reported as a fitness function. Figure 3 shows the structure of the research genetic algorithm.
After constructing the proposed model, the results of the rules are compared in terms of complexity of rules, accuracy, sensitivity, specificity, PPV, NPV and F-measure with logistic regression and LDA methods. Most of the reviewed references did not explain in detail how to obtain the
evaluation parameters and presented the result of the parameter setting in aggregation. In addition, these references did not express all the rules that they had obtained.2,17,24 For
these reasons, it is not possible to compare the results of the proposed method with other existing methods. Consequently, the proposed method will be compared with the two mentioned methods due to the specificity of the formula production by the LR and LDA methods.
Results
Implementation of the preprocessing phase is carried out using MATLAB software. After eliminating the diabetes attribute that specifies the class label, the zero value in the PG concentration, Diastolic BP, Tri Fold thick, Serum ins and BMI attributes indicating missing value in these attributes were replaced by NaN, to replace the zero value in the pregnancies attribute, which is a valid value for this attribute. To distinguish them from those zero values existing in pregnancies, these zeros are totally valid in this attribute. In addition, replacing by NaN makes the algorithms able to ignore these values in calculating distance that are applied when trying to find nearest neighbors. Afterwards, the attribute values are normalized to the interval [0,1] using the MinMax normalization method. Moreover, as the KNN method replaces a variable with neighbors each times, the attributes are sorted in ascending order through the number of missing values. The value of k for the implementation of the KNN method was chosen as 17, which was considered using trial and error from the values reported in.13,29,30,36,37 The K-means method is implemented
after imputing the missing values. The value of K in this method is 9.13 Table 2 show the number of instances which are
Figure 1. The components of the proposed model
………
Preprocessing step Start
Pima Diabetes Dataset #Record: 768 #Features: 9
Removing the class label feature from the dataset #Record: 768
#Features: 8
Adding the class label feature into the dataset #Record: 768
#Features: 9
Accuracy Sensitivity Specificity PPV NPV F-measure AUC
Accuracy Sensitivity Specificity PPV NPV F-measure AUC
Accuracy Sensitivity Specificity PPV NPV F-measure AUC
Accuracy Sensitivity Specificity PPV NPV F-measure AUC
Evaluation step
Find the best Rule according to the desirable criteria
Figure 2. The fitness function Structure applied by Proposed Genetic Programming
Figure 3. The structure of proposed genetic programming
Tr
ee
r
epr
es
ent
at
io
n
o
f Gen
eti
c
Pr
o
gr
amm
ing
Fitness function
①Converting GP Tress to the Rule set.
②
T
h
e en
tir
e d
at
as
e
t are
eval
u
at
ed
b
y t
h
e R
u
les
.
③ Accuracy of Rules are computes, and it considered as a fitness function Sick
Rule Dataset
IF
Healthy
….
Mutated individuals Offsprings
Reproduced Individuals
No
Yes Start
Create random population (Generation 0)
Termination criteria satisfied?
Evaluate fitness ofeach individual inpopulation
Represent theindividuals with the highestfitness.
End
The GP implementation is carried out in MATLAB. The initial values of population size, maximum height of tree, crossover rate, and mutation rate are 200, 10, 0.7 and 0.3 respectively. These parameters are calculated using trial and error. The operators used include addition, subtraction, multiplication, and a larger relational operator. 40% of the best and 10% of the worst of the previous generation is duplicated in the next generation to create the new generation. The remaining 50% is made up of 30% of children generated using a crossover and 20% of mutated individuals. It should be noted that in each generation, 0.1 of the worst of the previous
generation, crossover and mutation decrease as well. The criterion for stopping the algorithm is to run 100 generations. The algorithm was then run 10 times and the rules with accuracy higher than 75% were selected, based on which six rules were extracted.
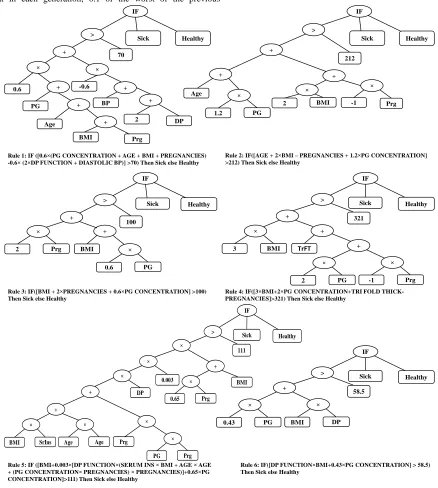
The best extracted rules using the GP method with their tree representation are depicted in figure 4. The rules have been written to diagnose diabetes, in which the samples are classified as healthy if a sample is not electrified. By these rules, the following can be deduced:
IF
Sick Healthy
>
100 +
BMI
2 Prg
+
0.6 PG
IF
Sick Healthy
+
-0.6
DP
0.6 +
PG +
Age +
BMI Prg
BP +
2 + >
70
Rule 1: IF ([0.6 (PG CONCENTRATION + AGE + BMI + PREGNANCIES) -0.6 (2 DP FUNCTION + DIASTOLIC BP)] >70) Then Sick else Healthy
IF
Sick Healthy
>
212
+
-1 +
Age
2 BMI Prg
+
1.2 PG
Rule 2: IF([AGE + 2 BMI – PREGNANCIES + 1.2 PG CONCENTRATION] >212) Then Sick else Healthy
Rule 3: IF([BMI + 2 PREGNANCIES + 0.6 PG CONCENTRATION] >100) Then Sick else Healthy
IF
Sick Healthy
>
321 +
TrFT
3 BMI
+
2 PG -1 Prg
+
Rule 4: IF([3 BMI+2 PG CONCENTRATION+TRI FOLD THICK-PREGNANCIES]>321) Then Sick else Healthy
Rule 6: IF([DP FUNCTION BMI+0.43 PG CONCENTRATION] > 58.5) Then Sick else Healthy
IF
Sick Healthy
>
111
+
PG Prg
Prg
Age Age
BMI SrIns
+
DP 0.003
0.65 Prg
BMI +
Rule 5: IF ([BMI+0.003 [DP FUNCTION (SERUM INS BMI + AGE AGE + (PG CONCENTRATION PREGNANCIES) PREGNANCIES)]+0.65 PG CONCENTRATION]>111) Then Sick else Healthy
IF
Sick Healthy
>
58.5
0.43 PG BMI DP
+
According to the rule 1, increased PG concentration, age, BMI and pregnancies have a positive effect on diabetes, whereas DP function and Diastolic BP have a negative effect. Besides, due to the DP function's coefficient, the effect of this parameter is lower than other parameters on diabetes, which means that increasing this attribute reduces the chance of suffering from diabetes.
According to the rule 2, PG concentration, age and BMI have a positive effect on diabetes and a number of Pregnancies has a negative effect on it. This means that increasing age, BMI and PG concentration increases the chance of developing diabetes and increasing the number of pregnancies reduces the likelihood of diabetes. BMI and PG concentration also have a greater impact, as compared to age and the number of pregnancies.
According to the rule 3, BMI, pregnancies and PG concentration have a positive effect on diabetes and increase the risk of developing diabetes.
According to the rule 4, increasing BMI, PG Concentration and Tri Fold thick increases the likelihood of diabetes, whereas the number of pregnancies decreases this likelihood. BMI and PG concentration are three times more effective than the number of pregnancies and Tri Fold thick.
According to the rule 5, BMI, DP function, Serum ins, age, PG concentration and number of pregnancies are directly related to diabetes. In this rule, despite the fact that the power operator is not used in the construction of the GP trees, the effect of the age attribute on power 2 is extracted.
According to the rule 6, BMI, DP function and PG concentration have a direct relationship with the likelihood of developing diabetes and increase the chance of suffering.
Among the attributes selected by the GP algorithm, PG concentration, BMI and pregnancies had higher frequencies of duplicates in the rules with 7, 7 and 6, respectively. The BMI and PG Concentration attributes are also selected by all six rules, as the important indicators.
Table 3. The results of applying outlier detection by K-means
Class
Before Outlier
Deletion Outliers
After outlier deletion N Percent N Percent N Percent Sick 268 35 56 31 212 36
Healthy 500 65 122 69 378 64
Total 768 178 590
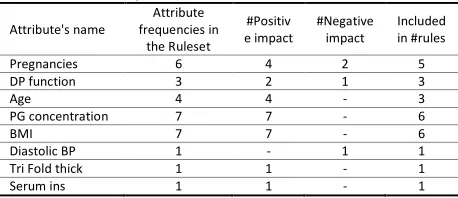
Table 4 listed the information about the frequency of attribute selection by the algorithm to form the rules. Columns 4 and 5 of this table, respectively, indicate the number of times the attribute in the rules is selected as the positive and negative coefficients. The last column of the table shows the number of rules that select a specific attribute as an indicator.
Table 5 shows the comparison of the evaluation parameters of the rules on PIMA. The highest and lowest accuracy among the rules were obtained by rule 5 and rule 2 with 79.32% and 76.95%, respectively. For the sensitivity criterion, the highest is related to rule 6 with 63.68% and the lowest is related to rule 1 with 57.55%. The highest and lowest specificity was obtained by rule 5 and rule 6 with 90.74% and 84.92%, respectively. The highest F-measure is obtained by rule 5 with 67.2%, and the lowest was obtained by rule 1 with 64.55%. The highest and lowest PPV was obtained by rule 5 and rule 1 with 78.13% and 70.31%, respectively. The highest NPV was related to rule 5 with 80.65% and the lowest was related to rule 1 with 78.77%. It can be seen that AUC has the highest value for Rule 5 with 78.97%, whereas it has the lowest for rule 1 with 72.96%.
Table 4. Attribute frequencies in the ruleset
Attribute's name
Attribute frequencies in
the Ruleset
#Positiv e impact
#Negative impact
Included in #rules
Pregnancies 6 4 2 5
DP function 3 2 1 3
Age 4 4 - 3
PG concentration 7 7 - 6
BMI 7 7 - 6
Diastolic BP 1 - 1 1
Tri Fold thick 1 1 - 1
Serum ins 1 1 - 1
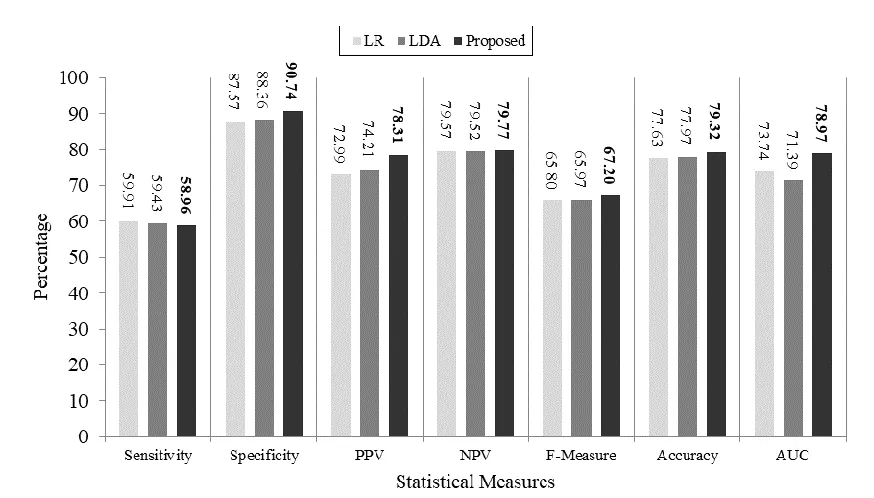
Following the PIMA preprocessing, which includes missing values imputations and eliminating outliers, LDA and LR methods were run on this set. The MATLAB code for both of these methods is used to implement both methods. After implementation, the coefficients obtained by both methods were extracted to form the rule and the system evaluation criteria on the dataset. Table 6 shows the criteria created by these two methods.
As is clear from the table, both methods take into account all attributes. Figure 5 shows the results of the implementation of LDA, Logistic regression and proposed methods on the PIMA dataset after preprocessing this dataset.
The accuracy of the proposed method is higher than LDA and LR, which is, 1.35 (1.7% improvement) and 1.69 (2.2% improvement) respectively. The specificity of the proposed method is 2.38% and 3.17% higher than the LDA and LR, respectively, which means that the proposed method can correctly identify healthy people by 2.7% and 3.6% higher than LDA and LR respectively. The PPV of the proposed method is 4.1 and 5.32 higher than LAD and LR, respectively. Also the NPV of the proposed method is better than LDA and LR of 0.25 and 0.2. The AUC of the proposed method is 8.58 (12%) more than the LDA and 5.23 (7%) more than the LR. The proposed f-measure rate is 1.23 units higher than the LDA and 1.4 higher than the LR. Among the different criteria, only the sensitivity of the proposed method is 0.47 (0.8%) and 0.95 (1.6%) units lower than LDA and LR methods, respectively.
Table 5. Comparison of different evaluation parameters
Length Accuracy Sensitivity Specificity F-Measure PPV NPV AUC
6 77.29 57.55 88.36 64.55 73.49 78.77 72.96
4 76.95 60.85 85.98 65.48 70.88 79.66 73.42
3 77.29 58.96 87.57 65.10 72.67 79.19 73.27
4 77.63 59.43 87.83 65.63 73.26 79.43 73.63
10 79.32 58.96 90.74 67.20 78.13 79.77 78.97
Table 6. Expression produced by logistic regression and Linear discriminant analysis on PIMA dataset after prepossessing
Method Rule Class
Logistic regression
IF({EXP(6.8446 + 0.1308 × PREGNANCIES + 1.6689 × DP FUNCTION + 0.0114 ×AGE+ 0.0333 × PG CONCENTRATION + 0.0645 ×BMI -0.0037 ×DIASTOLIC BP + 0.0046 ×TRI FOLD THICK -0.0003 ×SERUM INS) /(1+EXP(-6.8446 + 0.1308 ×PREGNANCIES+ 1.6689 ×DP
FUNCTION+ 0.0114 ×AGE+ 0.0333 ×PG CONCENTRATION+ 0.0645 ×BMI+ 0.0037 ×DIASTOLIC BP+ 0.0046 × TRI FOLD THICK+ -0.0003 ×SERUM INS))}>0.5)
Sick
Linear discriminant analysis
IF({0.1485 × PREGNANCIES + 1.655 × DP FUNCTION + 0.0098 × AGE + 0.0377 ×PG CONCENTRATION + 0.0663 × BMI -0.003 ×
DIASTOLIC BP - 0.0009 × TRI FOLD THICK + 0.0002 × SERUM INS -7.4031 }>0) Sick
Figure 5. Comparison of evalutaed metrics between LDA, LR and proposed method on PIMA dataset
[
Discussion
This paper follows two main aims: the first aim is to identify the most important parameters affecting the diagnosis diabetes, whereas the second one is to elaborate the comprehensive, high accuracy, easy to interpret, and easy to implement rules in order to diagnose people suffering of diabetes. In this way, the GP method was conducted to achieve this aim. The performance of the method was evaluated on the PIMA dataset. Based on the obtained results and considering the coefficients of attributes in a total of 6 rules, it can be concluded that the attributes of Age, PG concentration, BMI, Tri Fold thick and Serum ins are directly related to diabetes and increase the risk of developing diabetes. BMI, PG concentration, pregnancies, age and DP function are the most important factors of diabetes to extract rule 6 in terms of the number of frequencies. Attributes of PG concentration, Serum ins, BMI and age are four attributes chosen by Choubey et al.26
In addition, in Mansourypoor and Asadi,4 the attributes of age,
PG concentration, pregnancies, BMI, DP function and Tri Fold thick have been identified as the most effective factors respectively. As the interpretability is one of the desirable attributes of physicians, despite the high efficiency of rule 5, it can be difficult for a physician to understand because of the
complexity of rule 5. As such, rule 3 is the most appropriate rule, with acceptable performance, only by considering three attributes and extracting a simple relationship for the practitioner to interpret. Among the attributes chosen by the rules, the Diastolic BP appears in rule 1 with a negative coefficient. That is, an increase in Diastolic BP is directly related to a decreased risk of diabetes. This is contrary to the medical rules reviewed in7. This attribute is also negative via Logistic regression and LDA methods. Regarding that this attribute contains only 4.5% of the missing values in this dataset, the result cannot be attributed to the imputation method, indicating the bias in the PIMA dataset.
One of the limitations of this paper to extract the rules from the PIMA dataset for the diagnosis diabetes is the lack of complete reporting of rules (such as Leema et al.2, Koklu et
al.17 and Saǧ and Kahramanli24 and how the model is evaluated.
It seems that the results reported in Cheruku et al.3 and
Sankaranarayanan et al.18 are the result of applying all the
rules. Moreover, in Cheruku et al.3, the dataset is devided into
accuracy than the other two methods to predict healthy and patients persons. It is also found that the proposed method is able to classify healthy people as a healthy one more accurately than LDA (about 2.7 percent) and LR (about 3.6 percent), leading to lower costs of follow-up care and stress from having the disease. Despite achieving desirable results by the proposed method, the most important limitation of this method is the use of PIMA dataset. The real dataset needs to be used in future work to evaluate the method presented in this paper.
Acknowledgement
The authors appreciate Deputy of research and technology of Khatam Alanbia university of technology.
Conflict of Interest
The authors declare that they have no conflict of interest.
References
1. World Health Organization. Diabetes, 2018.
2. Leema N, Khanna Nehemiah H, Kannan A, Jabez Christopher J. Computer aided diagnosis system for clinical decision making: Experimentation using pima Indian diabetes dataset. Asian Journal of Information Technology 2016;15:3217-31.
3. Cheruku R, Edla DR, Kuppili V. SM-RuleMiner: Spider monkey based rule miner using novel fitness function for diabetes classification. Computers in Biology and Medicine 2017;81:79-92.doi:10.1016/j.compbiomed.2016.12.009
4. Mansourypoor F, Asadi S, Development of a reinforcement learning-based evolutionary fuzzy rule-based system for diabetes diagnosis. Comput Biol Med 2017;91:337-52.doi:10.1016/j.compbiomed.2017.10.024
5. Cho NH, Shaw JE, Karuranga S, Huang Y, da Rocha Fernandes JD, Ohlrogge AW, et al. IDF diabetes atlas: global estimates of diabetes prevalence for 2017 and projections for 2045. Diabetes Res Clin Pract 2018;138:271-81.
doi:10.1016/j.diabres.2018.02.023
6. IDF MENA Members. International Diabetes Federation. 2019 https://idf.org/our-network/regions-members/middle-east-and-north-africa/members/35-iran.html. 7. Esteghamati A, Larijani B, Aghajani MH, Ghaemi F, Kermanchi J, Shahrami
A, et al. Diabetes in Iran: prospective analysis from first nationwide diabetes report of national program for prevention and control of diabetes (NPPCD-2016). Sci Rep 2017;7:13461.doi:10.1038/s41598-017-13379-z
8. Geman O, Chiuchisan I, Toderean R. Application of adaptive neuro-fuzzy inference system for diabetes classification and prediction. E-Health and Bioengineering Conference (EHB) 2017;2017:639-42.doi:10.1109/EHB.2017.7995505
9. Saran R, Robinson B, Abbott KC, Agodoa LYC, Bragg-Gresham J, Balkrishnan R, et al. us renal data system 2018 annual data report: epidemiology of kidney disease in the United States, American Journal of Kidney Diseases 2019;73:A7-8.doi:10.1053/j.ajkd.2019.01.001
10. Emerging Risk Factors Collaboration, Sarwar N, Gao P, Seshasai SR, Gobin R, Kaptoge S, et al. Diabetes mellitus, fasting blood glucose concentration, and risk of vascular disease: a collaborative meta-analysis of 102 prospective studies. Lancet 2010;375:2215-22.doi:10.1016/S0140-6736(10)60484-9
11. Bourne RR, Stevens GA, White RA, Smith JL, Flaxman SR, Price H, et al. Causes of vision loss worldwide, 1990-2010: a systematic analysis. Lancet Glob Health 2013;1:e339-49.doi:10.1016/S2214-109X(13)70113-X
12. Zhu C, Idemudia CU, Feng W. Improved logistic regression model for diabetes prediction by integrating PCA and K-means techniques. Informatics in Medicine Unlocked 2019;17:100179.doi:10.1016/j.imu.2019.100179
13. Alirezaei M, Akhavan Niaki ST, Akhavan Niaki SA. A bi-objective hybrid optimization algorithm to reduce noise and data dimension in diabetes diagnosis using support vector machines. Expert Systems with Applications 2019;127:47-57.doi:10.1016/j.eswa.2019.02.037
14. Barhate R, Kulkarni P. Analysis of classifiers for prediction of type ii diabetes mellitus. Proceedings - 2018 4th International Conference on Computing, Communication Control and Automation, ICCUBEA 2018.
doi:10.1109/ICCUBEA.2018.8697856
15. Cheng CH, Chan CP, Sheu YJ. A novel purity-based k nearest neighbors imputation method and its application in financial distress prediction. Engineering Applications of Artificial Intelligence 2019;81:283-99.
doi:10.1016/j.engappai.2019.03.003
16. Gautam C, Ravi V. Counter propagation auto-associative neural network based data imputation. Information Sciences 2015;325:288-99.
doi:10.1016/j.ins.2015.07.016
17. Koklu M, Kahramanli H, Allahverdi N. A new approach to classification rule extraction problem by the real value coding, International Journal of Innovative Computing, Information and Control 2012;8:6303-15.
18. Sankaranarayanan S, Pramananda Perumal T. Diabetic prognosis through data mining methods and techniques. Proceedings - 2014 International Conference on Intelligent Computing Applications, ICICA 2014;162-6.
doi:10.1109/ICICA.2014.43
19. Koza John R, Riccardo P. A genetic programming tutorial, Introductory Tutorials in Optimization. Search and Decision Support, 2003.
20. Vyas R, Bapat S, Goel P, Karthikeyan M, Tambe SS, Kulkarni BD. Application of genetic programming (GP) formalism for building disease predictive models from protein-protein interactions (PPI) data, IEEE/ACM Transactions on Computational Biology and Bioinformatics 2018;15:27-37.
doi:10.1109/TCBB.2016.2621042
21. Bojarczuk CC, Lopes HS, Freitas AA, Michalkiewicz EL. A constrained-syntax genetic programming system for discovering classification rules: Application to medical data sets. Artif Intell Med 2004;30:27-48.
doi:10.1016/j.artmed.2003.06.001
22. Tan KC, Yu Q, Heng CM, Lee TH. Evolutionary computing for knowledge discovery in medical diagnosis. Artificial Intelligence in Medicine 2003;27:129-54.doi:10.1016/S0933-3657(03)00002-2
23. Habib Daho ME, Settouti N, Amine Lazouni ME, Chikh MA. Recognition of diabetes disease using a new hybrid learning algorithm for NEFCLASS. 2013 8th International Workshop on Systems, Signal Processing and Their Applications, WoSSPA 2013;239-43.doi:10.1109/WoSSPA.2013.6602369
24. Sağ T, Kahramanli H. Classification rule mining approach based on multiobjective optimization. 2017 International Artificial Intelligence and Data Processing Symposium (IDAP), IEEE 2017;1-6. doi:10.1109/IDAP.2017.8090264
25. Lekkas S, Mikhailov L. Evolving fuzzy medical diagnosis of Pima Indians diabetes and of dermatological diseases. Artif Intell Med 2010;50:117-26.
doi:10.1016/j.artmed.2010.05.007
26. Choubey DK, Paul S. Ga_J48graft Dt: A hybrid intelligent system for diabetes disease diagnosis, International Journal of Science and Bio-Technology 2015;7:135-50.doi:10.14257/ijbsbt.2015.7.5.13
27. Thungrut W, Wattanapongsakorn N. Diabetes classification with fuzzy genetic algorithm. International Conference on Computing and Information Technology 2018;107-14. doi:10.1007/978-3-319-93692-5_11
28. Smith JW, Everhart JE, Dickson WC, Knowler WC, Johannes RS. Using the ADAP learning algorithm to forecast the onset of diabetes mellitus. Proc Annu Symp Comput Appl Med Care 1988;9:261-5.
29. Bashir S, Qamar U, Khan FH, Naseem L. HMV: a medical decision support framework using multi-layer classifiers for disease prediction. Journal of Computational Science 2016;13:10-25. doi:10.1016/j.jocs.2016.01.001
30. Kaur H, Kumari V. Predictive modelling and analytics for diabetes using a machine learning approach, Applied Computing and Informatics 2018.
doi:10.1016/j.aci.2018.12.004
31. Santhanam T, Padmavathi MS. Application of K-Means and genetic algorithms for dimension reduction by Integrating SVM for diabetes diagnosis. Procedia Computer Science 2015;47:76-83.doi:10.1016/j.procs.2015.03.185
32. Dzulkalnine MF, Sallehuddin R. Missing data imputation with fuzzy feature selection for diabetes dataset. Sn Applied Sciences 2019;1:362.
doi:10.1007/s42452-019-0383-x
33. Patil BM, Joshi RC, Toshniwal D. Hybrid prediction model for type-2 diabetic patients. Expert Systems with Applications 2010;37:8102-8.
doi:10.1016/j.eswa.2010.05.078
34. Maniruzzaman M, Rahman MJ, Al-MehediHasan M, Suri HS, Abedin MM, El-Baz A, et al. Accurate diabetes risk stratification using machine learning: role of missing value and outliers. J Med Syst 2018;42:92.
doi:10.1007/s10916-018-0940-7
Cognitive Informatics and Cognitive Computing (ICCI*CC), 2018. pp. 195-201.doi:10.1109/ICCI-CC.2018.8482040
36. Xie J, Gao H, Xie W, Liu X, Grant PW. Robust clustering by detecting density peaks and assigning points based on fuzzy weighted K-nearest neighbors. Information Sciences 2016;354:19-40.doi:10.1016/j.ins.2016.03.011
37. Acuna E, Rodriguez C. The treatment of missing values and its effect on classifier accuracy. Classification, Clustering, and Data Mining Applications 2004;639-47. doi:10.1007/978-3-642-17103-1_60