Strojniški vestnik - Journal o f Mechanical Engineering 54(2008)1, 11-24 UDC 621.83.052
Paper received: 10.7.2006 Paper accepted: 19.12.2007
Vibration Analysis to Determine the Condition of Gear Units
Aleš Belšak* - Jože Flašker
University o f Maribor, Faculty o f Mechanical Engineering, Slovenia
The use o f the most up-to-date production technologies and a high level o f production stability without any unscheduled outages are o f utmost importance; they are affected primarily by monitoring the condition and by adequate maintenance o f mechanical systems.
Life cycle design o f machines and devices is nowadays gaining ground rather quickly; users want that machines and devices operate with a high level o f accuracy and reliability and with as few outages as possible. Thus, by monitoring the condition, not only the presence o f changes but also predictions related to the type and size o f damage or error jeopardising the high quality o f operation during the remaining life cycle o f a machine is established.
© 2008 Journal o f Mechanical Engineering. All rights reserved.
Keywords: gear units, fault detection, vibration analysis, probability analysis, operation reliability
0 INTRODUCTION
L ife cycle desig n rep resen ts a m odern approach in relation to designing machine parts and stru c tu re s th a t u n d erg o dy n am ic lo ad s. The trad itio n al desig n is based on com paring the working stress with the permissible stress, whereas life cycle design is based on defining the number o f loading cycles N that a mechanical part will endure at a specified loading o.
D am ages cau sed to m achine parts and structures that are under dynamic load are referred to as fatigue failures. If compared to machine parts under static load, damages are caused to machine parts under substantially low er dynamic loads, however, only after a certain number o f loading cycles N. Generally, the stages o f fatigue process caused to m aterials o f m achine parts [1] are as follows:
• microcrack initiation, • short crack propagation, • long crack propagation, • damage formation.
In relation to engineering analysis, the first two stages are usually dealt with as crack initiation, whereas the second two stages are dealt with as crack propagation. The life cycle o f a machine part (the num ber o f loading cycle N before the final damage is formed):
N = N i + N p (1)
N is the number o f loading cycles prior to crack initiation, and A stands for the number of loading cycles betw een the initial and the critical crack length, i.e. till final damage is formed.
During fatigue process, it is usually difficult to define precisely the borderline between fatigue cra c k in itia tio n and p ro p ag atio n . The crack initiation stage represents the major part o f a life cycle (usually above 90%) in relation to small loads (as a rule, substantially below proof stress) (Fig. 1). By increasing the load, the crack initiation stage d e c re a se s , w h ereas crack p ro p a g a tio n stage increases.
Fig. 1. Schematic presentation o f damage formation in relation to a machine part [3]
The appearance o f fracture surface (e.g. fracture o f the axis in Fig. 2) is typical o f a fatigue damage. Initial crack propagates from the peak o f transverse section into the interior, which is clear also from a relativ ely sm ooth fracture surface
(permanent fracture). A fter a certain num ber o f loading cycles N when the crack length becomes critical, the rem aining transverse section breaks instantaneously (instant fracture).
1 ESTABLISHING THE CONDITION BY
M EANS OF TIME-FREQUENCY ANALYSIS OF VIBRATIONS
The objectives o f m aintenance are to detect, control and foresee the condition as well as to avoid an d re p a ir any d am ages w ith the p u rp o se to m aintain the characteristics o f a technical system at the most favourable or still acceptable level o f operation.
M aintenance is associated w ith assessing the condition o f a technical system on the basis o f collecting, analysing, comparing and processing data, acquired by means o f different methods. In relation to this it is possible to reduce maintenance costs, improve operation reliability and reduce the frequency and complexity o f damages. W ithout the capability o f collecting precise data and w ithout adequate data processing it is impossible to control mechanical systems.
Gear units are the m ost frequent machine parts or couplings. They are o f different types and sizes, and consist o f a housing, toothed wheels, bearings and a lubricating system. The majority o f d u ra b le d a m ag es in g e a r u n its re s u lt fro m geometrical deviations or unbalanced component parts, material fatigue, caused by the engagement o f a gear pair, or by damages o f roller bearings.
M odem m onitoring o f the condition o f a mechanical system is primarily associated with the
initiation crack
(brittle) fracture
instant (ductile)
fracture
methods o f measuring vibrations which is the most suitable way to acquire data on a gear unit. Values obtained by measurements are then additionally analysed, using adequate tools; at the same time features indicating the presence o f damages and faults are defined.
A gear unit is a set o f elements enabling the transmission o f rotating movement; it represents a complex dynamic model. In spite o f its complexity, its movement is usually periodic, and faults and damages represent a disturbing quantity or impulse. The disturbance is indicated by local and time changes in v ib ratio n signals, therefore, tim e- frequency changes can be expected. This idea is based on kinematics and operating characteristics.
The fa c to r th a t a ffe c ts r e lia b ility o f operation and achievement o f adequate quality of operation o f gear units m ost negatively is the presence o f cracks in gear units, this is followed by wear and tear o f teeth flanks and eccentricity caused by backlash in bearings, and errors when a sse m b lin g and m a n u fa c tu rin g g e a r u n its. Monitoring the condition on the basis o f measured v ib ra tio n s is th e m o st fre q u e n t m e th o d fo r determining the condition o f a gear unit. It is usually attempted to determine deviations from reference values on the basis o f a frequency spectrum. A gear u n it is a co m p le x m e c h a n ic a l sy stem w ith changeable dynam ic reactio n s, therefore it is im p o ssib le to e s ta b lis h m o d ific a tio n s o f a frequency com ponent in time, consequently, the approach based on time-frequency methods is more appropriate.
Frequency analysis is a tool very commonly used in diagnostics, however, it may well be stated that good results are obtained only in relation to periodical processes without any local changes. As a consequence o f the presence o f a damage or fault, dynam ic p a ra m e te rs o f a m ech an ical system c h an g e, w h ic h is re fle c te d in the fre q u e n c y spectrum. Monitoring frequency reaction is one of the most common spectral methods used with the purpose to establish the condition o f a gear unit. In re latio n to classical frequency analysis, tim e d e sc rip tio n o f v ib ra tio n is tra n sfo rm e d into frequency description, changes within a signal are averaged within the entire time period observed. Therefore, local changes are actually lost in the average o f the entire function o f vibrations. As a consequence, identification o f local changes is very difficult or impossible.
Time-frequency analysis represents a more thorough approach as it eliminates deficiencies mentioned above - local changes that deviate from the g lo b al p e rio d ic a l o sc illa tio n are nam ely expressed with the appearance or disappearance of individual frequency components in a spectrogram. Thus, a signal is presented simultaneously in time and frequency.
In signals related to technical diagnostics, individual frequency components often appear only occasionally. Classical frequency analysis o f such signals does not indicate when certain frequencies appear in the spectrum . The purpose o f time- frequency analysis is to describe in what way frequency components o f transient signals change with time and to determine their intensity levels.
Fourier, adaptive and wavelet transforms, and Gabor expansion are representatives o f various time-frequency algorithms. The basic idea o f all linear transforms, including Fourier transform, is to carry out comparison with elementary function determ ined in advance. By m eans o f various elementary functions, different signal presentations are obtained.
On the basis o f previous research results [5], the applicable value o f a windowed Fourier transform for evaluating the condition o f gear u n its h as b e e n e s ta b lis h e d , a lo n g w ith its shortcomings, w hich have required the use o f a more advanced signal analysis method, such as adaptive transform.
2 ADAPTIVE METHOD RELATED TO VIBRATION ANALYSIS
Adaptive transform o f a signal was, to a large extent, enhanced and concluded by Qian [6] although m any au th o rs had been developing algorithms without interference parts that reduce usability o f individual transforms as opposed to C o h en ’s class. The entire p resentation o f the following adaptive method is based on [6],
A d ap tiv e tra n sfo rm o f a signal x(t) is expressed as follows:
* ( 0 = X 5 , A ( 0 (2),
p
w here analysis coefficients are determ ined by means o f the following equations:
/ V i
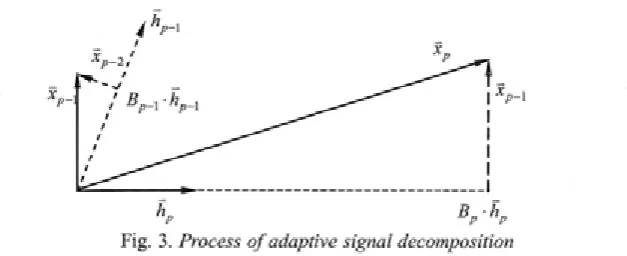
Fig. 3. Process o f adaptive signal decomposition
expressing similarity between the measured signal
x(t) and elementary functions h /t) o f transform. In F ig u r e 3, th e p ro c e ss o f a d a p tiv e sig n a l decom position is presented.
The original signal represents the starting point w ith parameter values p=0 and x0(t)=x(t). In the set o f desired elem entary functions, h /t) is search ed for that is m ost sim ilar to x g(t) in the follow ing sense:
| v | 2 = max
hp \ { x P(O ’ V (0 )f
(4).
for /> = 0. The next step is associated w ith the calculation o f the remaining x ft)
x P+i ( t ) = xp ( t ) - B p - hp ( t ) ( V
W ithout giving up the generalisation idea,
h /t) is to have a unit o f energy representation o f a signal. Therefore:
level and the rest Bp. If this process is continued, the result is as follows:
I K 0 l f = È N 2
(9)-p=o
T h is is an e q u a tio n re la te d to e n erg y conservation and it is similar to Parseval’s relation in the Fourier transform.
The result o f using Wigner-Ville distribution for both sides o f the Equation (2), and organising equations into two groups is as follows:
Pwyx(t,C i) = 'Pwyhp + ' Bq * Brr {^p’^q )(*>® )
P P*<t
(10). The first group represents elementary signal components, whereas the second one represents cross interference terms.
Due to the relation described in (9) and the given value o f energy conservation, it is evident that:
I M 'f 'i
<6)-The energy contained in the remaining signal:
M o f H M o f - H
2
v»-The Equation (5) is repeated to find h /t) that w o u ld s u it b e s t x f t ) , e tc. In e a c h step one elem entary function h /t) that suits best x / t ) is fo u n d . T he m ain ob jectiv e o f ad ap tiv e signal re p re s e n ta tio n is to fin d a set o f ele m e n ta ry functions {h /t)} that are m ost sim ilar to tim e- frequency structure o f a signal, and at the same time satisfy Equations (2) and (3).
I f Equation (6) is expressed as:
I M o f = l k + i ( 0 | 2 + N 2
it indicates that the remaining energy o f a signal at pth level can be determined on the basis oi'p + 1
v v
JJX
v v
M
v ü m m
(n>-^ ™ p*<]
This is the reason that a new time-dependent adaptive spectrum can be defined as:
*W(*.®) = X W
Pwrhpitqto)(12)-p
As this is an adaptive spectrum based on re p re s e n ta tio n s it is re fe rre d to as a d a p tiv e spectrogram. It includes no interferences and no cross terms - in this respect, it differs from Wigner- Ville distribution, and it also satisfies the condition related to energy conservation.
\\x ( t i = j ^ - \ \ pADT{t,co)-dt-dco (13).
frequency modulated prototype window function
w(t). In relation to wavelets, elementary functions are obtained on the basis o f scaling and shifting o f a m other w avelet y/(r). In these two examples, structures o f elementary functions are determined in ad vance. E le m e n ta ry fu n ctio n s re la te d to adaptive representation are rather demanding.
Generally speaking, adaptive transform is in d e p e n d e n t fro m th e c h o ice o f ele m e n ta ry functions h (t) as it permits arbitrary elementary functions.
As a rule, elementary functions, used for adaptive representation o f a signal with equation (2) are very general. In practice, however, this is n o t alw ays the case. In o rd er to stress tim e d ep e n d e n c e o f a sig n a l, it is d e sira b le th a t elementary functions are localised in regard to time and frequency. They also have to be able to use the presented algorithm in a relatively simple way. A Gauss type signal has very favourable features and it is considered a basic choice in relation to adaptive representation. It is expressed as follows:
h p ( t ) =
/ \°.25
S '
7r
v
y
■e rilp" (14),
where ( T, £2p) is a tim e-frequency centre o f an elem entary function, w hereas ap ' stands for a variance o f Gauss function at ( T, Q ).
The variance, acquired by m eans o f the ordinary Gabor transform, is stable, in (13) it is adaptive. Gauss functions, normally used in the ordinary G abor transform , are located at fixed p o in ts (mT, nQ) o f tim e and frequency grid, whereas the centres o f elementary functions in ( 13) are not fixed and can be located anywhere. The a d a p ta tio n o f th e v a ria n c e v a lu e can m ake e le m e n ta ry fu n c tio n s lo n g e r o r sh o rte r; the adaptation o f parameters ( T , Q ) changes time and fre q u e n c y c e n tre s o f e le m e n ta ry fu n c tio n s. Adapting both variance and time-frequency centres resu lts in in creased su itab ility o f local tim e- frequency features o f the signal x(t).
Wigner-Ville distribution o f time-frequency density o f adaptive Gauss functions is expressed as:
Pyyyh {t,m ) = 2 -e
v K C > -n „ )2 (15).
The function o f time-frequency density o f the adaptive Gauss function forms an ellipse with the centre at (T^ Q j. The energy concentration o f
Gauss functions is an optimum one. By means of Gauss functions o f various variances and o f a different time-frequency centre, the local behaviour o f each analysed signal x(t) is characterised by the Gauss function. If the signal features rapid time change, the Gauss function with a small variance value suitable for the sudden change has to be applied. If stable frequency over a longer period o f time is typical o f the signal, the Gauss function with greater variance value is to be used.
By entering (14) into (2), the following equation is acquired:
c( 0 = X V M 0 = 5 X
\0,25
e-ja' ‘
(16).
This is adaptive Gabor transform, which resembles an ordinary Gabor transform.
The ad aptive tran sfo rm has the same functions o f analysis and synthesis, which makes it different from the Gabor transform . W hen the optimum function o f synthesis hp(t) is achieved, it is possible to calculate adaptable coefficients Bp, on the basis o f ordinary operation o f internal product:
B p = j x p t ‘ ) h ' p ( ‘ ) d t
( 17),
w hich guarantees that local signal behaviour is really expressed by Bp.
By entering (15) into ( 12), a Gauss adaptive spectrogram, which is based on the function, the following equation is produced:
PADt( j - i 2 - ^ | . ß p | -e
o c „ { t - T p )
(18).
As tim e-frequency resolutions o f Gauss function are determined by one parameter a , it is relatively easy to calculate optimum h (t). Thus, it is relatively easy to calculate adaptive G abor expansion when elementary functions {hp(t)} are determined. There is, however, a question regarding the choice o f elem entary functions {hp(t)}. As already mentioned before, hp(t) should suit xp(t) best in the sense of Equation (4), where Gabor function determined in Equations (14) and (4), represents the optim um solution in regard to (ap, Tp, Qp).
T h e p ro c e s s o f c a lc u la tin g a d a p tiv e spectrogram begins in a w ide tim e range o f a measured signal. Then the range has to be reduced, depending on what is wanted to be achieved. As F ourier integral is included in the elem entary operations o f searching for a suitable elementary function, the described calculation process is very effective [7], The accu racy o f approxim ation depends primarily on the size o f time-frequency interval. The narrower the intervals are, the better is the accu racy o f re p resen tatio n , along w ith in c re a s e d tim e o f c a lc u la tio n . T h e re fo re a c o m p ro m ise b e tw e e n the a c c u ra c y o f approximation and the efficiency has to be found.
3 SIGNAL RESAMPLING PROCEDURE FOR LIMITED SPEED FLUCTUATION
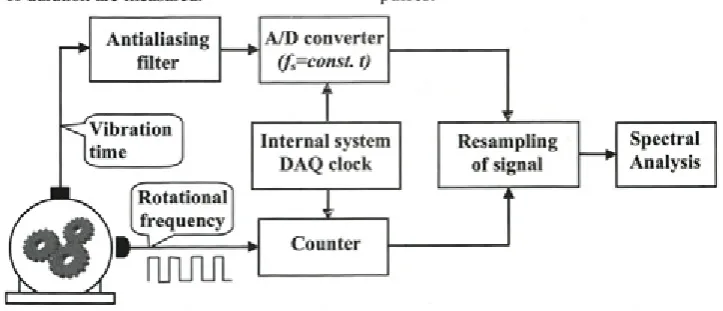
Vibration measuring can represent measuring o f a dynamic quasi periodical signal as the gear consists o f rotating elements (shafts with gears and bearings). This represents complex repeated rotating movements. The information obtained by measuring the rotation speed, making it possible to follow the stability o f rotation speed during the measuring, is important for the frequency analysis [8]. During measuring, rotation speed can oscilate, even more so when gears are used in machines, which are under load. This results in an unreliable frequency spectrum, which is even more expressed in case o f frequency analysis of higher harmonics; additional sidebands namely appear. In relation to time-frequency analysis it is also more adequate to assess the results on the basis o f stable rotation frequency [9]. By following the rotation speed signal (TTL signal), the beginning and the end o f rotations are located and their length and time o f duration are measured.
There are two techniques for producing sy n c h ro n o u sly sam p led data; the tra d itio n a l approach w hich uses sp ecialised hardw are to dynamically adapt the sample rate and a technique where the vibration signals and a tachometer signal are asynchronously sam pled, that is, they are sampled conventionally at equal time increments (F ig. 4). F rom th e a s y n c h ro n o u sly sam p led tachom eter signal re-sam ple tim es required to produce synchronous sampled data are calculated. In this paper, analysis o f rotation frequency stability and, if required, suitable resampling are carried out prior to each analysis.
R ecen tly , th e re has b e e n in te re s t in calculating synchronous sam pled signals from asynchronously sampled data. Both the vibration signals and tachometer are sampled at constant time intervals, that is, asynchronously. From these signals, synchronously sampled vibration data is synthesised in a computer code.
A computed re-sampling system is generally based on two stage algorithm: the tachometer pulse trigger, with angle evaluation procedure and the signal interpolation. Tachometer determines when the edge o f the pulse arrives. From these timings the angular m otion o f the shaft is resulting in resam ple tim es. The asynchronously sam pled vibration signal is interpolated and re-sampled at these times thus producing synchronously sampled data.
To calculate re-sam ple tim es at constant angular increments, the angular motion o f the shaft has to be estimated from the tachometer pulses. In the first instance constant angular speed may be assum ed, w hich results in linear interpolation between the shaft angle at consecutive tachometer pulses.
To p roduce the d esired synchronously sampled signal, the value o f the vibration signal must be estimated at the re-sample times.
L inear evaluation is the sim plest signal interpolation method. This approach is adequate for signals with slow oscillation rotation speed.
B-spline evaluation is the most useful signal interpolation method which produces a pth-order piecewise polynomial fit to the data. The method is especially interesting because up to the (p - l)th derivative o f the resulting signal is continuous. Using the weighted sum o f B-spline basis functions, the signal is approximated. In the analysis cubic B -sp lin e e v a lu a tio n is used, g iv in g good interpolation flexibility and appropriate basis functions.
A piecew ise polynom ial fit to the data samples is obtained through Lagrange interpolation (a spline interpolation method) [10]. A pth-order polynomial is usually used to fit (p + 1) data points; this is, however, limited with the condition that the polynomial passes through every sample. Piecewise polynomial signals are created by interpolation; the derivatives across the boundaries (at the sample points) are not constrained to be continuous, which
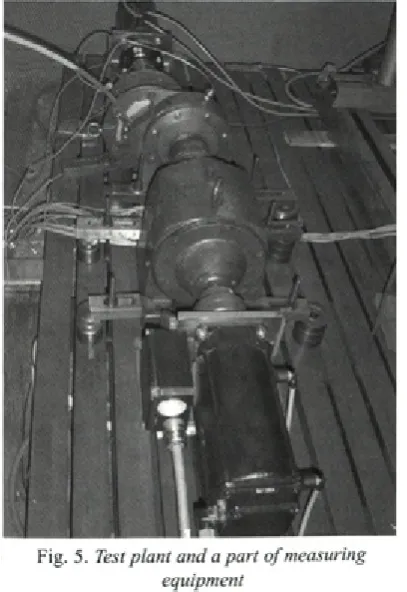
Fig. 5. Test plant and a part o f measuring equipment
is different from B-spline interpolation. Using the latter one (i.e. B-spline interpolation), a more original signal is actually created. The presented method is successfully applied in relation to the change in rotation frequency by 2%.
The trend of rotation speed oscillation and its stability being observed contribute to a more precise and clearer spectrogram, even to a larger extent with high harmonics and their side frequencies.
4 PRACTICAL EXAMPLE
All the measures have been carried out in the test plant o f the C om puter A ided D esign L ab o rato ry at the F acu lty o f M e ch an ical Engineering, University of Maribor. The test plant is presented in Figure 5, with a one-stage helical gear unit at the spot where vibration measurements have been carried out.
Som e changes have been cau sed to a standard gear unit with the purpose to (artificially) produce faults and damages in a gear couple and to adapt some design-related features to the test plant. Simultaneously, appropriate measurements o f vibration accelerations have been carried out - they serve as a tool for determining the presence o f individual changes in a gear unit. As the method o f determining the condition o f a gear unit is based on comparing the measured signal o f a faultless gear unit with the signal o f a faulty gear unit, a faultless and faulty gear units were tested.
A sin g le stage g ear u n it E Z 5 .B 3 .1 3 2 produced by “Strojna tovarna” in M aribor was tested. Into the gear unit, a helical gear unit with straight teeth was integrated. A m ore detailed description and technical documentation of the gear unit are in [5],
Measures o f a gear unit with a fatigue crack in the tooth root o f a pinion were carried out, under operating conditions that w ould be norm ally associated with this type of a gear unit. A ground gear pair with a crack is a standard gear pair, with the teeth quality 6, but with the presence of a crack in the tooth root of a pinion; it is presented in Figure 6.
The length o f the crack in Figure 6, the presence o f which can be observed on one o f the teeth, is 4.8 mm. The whole measurement process and preparations for analysis are described in [5].
Fig. 6. Pinion with a crack in the tooth m ot
package, and tested and evaluated on the basis o f a certain number o f basic mathematically generated signals [11].
Adaptive transform was used to determine the presence o f a crack in the tooth root. In relation to adaptive spectrogram, adaptive representation for signal decom position, prior to W igner-Ville distribution, was used. Additionally, only the sum o f W ig n e r-V ille d is trib u tio n o f b a sic sig n al components was taken into account, whereas cross interference terms were completely ignored.
Adaptive spectrogram has a fine adaptive time-frequency resolution because the features o f elementary functions are limited. Time-frequency
resolution o f the transform is, therefore, adapted to signal characteristics. As an elementary function, Gauss function (impulse) and linear chirp with Gauss window can be used. If a signal is composed o f linear chirps that are the consequence o f a linear change in the rotation frequency o f a gear unit, an adaptive spectrogram can be applied to establish in what ways a possible frequency modulation is reflected in the time-frequency domain. A possible presence o f non lin ear frequency m o d u latio n m ay rep resen t a problem as a spectrogram may include a certain level o f distortion because adaptive representation is approaching non-linear modulation in the form o f a linear combination o f chirps with linear frequency
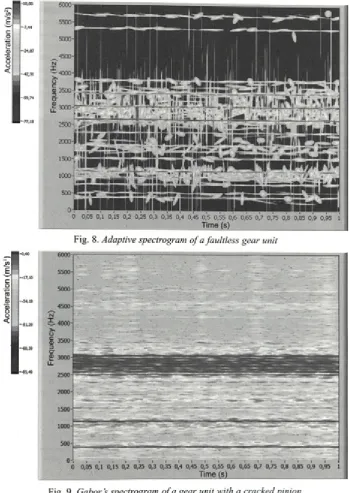
Fig. 8. Adaptive spectrogram o f a faultless gear unit
Fig. 9. Gabor s spectrogram o f a gear unit with a cracked pinion
m odulation. The tim e required for transform calculation increases, along with the increased amount o f data and the number of cycles necessary to search for an adequate elementary function.
The signal o f measured values was 1 s long and composed of, on an average, 12500 measuring points. Rotation frequency was 20 Hz at the time of measurement. The number of teeth o f the pinion was 19, and o f the gear u nit 34. For com parison,
spectrograms related to Gabor and window Fourier transforms are presented, with the length o f the window being 700 points, which is 10% more that the length o f the period o f one rotation o f a gear couple.
In Figure 7, Gabor spectrogram is presented; no rhythmic pulsation o f harmonics can be observed, with the exception o f typical frequencies, determined on the basis o f pow er spectrum . In relation to adaptive spectrogram (Fig. 8), featuring a higher level o f energy accumulation in the origins, some pulsation sources are indicated but they are not very expressed. It is particularly interesting to monitor the increase or decrease (complete disappearance)
in appropriate frequency components with rotation frequency o f 20 Hz. This phenomenon is typical o f the 3rd harmonic, 1530 Hz is expressed only in relation to the presence o f a crack. The phenomenon is much more expressed in the adaptive spectrogram (Fig. 10) than in the Gabor spectrogram (Fig 9). In Figure 10, pulsation (the area, m arked w ith a continuous line) is expressed reflecting a single engagement of a gear couple with a crack within
Fig. 10. Adaptive spectrogram o f a gear unit with a cracked pinion
2.5-
2
1.5-
1-03 0,5- o O
0-C/)
1
c o to V— 03 0) o o <
A .______
-- __A__fi ... ... /IS——
IQ
S'
6-
4-2
0-a)
1000 2000 3000 4000
Frequency [Hz]
5000 6000 7000
I
b )
1000 2000 3000 4000
Frequency [Hz]
5000 6000 7000
one rotation o f a shaft. Similarly, between the 6th and the 9th harmonics (area marked with a dashed line) rich with sources indicating pulsating portions o f individual components with the frequency o f 20 Hz.
The spectrogram evaluation can be based on an average spectrogram representing an amplitude spectrum o f a Fourier or adaptive transform of a m easu red signal and by observing pulsating frequencies o f individual frequency components.
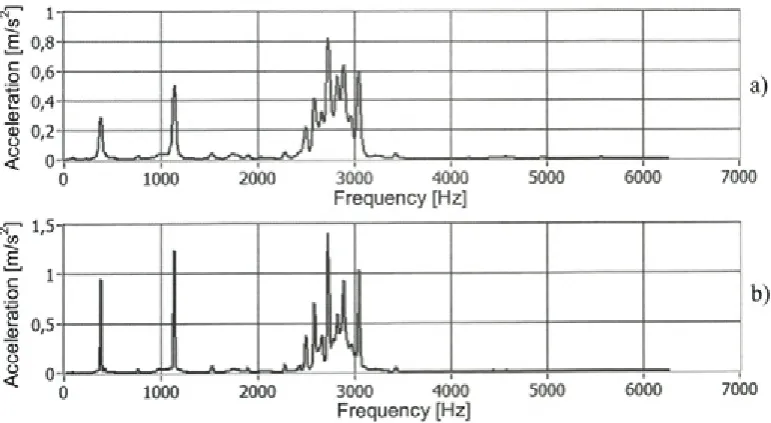
In Figure 11, average frequency spectres of spectrogram s o f v ib ratio n s p roduced by the faultless gear unit are presented. It is evident that the greatest average values are achieved at the 6th, 7th, 2nd and 8th harmonics. The Figure indicates a larger w idth o f a frequency com ponent round individual harmonics, which is more expressed in relation to the Gabor transform, whereas in relation to the adaptive transform the concentration o f frequency components is very distinguished.
Table 1. Amplitudes and frequencies o f the pulsation o f harmonics in relation to the average Gabor spectrogam o f vibrations o f the faultless couple o f gears with ground surface teeth
h f [Hz] Apos [m/s ] fmi THzl f«2 rHzi fut3 THz]
0 379.175 0.116 1.998 4.994 10.987
1 758.350 0.044 8.989 10.987 1.998
2 1137.524 0.651 10.987 8.989 2.996
3 1516.699 0.151 10.987 0.999 7.990
4 1895.874 0.093 1.998 10.987 0.999
5 2275.049 0.103 0.999 5.993 6.992
6 2654.224 2.080 1.998 12.984 3.995
7 3033.398 0.917 1.998 0.999 12.984
8 3412.573 0.436 2.996 0.999 10.987
9 3791.748 0.068 10.987 0.999 9.988
10 4170.923 0.006 10.987 5.993 1.998
11 4550.098 0.005 2.996 8.989 6.992
12 4929.272 0.006 3.995 2.996 1.998
13 5308.447 0.027 10.987 9.988 12.984
14 5687.622 0.036 10.987 9.988 0.999
15 6066.797 0.002 6.992 3.995 4.994
Table 2. Amplitudes and frequencies o f the pulsation o f harmonics in relation to the average adaptive spectrogram o f vibrations o f the faultless couple o f gears with ground surface teeth
h f [Hz] Aoos [m/s2] cT^ X , N. f
„,2
[Hzl fun THzl0 379.175 0.271 11.011 14.015 1.001
1 758.350 0.088 11.011 9.009 20.021
2 1137.524 1.363 11.011 7.007 10.010
3 1516.699 0.216 11.011 8.008 20.021
4 1895.874 0.086 11.011 12.012 1.001
5 2275.049 0.082 9.009 11.011 10.010
6 2654.224 0.670 5.005 11.011 3.003
7 3033.398 0.551 11.011 2.002 9.009
8 3412.573 0.129 9.009 11.011 1.001
9 3791.748 0.053 20.021 11.011 9.009
10 4170.923 0.001 152.158 54.056 103.107
11 4550.098 0.001 131.136 128.133 132.137
12 4929.272 0.001 7.007 20.021 6.006
13 5308.447 0.007 11.011 20.021 2.002
14 5687.622 0.009 11.011 20.021 22.023
In T ables 1 and 2, the a m p litu d e s o f individual harm onics along with corresponding frequencies are shown. In addition, dom inating fre q u e n c ie s o f th e p u ls a tio n o f in d iv id u a l h a rm o n ic s are in d ic a te d , w h ic h m ak es the evaluation o f changes in frequency components over a period o f time easier.
In F ig u re 12, the v ib ra tio n s o f the 3rd harm onic over a period o f time are shown; it has b e e n e s ta b lis h e d th a t it is v e ry su ita b le fo r observing the pulsation in relation to all types o f ir r e g u la r itie s ; it is e v id e n t th a t e x p re s s e d
pulsations (rhytmic changes) are not present. The frequency, which is also present, is 11 Hz and it represents rotation speed o f the gear unit, whereas other parts o f frequency com ponents are much lower.
In Figure 13, average spectrograms o f the vibrations o f a gear unit are presented, on the basis o f which it is clear that the greatest average values are associated with the 6th and 7th harmonics as well as w ith the 2nd harm onic and w ith the meshing frequency. Very expressed sideband frequencies are associated only w ith the 6th and 7th harmonics,
Fig. 12. Time presentation o f the 3rd harmonic (1516.7 Hz) o f the spectrogram o f vibrations o f the faultless couple o f gears with ground surface: a) Gabor and b) adaptive
which is typical when a crack is present. In addition to that, the figure shows a larger width o f frequency components round individual harmonics, which is particularly expressed in relation to the window Gabor transform, whereas in relation to the adaptive transform, the concentration is much larger round harmonics.
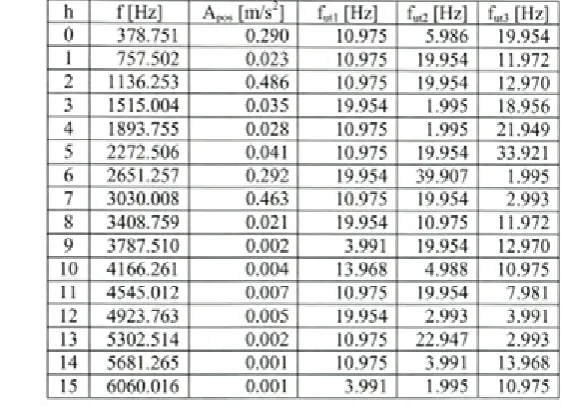
Tables 3 and 4 show amplitudes o f individual harmonics with corresponding frequencies, along with dominating frequencies o f the pulsation of
individual harmonics. Thus, pulsating frequencies are chan g ed and the p u lsa tio n o f ro ta tio n frequencies of the shaft of the pinion (19.96 Hz) and of the gear (10.98 Hz) are dominant. Partial frequencies and higher harmonics of the rotation frequencies o f both shafts appear as well. The pulsation o f the 3rd harmonic (Fig. 14) is particularly interesting; it is very clear and periodic (20 Hz) and it appears only in relation to the couple o f gears with a crack in the tooth root.
Table 3. Amplitudes andfrequencies o f the pulsation o f harmonics o f an average Gabor spectrogram o f the vibrations produced by a couple o f gears with a crack
h f[H zl Apos [m/s ] futi THzl fu,2 THzl fut3 ["Hzl
0 378.751 0.290 10.975 5.986 19.954
1 757.502 0.023 10.975 19.954 11.972
2 1136.253 0.486 10.975 19.954 12.970
3 1515.004 0.035 19.954 1.995 18.956
4 1893.755 0.028 10.975 1.995 21.949
5 2272.506 0.041 10.975 19.954 33.921
6 2651.257 0.292 19.954 39.907 1.995
7 3030.008 0.463 10.975 19.954 2.993
8 3408.759 0.021 19.954 10.975 11.972
9 3787.510 0.002 3.991 19.954 12.970
10 4166.261 0.004 13.968 4.988 10.975
11 4545.012 0.007 10.975 19.954 7.981
12 4923.763 0.005 19.954 2.993 3.991
13 5302.514 0.002 10.975 22.947 2.993
14 5681.265 0.001 10.975 3.991 13.968
15 6060.016 0.001 3.991 1.995 10.975
Table 4. Amplitudes and frequencies o f the pulsation o f harmonics o f an average adaptive spectrogram o f the vibrations produced by a couple o f gears with a crack
h f[H zl Apos [m/s ] futi [Hzl f»u [Hzl fit3 [Hzl
0 378.751 0.950 11.027 6.015 5.012
1 757.502 0.039 11.027 2.005 10.025
2 1136.253 1.238 11.027 2.005 13.032
3 1515.004 0.032 20.050 40.099 2.005
4 1893.755 0.028 11.027 5.012 2.005
5 2272.506 0.055 11.027 20.050 2.005
6 2651.257 0.289 20.050 8.020 5.012
7 3030.008 0.289 12.030 6.015 11.027
8 3408.759 0.010 20.050 11.027 2.005
9 3787.510 0.001 78.194 68.169 156.387
10 4166.261 0.001 78.194 156.387 68.169
11 4545.012 0.002 11.027 4.010 7.017
12 4923.763 0.001 9.022 10.025 23.057
13 5302.514 0.001 91.226 19.047 74.184
14 5681.265 0.001 91.226 78.194 169.420
a)
b )
Fig. 14. Time presentation o f the 3rd harmonic (1515 Hz) o f the spectrogram o f vibrations o f a couple o f gears with a crack in the pinion: a) Gabor and b) adaptive spectrograms
5 CONCLUSION
Fault detection, presented in this paper, in relation to industrial gear units is based on vibration analysis; it increases the safety o f operation and, consequently, o f monitoring operational capabilities.
Appropriate spectrogram samples and a clear presentation o f the pulsation o f individual frequency components that, in addition to the average spectrum, represent a criterion for assessing the condition o f a gear unit make it possible to monitor life cycle o f a gear unit more reliably. Adaptive time-frequency representation represents, above all, a reliable prediction as the representation is clearer, without increased dissemination o f signal energy into the surroundings.
In relation to the life cycle design o f machine parts and structures, it is therefore possible, by using an adequate method or criterion, to monitor the actual condition o f a device and o f its vital components that can affect its operational capability considerably. By detecting faults or damages, the reliability o f operation is controlled to such an extent that the probability and reliability o f detecting faults make a positive contribution related to the prediction o f the remaining life cycle o f a gear unit.
6 REFERENCES
[1] Suresh S. Fatigue o f materials, Cambridge University Press, 1998.
[2] B u ch A. F atigue strength calculation.
Aederm annsdorf: Trans Tech Publications, 1988. 467 p. ISBN 0-87849-536-3
[3] Stephens R.I., Fatemi A., Stephens R.R, Fuchs H.O. Metal fatigue in engineering, 2nd ed. New York: John Wiley & Sons Inc., 2001.472 p. ISBN 0-471-51059-9
[4] Fe-safe Works, Users Manual, 2003.
[5] Belšak A. Development o f gear unit failure detection system, M aster thesis. University o f Maribor, Faculty o f Mechanical Engineering, 2004. (In Slovenian).
[6] Q ian S ., C hen D. J o in t tim e-frequency analysis. New Jersey: Prentice Hall, 1996.302 p. ISBN 0-13-254384-2.
[7] F la d rin P. T im e-frequency/Tim e-scale analysis. San Diego: Academic Press, 1999. 386 p. ISBN 0-12-259870-9.
[8] Mertins A. Signal analysis. New York: John Wiley & Sons Inc., 1999. 317 p. ISBN 0-471- 98626-7
[9] Bendar J.S., Piersol A.G. Random data, 3rd ed. New York: Willey, 2000. 594 p. ISBN 0- 471-31733-0
[10] Rohatgi V.K., Saleh A.K. An intruduction to propability and statistics. John Willey & Sons,
2001.
![Fig. 2. Appearance o f fatigue fracture surface of an axis [4] and a gear tooth](https://thumb-us.123doks.com/thumbv2/123dok_us/8954093.1863461/2.482.48.389.42.227/fig-appearance-fatigue-fracture-surface-axis-gear-tooth.webp)