* The author would like to thank two anonymous referees for their useful comments and suggestions. This article belongs to a special issue of Financial Theory and Practice, which is devoted to the comparison of tax wedge on labour income in Croatia and other EU countries. The articles in this issue have arisen from the students’ research project, undertaken in 2015. The Preface to the special issue (Urban, 2016) outlines the motivation behind the research project, explains the most important methodological issues, and reviews the literature on the measurement of tax wedge in Croatia.
** Received: January 31, 2016 Accepted: March 31, 2016 Marin ONORATO
e-mail: marin.onorato@gmail.com
Tax wedge in Croatia,
Austria, Hungary,
Poland and Greece
MARIN ONORATO, mag. math*
Preliminary communication** JEL: H21, H24, J38
marin
onora
to
tax
wedge
in
croa
tia
,
austria
,
hungar
y
,
poland
and
greece
financial
theor
y
and
practice
40 (2) 265-288 (2016)
266
abstractThe aim of this paper is to compare the tax burden on labour income in Croatia, Austria, Greece, Hungary and Poland in 2013. The Taxing Wages methodology has been applied to hypothetical units across a range of gross wages in order to calculate net average tax wedge, net average tax rate, as well as other relevant indicators. When it comes to single workers without children, the smallest tax wedge for workers earning less than the average gross wage was found in Croa-tia, while Poland had the smallest tax wedge for above-average wages. Due to a progressive PIT system, the tax wedge for a single worker in Croatia reaches 50% at 400% of the average gross wage, equalling that of Austria, Greece and Hun-gary. Tax wedges for couples with two children show a similar trend.
Keywords: tax burden, tax wedge, average tax rate, personal income tax, social insurance contributions, Croatia, Austria, Hungary, Poland, Greece
1 IntRoDUctIon
This paper investigates the tax burden on labour income in EU countries, looking into Croatia, Austria, Hungary, Poland and Greece. The paper offers a detailed account of the labour taxation components in those countries: personal income taxes (PITs), employer and employee social insurance contributions (SICs), and social family benefits. Additionally, the paper presents calculations of several tax burden indicators, defined in accordance with the Taxing Wages methodology, for each country. The indicators were calculated by using the author’s microsimula-tion model, which allows the computamicrosimula-tion of the amounts of taxes, contribumicrosimula-tions, and social benefits for hypothetical family units in the five countries.
The key aim of this paper is to compare the average tax burdens in the five ob -served countries for eight hypothetical family units defined in OECD (2014). In order to gain insight into the tax burden of units earning higher personal incomes, additional detailed analyses are performed on two sets of hypothetical units – sin-gle workers and couples with two children – which are allocated a relatively wide range of gross wages.
The paper is structured as follows. Section 2 introduces some basic information about the methodology used. Section 3 offers a detailed overview of the labour taxation system in the observed countries and tax burden calculations; the net average tax wedge for single workers and couples with children across a wide range of gross wages is compared in section 4, which is followed by the conclu-sion section.
2 MethoDologY
2.1 aVeRage wage
marin
onora
to
tax
wedge
in
croa
tia
,
austria
,
hungar
y
,
poland
and
greece
financial
theor
y
and
practice
40 (2) 265-288 (2016)
267
units, where adult workers are allocated gross wages equal to a percentage ofAGW. Table 1 shows 2013 AGW amounts that were used in this research.
Table 1
Annual average gross wage in selected countries, 2013
agw expressed in
national currency exchange rate (in eUR)agw
Croatia HRK 93,180 HRK/EUR = 7.5735 12,303 Austria EUR 41,693 1 41,693 Hungary HUF 2,914,514 HUF/EUR = 303.0270 9,618 Poland PLN 41,442 PLN/EUR = 4.1945 9,880 Greece EUR 20,604 1 20,604
Notes: In calculation of yearly gross wage for Austria, 14 monthly wages are taken into consid-eration, since it is common practice that employers pay Christmas bonuses and leave bonuses equal to average monthly wages.
Source: (1) AGW – for Croatia: author’s calculation as per CBS (2015) and Urban (2016); for other countries: OECD (2014); (2) Exchange rates – for Croatia: middle HRK/EUR exchange rate (CNB, 2016); for Hungary and Poland: OECD (2014).
2.2 hYPothetIcal UnIts
Hypothetical units for which indicators are calculated comprise one or two adults (couple), either without children or with two children. The composition of all eight hypothetical units is shown in table 2.
Table 2
Characteristics of observed hypothetical unit types
Designation adults number
of children (% of agw)spouse I (% of agw)spouse II
A-67-NC Single worker 0 2/3 x 100 – A-100-NC Single worker 0 100 – A-167-NC Single worker 0 5/3 x 100 – A-67-2C Single worker 2 2/3 x 100 – 2A-100/0-2C Couple 2 100 unemployed 2A-100/33-2C Couple 2 100 1/3 x 100 2A-100/67-2C Couple 2 100 2/3 x 100 2A-100/33-NC Couple 0 100 1/3 x 100
Note: The symbols stand for the following: AGW – average gross wage; A – adult; NC – no children; 2C – 2 children.
Source: OECD (2014).
re-marin
onora
to
tax
wedge
in
croa
tia
,
austria
,
hungar
y
,
poland
and
greece
financial
theor
y
and
practice
40 (2) 265-288 (2016)
268
spectively, 0, 1/3, and 2/3 of AGW. The final hypothetical unit comprises a couple without children (2A-100/33-NC), with Spouse I’s gross wage amounting to 100% of AGW and Spouse II’s wage amounting to 1/3 of AGW. The minimum wage in Croatia stipulated by the Regulation on Minimum Wage in 2013 exceeded 33% of the average gross wage; however, this has been disregarded in order to comply with the OECD model.This paper introduces two units in addition to the abovementioned eight OECD typical units: single workers without children earning between 50 and 500% of AGW and couples with two children, where the author takes into account various combinations of spouses’ wages, the family’s total gross earning thus being be-tween 100% of AGW and 500% of AGW (as an example, see figure 2).
2.3 tax bURDen InDIcatoRs
Two main tax burden indicators are used in this paper: average tax wedge and net average tax rate. Net average tax wedge is defined as the ratio of total net tax to total labour costs. Net average tax rate represents the ratio of net tax paid by the employee to gross wage.
To calculate total labour costs, total net taxes, and net taxes paid by the employee, formulas (1), (2), and (3) are used.
Total labour cost = gross wage + employer SICs
+ payroll taxes (1)
Total net tax
= personal income taxes at all levels of government + employee SICs
+ employer SICs + payroll taxes
– cash family benefits (2)
Net tax paid by the employee
= personal income taxes at all levels of government + employee SICs
– cash family benefits. (3)
In addition to the two key indicators, further two were used in the analysis: aver-age PIT rate (ratio of PIT to gross waver-age) and averaver-age employee SIC rate (ratio of employee SICs to gross wage).
marin
onora
to
tax
wedge
in
croa
tia
,
austria
,
hungar
y
,
poland
and
greece
financial
theor
y
and
practice
40 (2) 265-288 (2016)
269
not included in the analysis. For instance, the Croatian pension system rests ontwo pillars – the 1st and the 2nd. Employee SICs paid into the 1st pillar are general government revenue, while the 2nd pillar contributions are paid to mandatory pri-vate pension funds. Thus, the former plays a role in the tax burden calculation and the latter does not. For more information about this topic, see Urban (2016), Blažić and Trošelj (2012), OECD (2014, 2015).
3 oVeRVIew of laboUR taxatIon
3.1 cRoatIa
3.1.1 basic components of labour taxation in croatia
Croatian employers and employees pay five different social insurance contribu -tions – their 2013 rates are shown in table 3. The maximum SIC base, EUR 74,790, is stipulated for the 1st pillar pension insurance contributions (Order on SIC Base Amounts for 2013). No such maximum base amount has been defined for other contributions.
Table 3
SIC rates (Croatia, 2013)
contribution employee rate
(% of gross wage) (% of gross wage)employer rate
1st pillar pension insurance contributions 15.0 –
2nd pillar pension insurance contributions 5.0 –
Health insurance contributions – 13.0 Work injury contributions – 0.5 Employment contributions – 1.7 Total 20.0 15.2
Source: Social Insurance Contributions Act.
The PIT base equals the taxpayer’s gross wage minus pension insurance contribu-tions and personal allowances. Personal tax allowance is the sum of the basic personal allowance and allowance for dependent family members (table 4).
Table 4
Personal tax allowance (Croatia, 2013)
Personal tax allowance annual amount hRK eUR
Basic personal allowance 26,400 3,486 Adult dependent 13,200 1,743 First child 13,200 1,743 Second child 18,480 2,440 Third child 26,400 3,486 Fourth child 36,960 4,880 Fifth child 50,160 6,623 Partial disability allowance 7,920 1,046 Total disability allowance 26,400 3,486
marin
onora
to
tax
wedge
in
croa
tia
,
austria
,
hungar
y
,
poland
and
greece
financial
theor
y
and
practice
40 (2) 265-288 (2016)
270
Table 5 shows the range and rates of the three PIT bands in 2013.Table 5
PIT bands and rates (Croatia, 2013)
tax band (in eUR) tax rate (%)
[0, 3,486] 12
‹3,486, 13,943] 25
‹13,943, +∞› 40
Source: Personal Income Tax Act.
Local government surtax is a tax calculated as a percentage of the PIT amount. Its rates are determined by cities and municipalities. These rates were set at between 0% and 18% (for the City of Zagreb) in 2013. For the purpose of this analysis, the local government surtax rate was set at 12%, which represents, approximately, the average local government surtax rate calculated on the basis of all Croatian cities and municipalities.
Payroll taxes are not levied in Croatia. When it comes to cash family benefits, this analysis takes into account child benefits, which is a means-tested benefit for fam -ilies with children paid by the central government. Child benefit amounts depend on personal income per family member. Table 6 shows how child benefits are calculated for a family with one or two children. The benefits received by the children of a single parent increase by 15%.
Table 6
Child benefits: annual bands and amounts (Croatia, 2013)
gross personal income per family member
(eUR) Benefit amount per child (eUR)
[0, 875] 474
‹875, 1,765] 395 ‹1,765, 2,635] 316
Source: Child Benefits Act.
3.1.2 tax burden indicators
marin
onora
to
tax
wedge
in
croa
tia
,
austria
,
hungar
y
,
poland
and
greece
financial
theor
y
and
practice
40 (2) 265-288 (2016)
271
Table 7
Tax burden indicators for basic hypothetical units (Croatia, 2013), in %
a-67-nc a-100-nc a-167-nc a-67-2c 2a-100/ 0-2c 2a-100/ 33-2c 2a-100/ 67-2c 2a-100/ 33-nc
Average PIT rate 5.04 10.34 15.17 0.00 0.47 1.78 3.44 7.76 Average employee
SIC rate 20.00 20.00 20.00 20.00 20.00 20.00 20.00 20.00 Net average tax rate 20.04 25.34 30.17 6.13 10.33 16.78 18.44 22.76 Net average tax
wedge 30.59 35.19 39.38 18.52 22.16 27.76 29.20 32.95
Source: Author’s calculations.
Figures 1 and 2outline net average tax wedge and net average tax rate trends for additional hypothetical sets of single workers and couples with two children across a wide range of gross wages. The figures clearly show that the Croatian wage taxation system is progressive, i.e. that the average tax rate grows as the gross wage increases. The net average tax wedge for single workers in the ob-served wage range increases from 29% to 51%. When it comes to couples with two children the tax wedge increases up to 42% for couples with gross wages amounting to 300% and 200% of AGW. The smallest tax wedge, 22%, is observed in married couples with gross wages of 100% and 0% of AGW. One can see that the tax wedge sharply rises to 28% for the next family (with 100% and 33% of AGW), due to them not being eligible for child benefits.
Figure 1
Net average tax wedge and net average tax rate for single workers without children (Croatia, 2013), in %
50 55 60 65 70 75 85 90 95 100 110 120 130 140 150 160 170 180 190 200 220 250 300 350 400 450 500
marin
onora
to
tax
wedge
in
croa
tia
,
austria
,
hungar
y
,
poland
and
greece
financial
theor
y
and
practice
40 (2) 265-288 (2016)
272
Figure 2Net average tax wedge and net average tax rate for couples with two children (Croatia, 2013), in %
Source: Author’s calculation.
3.2 aUstRIa
3.2.1 basic components of labour taxation in austria
Table 8 shows social insurance contributions and rates in Austria. The maximum SIC base amounts to EUR 52,800 annually for the basic wage, while the ceiling for allowances is set at EUR 8,800.
Table 8
SIC rates (Austria, 2013)
contribution employee sIcs
(% of gross wage) (% of gross wage)employer sIcs
Health insurance 3.95 3.70 Unemployment insurance (a) 3.00 Pension insurance 10.25 12.55 Accident insurance – 1.40 Contribution to the labour chamber 0.50 – Contribution for the promotion
of residential building 0.50 (b) 0.50 Bankruptcy insurance – 0.55
Notes (OECD): (a) employees’ unemployment insurance rate depends on the taxpayer’s monthly earnings, making it 0% for monthly gross wages lower than EUR 1,219, 1% for wages up to EUR 1,330, 2% for monthly gross wages up to EUR 1,497, and 3% for all gross wages above EUR 1,497; (b) no contributions to the labour chamber or contributions for the promotion of residen-tial building are levied on allowances such as Christmas and leave bonus.
marin
onora
to
tax
wedge
in
croa
tia
,
austria
,
hungar
y
,
poland
and
greece
financial
theor
y
and
practice
40 (2) 265-288 (2016)
273
As can be seen above, employee SICs depend on monthly gross wages and amountto between 15.2% and 18.2% of gross income, contributions on Christmas bonus and leave bonus amount to between 14.2% and 17.2% of gross income, while employer SICs amount to 21.7% of gross income for all gross wages.
A detailed account of tax reliefs applicable to the Austrian PIT system can be found in table 9.
Table 9
PIT base reductions (Austria, 2013)
(1) Employee SICs and contributions levied on Christmas and leave bonuses: full amount
(2) Work-related allowance: EUR 132 (3) Basic annual allowance: EUR 60
(4) Child allowance: EUR 220 per child if granted to one spouse only or EUR 132 per child if the tax relief is granted to both parents (5) Christmas and leave bonus allowance: EUR 620
Source: OECD (2014).
Just like in Croatia, a progressive tax schedule is applied in Austria. Tax bands and tax rates can be found in table 10.
Table 10
PIT bands and rates (Austria, 2013)
tax band (in eUR) tax rate (%)
[0, 11,000] 0
‹11,000, 25,000] 36.50 ‹25,000, 60,000] 43.21
‹60,000, +∞› 50.00
Source: KPMG (2014).
Following the calculation of the tax liability, some taxpayers may be eligible for tax credits. There are three types of tax credit: basic employee tax credit (EUR 54 per year), commuting tax credit (EUR 291 per year), and primary earner’s and sole parent’s tax credit (EUR 494 per year for the first child, EUR 175 for the second child, and EUR 220 for each subsequent child). The total tax credit is lim-ited to EUR 110 above the initially calculated personal income tax.
Payroll taxes in Austria are levied if the monthly gross wage exceeds EUR 1,095. There are two payroll taxes: the family burden equalisation contribution amount-ing to 4.5% of gross wage and the community tax amountamount-ing to 3% of gross wage.
marin
onora
to
tax
wedge
in
croa
tia
,
austria
,
hungar
y
,
poland
and
greece
financial
theor
y
and
practice
40 (2) 265-288 (2016)
274
3.2.2 tax burden indicatorsTable 11 shows the tax burden indicatorsin Austria. Average PIT rate grows as gross personal income increases, meaning that PIT is progressive. It is worth not-ing that the subjects of such comparisons are always the same – snot-ingle workers without children or couples with two children. The contributions are proportional, until we reach higher wages, when the contributions become regressive. The tax wedge of a single parent with two children (A-67-2C) is 16 percentage points lower than the tax wedge of a single worker without children who earns the same wage (A-67-NC), which is a consequence of the impact of tax reliefs and cash benefits on families with children.
Table 11
Tax burden indicators for basic hypothetical units (Austria, 2013), in %
a-67-nc a-100-nc a-167-nc a-67-2c 2a-100/ 0-2c 2a-100/ 33-2c 2a-100/ 67-2c 2a-100/ 33-nc
Average PIT rate 10.23 16.24 22.93 7.24 14.18 11.64 13.53 11.98 Average employee
SIC rate 18.06 18.06 16.01 18.06 18.06 17.31 18.06 17.31 Net average tax rate 28.29 34.29 38.94 7.68 20.49 20.14 24.54 29.29 Net average tax wedge 44.46 49.12 51.92 28.51 38.42 38.15 41.56 45.24
Source: OECD (2014) and author’s calculations.
Figures 3 and 4 show net average tax wedge and net average tax rate trends across a wide range of gross wages for additional sets of hypothetical single workers and couples with two children. Data for single workers (figure 3) show that the ceiling for contribution calculation is reached at 160% of average gross wage with the tax wedge starting to decline afterwards; the tax wedge thus decreases towards 50% for the highest gross wages presented in figure 3.
Figure 3
Net average tax wedge and net average tax rate for single workers without children (Austria, 2013), in %
50 55 60 65 70 75 85 90 95 100 110 120 130 140 150 160 170 180 190 200 220 250 300 350 400 450 500
marin
onora
to
tax
wedge
in
croa
tia
,
austria
,
hungar
y
,
poland
and
greece
financial
theor
y
and
practice
40 (2) 265-288 (2016)
275
Net average tax wedge for couples (figure 4) has intervals where the wedge is“stagnant”, i.e. it remains the same when the wage earned by one spouse incre-ases. The first such interval appears in the tax wedge of couples where one spouse earns 100% of AGW, while the second spouse’s wage is between 0 and 50% of AGW; the second interval starts with a couple whose gross wage is 140% and 120% of AGW. This interval continues to the end of the observed range.
Figure 4
Net average tax wedge and net average tax rate for hypothetical units (Croatia, 2013), in %
Source: Author’s calculation.
3.3 gReece
3.3.1 basic components of labour taxation in greece
There are three types of social insurance contributions in Greece, all paid by both employees and employers (table 12). The total rate payable by employers is rela-tively high: 27.46%. The maximum annual SIC base is EUR 66,562.
Table 12
SIC rates (Greece, 2013)
contribution employee sIcs
(% of gross wage) (% of gross wage)employer sIcs
Social insurance (IKA) 9.22 18.43 Social insurance (ETEAM) 3 3 Other insurance funds 4.28 6.03 Total 16.50 27.46
marin
onora
to
tax
wedge
in
croa
tia
,
austria
,
hungar
y
,
poland
and
greece
financial
theor
y
and
practice
40 (2) 265-288 (2016)
276
Deductions for social insurance contributions are the only allowance recognized in PIT base calculation. PIT bands and rates are shown in table 13.Table 13
PIT bands and rates (Greece, 2013)
tax band (in eUR) tax rate (in %)
[0, 25,000] 22
‹25,000, 42,000] 32
‹42,000, +∞› 42
Source: OECD (2014).
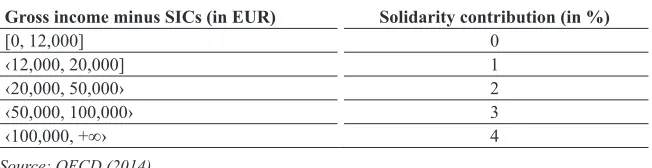
Another special tax has been introduced in Greece, called “solidarity contribu-tion”, which is calculated as a percentage of the gross wage minus employee SICs. For solidarity contribution rates, see table 14.
Table 14
Solidarity contribution rates (Greece, 2013)
gross income minus sIcs (in eUR) solidarity contribution (in %)
[0, 12,000] 0 ‹12,000, 20,000] 1
‹20,000, 50,000› 2
‹50,000, 100,000› 3
‹100,000, +∞› 4
Source: OECD (2014).
There is only one tax credit type in Greece, which is calculated as follows: let x be the gross wage. If x ≤ 21,000, the tax credit will be EUR 2,100. If x > 21,000, the EUR 2,100 tax credit is reduced by EUR 100 for each EUR 1,000. Therefore, if the gross wage is EUR 30,000, the tax credit equals EUR 1,200.
No payroll taxes are levied, and there are no cash family benefits. There is, how -ever, a unique feature which may be classified as a sort of cash benefit. If the employee is married, the employer shall increase their standard gross wage by 10%. For each child, the wage will be increased by an additional 5%. For exam-ple, if the employee is married and has two children, their gross wage will increase by 20%.
3.3.2 tax burden indicators
marin
onora
to
tax
wedge
in
croa
tia
,
austria
,
hungar
y
,
poland
and
greece
financial
theor
y
and
practice
40 (2) 265-288 (2016)
277
special employer’s child allowance in Greece. This allowance is a component ofthe gross wage, meaning that its effect cannot be seen in this analysis since it is based on equivalent initial gross wages.
Table 15
Tax burden indicators for basic hypothetical units (Greece, 2013), in %
a-67-nc a-100-nc a-167-nc a-67-2c 2a-100/ 0-2c 2a-100/ 33-2c 2a-100/ 67-2c 2a-100/ 33-nc
Average PIT rate 3.08 9.01 18.78 5.31 12.76 9.57 10.24 7.79 Average employee
SIC rate 16.5 16.5 16.5 16.5 16.5 16.5 16.5 16.5 Net average tax rate 19.58 25.51 35.28 21.81 29.26 26.07 26.74 24.29 Net average tax
wedge 36.91 41.56 49.22 38.65 44.5 42 42.52 40.6
Source: OECD (2014) and author’s calculations.
Figures 5 and 6 show net average tax wedge and net average tax rate trends ap-plicable to a wide range of gross wages, for additional hypothetical sets of single workers and couples with two children. The tax wedge at relatively high gross wage levels exceeds 55% for single workers (figure 5) but starts decreasing to -wards 50% when 300% AGW is exceeded, due to the SIC base ceiling.
An interesting development for couples (figure 6) is a mild regressive trend of the net average tax wedge and net average tax rate, which show a decreasing tendency when couples with gross wages equalling 100 and 0% of AGW and couples with gross wages amounting to 100 and 50% AGW are observed.
Figure 5
Net average tax wedge and net average tax rate for single workers without children (Greece, 2013), in %
50 55 60 65 70 75 85 90 95 100 110 120 130 140 150 160 170 180 190 200 220 250 300 350 400 450 500
marin
onora
to
tax
wedge
in
croa
tia
,
austria
,
hungar
y
,
poland
and
greece
financial
theor
y
and
practice
40 (2) 265-288 (2016)
278
Figure 6Net average tax wedge and net average tax rate for couples with two children (Greece, 2013), in %
Source: Author’s calculation.
3.4 hUngaRY
3.4.1 basic components of labour taxation in hungary
Three types of social insurance contributions, payable by employees and employ-ers, are levied in Hungary. Just like in Greece, employer SICs are relatively high and total 27% of the gross wage. The rates are shown in detail in table 16.
Table 16
SIC rates (Hungary, 2013)
contribution employee sIcs
(% of gross wage) (% of gross wage)employer sIcs
Pension insurance 10.0 24.0 Health insurance 7.0 2.0 Unemployment insurance 1.5 1.0 Total 18.5 27.0
Source: OECD (2014).
PIT can be reduced by claiming a child allowance of EUR 206 monthly per child. PIT rate is universal and stands at 16%. There is no tax credit.
Payroll taxes amount to 1.5% of gross wage.
marin
onora
to
tax
wedge
in
croa
tia
,
austria
,
hungar
y
,
poland
and
greece
financial
theor
y
and
practice
40 (2) 265-288 (2016)
279
3.4.2 tax burden indicatorsTable 17 shows tax burden indicators in Hungary. The tax wedge of a single parent with two children (A-67-2C) is as many as 24 percentage points lower than that of a single worker without children earning the same wage (A-67-NC). If we com-pare hypothetical couples 2A-100/33-2C (with two children) and 2A-100/33-NC (without children), we find a difference of 11 percentage points. Allowances in the PIT system and child benefits thus have a significant impact on the tax burden in Hungary.
Table 17
Tax burden indicators for basic hypothetical units (Hungary, 2013), in %
a-67-nc a-100-nc a-167-nc a-67-2c 2a-100/ 0-2c 2a-100/ 33-2c 2a-100/ 67-2c 2a-100/ 33-nc
Average PIT rate 16.00 16.00 16.00 3.65 7.77 9.82 11.06 16.00 Average employee
SIC rate 18.50 18.50 18.50 18.50 18.50 18.50 18.50 18.50 Net average tax rate 34.50 34.50 34.50 3.87 15.31 20.11 22.99 34.50 Net average tax
wedge 49.03 49.03 49.03 25.19 34.10 37.83 40.07 49.03
Source: OECD (2014) and author’s calculations.
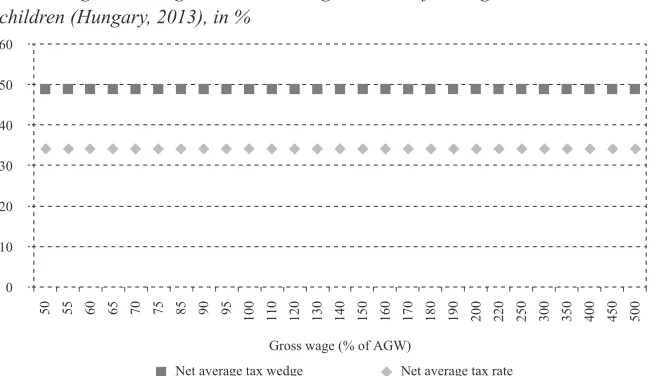
The analysis of the system shows that single workers without children are not entitled to any tax reliefs, tax credit, or cash transfers; only one PIT rate and one employee SIC and employer SIC rate is applied. This makes the tax wedge and ratio of paid taxes to gross wage equal for all gross wages earned by single work-ers without children (table 17 and figure 7). Therefore, the Hungarian tax system is proportional for single workers without children.
Figure 7
Net average tax wedge and net average tax rate for single workers without children (Hungary, 2013), in %
50 55 60 65 70 75 85 90 95 100 110 120 130 140 150 160 170 180 190 200 220 250 300 350 400 450 500
marin
onora
to
tax
wedge
in
croa
tia
,
austria
,
hungar
y
,
poland
and
greece
financial
theor
y
and
practice
40 (2) 265-288 (2016)
280
On the other hand, the system applied to couples with children is progressive, ow-ing to a personal allowance for dependent children and a universal child benefit (figure 8).Figure 8
Net average tax wedge and net average tax rate for couples with two children (Hungary, 2013), in %
Source: Author’s calculation.
3.5 PolanD
3.5.1 basic components of labour taxation in Poland
The basic information on SIC rates in Poland are shown in table 18. However, the relatively complicated calculation of payable contributions does not fit the simple pattern applied in most of the other observed countries. For the calculation method, see OECD (2014). Pension insurance contributions and unemployment contribu-tions are levied on a maximum base of EUR 26,555.
Table 18
SIC rates (Poland, 2013)
contribution employee sIcs
(% of gross wage) (% of gross wage)employer sIcs
Pension insurance (ZUSa) 6.11 6.11
Pension insurance (ZUS II) 2.25 2.25
Pension insurance (OPF) 1.40 1.40 Unemployment contribution 1.50 6.50 Sickness insurance 2.45 4.17 Health insurance 9.00 –
marin
onora
to
tax
wedge
in
croa
tia
,
austria
,
hungar
y
,
poland
and
greece
financial
theor
y
and
practice
40 (2) 265-288 (2016)
281
There are two different allowances in the Polish PIT system: the basicwork-re-lated relief is capped at EUR 318 for all workers, while the other relief amounts to a part of the employee’s contributions and is calculated using a specific formula.
PIT calculation in Poland is based on two tax rates and two tax bands (table 19). Having applied the tax rate, the taxpayer can use three types of tax credit. The basic tax credit amounts to EUR 133 per year or EUR 265 per year for a single worker with children. The tax credit for children is EUR 133 per year for each child, if the annual gross wage received by one parent does not exceed EUR 26,700, while the threshold for the other parent is EUR 13,350. Health insurance contributions can almost entirely be claimed as tax credit.
No payroll tax is levied and no cash family benefits are received.
Table 19
PIT bands and rates (Poland, 2013)
tax band in Pln tax rate
[0, 20,390] 18%
‹20,390, +∞› 3,538 + 32%
Source: OECD (2014).
3.5.2 tax burden indicators
Table 20 shows the tax burden indicators in Poland. It is noteworthy that the aver-age PIT rate is relatively low and shows a relatively slow upward trend as the taxpayer’s income grows. The tax wedge of a single parent with two children (A-67-2C) falls 5 percentage points behind that of single workers without children earning an equal wage (A-67-NC). If we compare hypothetical couples 2A-100/33-2C (with two children) and 2A-100/33-NC (without children), the difference amounts to 3.5 percentage points.
Table 20
Tax burden indicators for basic hypothetical units (Poland, 2013), in %
family type
a-67-nc a-100-nc a-167-nc a-67-2c 2a-100/ 0-2c 2a-100/ 33-2c 2a-100/ 67-2c 2a-100/ 33-nc
Average PIT rate 5.96 6.92 7.69 0.00 0.22 1.94 3.32 5.96 Average employee
SIC rate 17.83 17.83 17.83 17.83 17.83 17.83 17.83 17.83 Net average tax rate 23.79 24.75 25.52 17.83 18.04 19.76 21.14 23.79 Net average tax
wedge 34.74 35.56 36.22 29.63 29.82 31.29 32.48 34.74
Source: OECD (2014) and author’s calculations.
marin
onora
to
tax
wedge
in
croa
tia
,
austria
,
hungar
y
,
poland
and
greece
financial
theor
y
and
practice
40 (2) 265-288 (2016)
282
Figure 9Net average tax wedge and net average tax rate for single workers without children (Poland, 2013), in %
50 55 60 65 70 75 85 90 95 100 110 120 130 140 150 160 170 180 190 200 220 250 300 350 400 450 500
Source: Author’s calculation.
Figure 10
Net average tax wedge and net average tax rate for couples with two children (Poland, 2013), in %
Source: Author’s calculation.
4 coMPaRatIVe analYsIs
marin
onora
to
tax
wedge
in
croa
tia
,
austria
,
hungar
y
,
poland
and
greece
financial
theor
y
and
practice
40 (2) 265-288 (2016)
283
Figure 11
Net average tax wedge for single workers (2013), in %
50 55 60 65 70 75 85 90 95 100 110 120 130 140 150 160 170 180 190 200 220 250 300 350 400 450 500
Source: Author’s calculation.
The lowest tax wedge for single taxpayers earning less than 100% of AGW is found in Croatia, followed by Poland and Greece (figure 11). If we look at the interval in which the gross wage exceeds 100% of AGW, Poland’s tax wedge is convincingly the lowest, while the curves indicating Hungary’s, Austria’s and Greece’s tax wedge are “intertwined” in this interval. The Croatian tax wedge curve rises steeply in the interval indicating wages between 180% and 400% of AGW and meets the level of the aforementioned three countries as wages reach the highest amounts.
Figure 12
Net average tax wedge for couples with two children (2013), in %
marin
onora
to
tax
wedge
in
croa
tia
,
austria
,
hungar
y
,
poland
and
greece
financial
theor
y
and
practice
40 (2) 265-288 (2016)
284
Greece has the highest tax wedge for couples with two children at all wage levels (figure 12). Even though Hungary’s and Austria’s PIT systems are significantly different, it is noticeable that the two countries’ tax wedges are very similar across all gross wage levels. Among the analysed countries, Croatia’s and Poland’s tax wedges are the lowest; as is the case for single workers, the tax wedge is initially higher in Poland, but the tax wedge in Croatia exceeds the Polish tax wedge at a certain point. When comparing figures 12 and 11, it becomes evident that the cor -relation between tax wedge curves for single workers and those for couples with children differs substantially. This is due to the fact that significantly different tax reliefs and cash benefits for families with children apply.5 conclUsIon
The aim of this paper was to compare the average tax burden imposed on taxpayers in Croatia, Austria, Greece, Hungary and Poland. OECD data and methodology presented in OECD’s Taxing Wages publication were used to calculate indicators for the eight hypothetical family units defined by the OECD. Moreover, such indicators were calculated for a number of other hypothetical units across a wide range of gross wages in order to gain an insight into the tax burden at higher income levels. A mi-crosimulation model for hypothetical units across all five countries developed by the author specifically for this research was used for the above calculations.
Even though the observed countries are geographically relatively close and are all EU members, substantial differences in the labour income taxation systems are found. Each of the countries has its own unique features. For instance, Poland’s system for calculating social insurance contributions is relatively complicated; Hungary has only one PIT rate; Greece lacks the usual child benefits: instead, employers increase the employee’s gross wage by a certain percentage for each child; there is no tax credit in Croatia, but taxpayers are entitled to child benefits (which are means-tested), etc.
In spite of the differences in the taxation systems, some countries follow similar patterns and have similar net average tax wedge levels for different wage levels (for instance, Hungary and Austria in the case of couples with children). The com-parison of hypothetical units with and without children has shown that the relative amounts of tax reliefs and child benefits differ among countries.
The analysis has also shown that Croatia has the lowest net average tax wedge for single workers with lower wages, while the tax wedge for single workers with above-average wages is lowest in Poland. However, it is worth noting that both Polish and Croatian taxpayers pay additional social insurance contributions which are not included in the tax burden calculations under the methodology used in this paper (see Urban, 2016).
marin
onora
to
tax
wedge
in
croa
tia
,
austria
,
hungar
y
,
poland
and
greece
financial
theor
y
and
practice
40 (2) 265-288 (2016)
285
RefeRences1. CBS, 2015. DZS website. [online] Available at: <http://www.dzs.hr/>. 2. Child Benefits Act (Zakon o doplatku za djecu), NN 94/01, 138/06, 107/07,
37/08, 61/11, 112/12, 82/15. [online] Available at: <http://www.zakon.hr/z/ 475/zakon-o-doplatku-za-djecu>.
3. KPMG, 2014. 2014 KPMG International Annual Review. [online] Available at: <http://www.kpmg.com/TW/zh/Documents/2014/international-annual-re-view-2014.pdf>.
4. OECD, 2014. Taxing Wages 2014. Paris: OECD.
5. OECD, 2015. Non-tax compulsory payments as an additional burden on
la-bour income. [online] Available at:
<http://www.oecd.org/tax/tax-policy/Non-tax-compuslory-payments_2014.pdf>.
6. Personal Income Tax Act (Zakon o porezu na dohodak), NN 177/04, 73/08, 80/10, 114/11, 22/12, 144/12, 43/13, 120/13, 125/13, 148/13, 83/14, 143/14. [online] Available at: <http://www.zakon.hr/z/85/Zakon-o-porezu-na-dohodak>. 7. Social Insurance Contributions Act (Zakon o doprinosima), NN 84/08, 152/08, 94/09, 18/11, 22/12, 144/12, 148/13, 41/14, 143/14. [online] Available at: <http://www.zakon.hr/z/365/Zakon-o-doprinosima>.
8. Urban, I., 2016. Tax wedge on labour income in Croatia and the Europen Union.
marin
onora
to
tax
wedge
in
croa
tia
,
austria
,
hungar
y
,
poland
and
greece
financial
theor
y
and
practice
40 (2) 265-288 (2016)
286
annextax anD contRIbUtIon calcUlatIons foR the eIght hYPothetIcal faMIlY UnIts In cRoatIa
Table a1
Elements of tax burden indicator calculation: part 1 (Croatia, 2013)
a-67-nc a-100-nc a-167-nc a-67-2c
1. Gross wage 8,202 12,303 20,505 8,202 2. Employee SICs 1,640 2,461 4,101 1,640
2.1. Paid into the 1st pension
insurance pillar 1,230 1,845 3,076 1,230 2.2. Paid into the 2nd pension
insurance pillar 410 615 1,025 410 3. Personal income tax 369 1,136 2,777 0 3.1. Tax base reductions 5,126 5,947 7,587 9,309 3.1.1. Employee SICs 1,640 2,461 4,101 1,640 3.1.2. Personal allowance 3,486 3,486 3,486 7,669 3.2. PIT base 3,076 6,357 12,919 0 4. Local government surtax on PIT 44 136 333 0 5. Total personal income taxes 413 1,272 3,110 0
6. Child benefits 0 0 0 727
7. Net wage 6,148 8,570 13,295 7,289 8. Employer SICs 1,247 1,870 3,117 1,247 9. Total employee taxes
(= 2.1 + 5 – 6) 1,643 3,117 6,186 503 10. Total employee and employer
taxes (= 8 + 9) 2,890 4,987 9,303 1,750 11. Total labour cost (= 1 + 8) 9,449 14,174 23,623 9,449 12. Net average tax rate
(= 9 / 1 x 100) 20.04 25.34 30.17 6.13 13. Net average tax wedge
(= 11 / 12 x 100) 30.59 35.19 39.38 18.52
marin
onora
to
tax
wedge
in
croa
tia
,
austria
,
hungar
y
,
poland
and
greece
financial
theor
y
and
practice
40 (2) 265-288 (2016)
287
Table a2
Elements of tax burden indicator calculation: part 2 (Croatia, 2013)
2a-0/100-2c 2a-100/33-2c a1 a2 total a1 a2 total
1. Gross wage 12,303 0 12,303 12,303 4,101 16,404 2. Employee SICs 2,461 0 2,461 2,461 820 3,281
2.1. paid into the 1st
pension insurance
pillar 1,845 0 1,845 1,845 615 2,460 2.2. paid into the 2nd
pension insurance
pillar 615 0 615 615 205 820 3. Personal income tax 52 0 52 261 0 261 3.1. Tax base reductions 11,872 0 11,872 10,130 4,306 14,436
3.1.1. Employee
SICs 2,461 0 2,461 2,461 820 3,281 3.1.2. Personal
allowance 9,412 0 9,412 7,669 3,486 11,155 3.2. PIT base 431 0 431 2,174 0 2,174 4. Local government surtax
on PIT 6 0 6 31 0 31 5. Total personal income
taxes 58 0 58 292 0 292
6. Child benefits 632 0 632 0 0 0
7. Net wage 10,417 0 10,417 12,831 0 12,831 8. Employer SICs 1,870 0 1,870 1,870 623 2,493 9. Total employee taxes
(= 2.1 + 5 – 6) 1,271 0 1,271 2,137 615 2,752 10. Total employee and
employer taxes (= 8 + 9) 3,141 0 3,141 4,007 1,238 5,245 11. Total labour cost
(= 1 + 8) 14,174 0 14,174 14,174 4,725 18,899 12. Net average tax rate
(= 9 / 1 x 100) 10.33 16.78 13. Net average tax wedge
(= 11 / 12 x 100) 22.16 27.76
Note: (a) see the note under table A1; (b) A1 – Spouse I, A2 – Spouse II, “Total” – sum of val-ues for Spouse I and Spouse II.
marin
onora
to
tax
wedge
in
croa
tia
,
austria
,
hungar
y
,
poland
and
greece
financial
theor
y
and
practice
40 (2) 265-288 (2016)
288
Table a3Elements of tax burden indicator calculation: part 3 (Croatia, 2013)
2a-100/67-2c 2a-100/33-nc a1 a2 total a1 a2 total
1. Gross wage 12,303 8,202 20,505 12,303 4,101 16,404 2. Employee SICs 2,461 1,640 4,101 2,461 820 3,281
2.1. paid into the 1st
pension insurance
pillar 1,845 1,230 3,075 1,845 615 2,460 2.2. paid into the 2nd
pension insurance
pillar 615 410 1,025 615 2,015 2,630 3. PIT 261 369 630 1,136 0 1,136 3.1. Tax base reductions 10,130 5,126 15,256 5,947 4,306 10,253
3.1.1. Employee
SICs 2,461 1,640 4,101 2,461 820 3,281 3.1.2. Personal
allowance 7,669 3,486 11,155 3,486 3,486 6,972 3.2. PIT base 2,174 3,076 5,250 6,357 0 6,357 4. Local government surtax
on PIT 31 44 75 136 0 136 5. Total personal income
taxes 292 413 705 1,272 0 1,272
6. Child benefits 0 0 0 0 0 0
7. Net wage 15,699 0 15,699 11,851 0 11,851 8. Employer SICs 1,870 1,247 3,117 1,870 623 2,493 9. Total employee taxes
(= 2.1 + 5 – 6) 2,137 1,643 3,780 3,117 615 3,732 10. Total employee and
employer taxes
(= 8 + 9) 4,007 2,890 6,897 4,987 1,238 6,225 11. Total labour cost
(= 1 + 8) 14,174 9,449 23,623 14,174 4,725 18,899 12. Net average tax rate
(= 9 / 1 x 100) 18.44 22.76 13. Net average tax wedge
(= 11 / 12 x 100) 29.20 32.95
Note: (a) see the note under table A1; (b) A1 – Spouse I, A2 – Spouse II, “Total” – sum of val-ues for Spouse I and Spouse II.