RAINFALL INTERPOLATION ANALYSIS ON RIVER KADUNA
CATCHMENT FOR CLIMATE CHANGE ASSESSMENT
H. Garba
1,*, L. G. Tilli
2, S. Ahmed
3and A. Ibrahim
41, 2, 3, 4
D
EPARTMENT OFC
IVILE
NGINEERING,
N
IGERIAND
EFENCEA
CADEMYK
ADUNAK
ADUNAS
TATE,
NIGERIA
E-mail addresses
:
1[email protected],
2[email protected],
3[email protected],
4
[email protected]
ABSTRACT
The Inverse Distance Weighing (IDW) technique for rainfall interpolation considered by researchers as a suitable method for predicting missing rainfall records was used to estimate missing rainfall records in River Kaduna Catchment area from 1979-1990. Distances among respective rainfall stations were used to calculate the weighing factor for stations with missing records and radius of influence of 22.5-201km. The Root Mean Square Error (RMSE) was used to test the accuracy of the assessment and the results were validated using correlation coefficient. From the results of the analysis through optimization of steps of α values and radius of influence, the smaller the optimum parameter value the better the prediction and in most cases the accuracy increases at short optimum search radii, also small amount and long duration rainfall values enhances the prediction potential of the IDW.
Keywords: Rainfall data, Inverse Distance Weighing, Interpolation, Optimum parameter.
1. INTRODUCTION
Rainfall is a highly important data which is frequently required for water resources management, hydrological and ecological modelling, recharge assessment and irrigation scheduling [1]. Rainfall data are normally recorded as observation data through designed station networks. Rainfall records or data according to [1, 2] often have significant portion of the records missing due to insufficient station in the region or failure of recording system that need to be estimated. Recently, Global Climate Models (GCM) are widely used for assessing the response of climate systems to change in atmospheric forcing [3].
Several methods of obtaining rainfall pattern and distribution over a watershed are available which include the traditional methods comprising Thiesson polygon, Isohyital and Average mean methods. However there are now more advanced methods such as Inverse Distance Weighing (IDW), Kringing, Proximal, B-spline, Farrier Series etc, but the biggest concern among researches according to [4 -7] is to identify which method is the most suitable to interpolate data, for this reason [8-10] Identified the IDW and several types of Kriging as the most promising technique for rainfall interpolation.
There are many varieties of spatial interpolation techniques and they can be categorized into three based on the interpolation methods and the scale of application. The first category is the nearest neighbourhood (NN), Thiessen polygon, spline and various forms of Kringing and IDW, which are frequently used in interpolating rainfall data from gauged stations [11-14]. These interpolation methods are relatively simple, require relatively little input data. The second category uses ancillary data such as satellite imaginary and digital elevation models along with wide ranging station data for the interpolation process of rainfall prediction at large scale as demonstrated in [15-17]. The third category forecast rainfall based on complex interpolation models such as fuzzy reasoning methods and artificial neutral networks presented in [18-20]. The aim of the study is to apply the Inverse Weighing Method (IDW) technique of rainfall interpolation to predict missing rainfall records in River Kaduna Cathment.
2. THE STUDY AREA
Kaduna river catchment (Figure 1) has a total drainage area of approximately 18,244.87km2, within the
catchment, there are seven meteorological data collection points located at Kaduna North, Kaduna
Vol. 37, No. 3, July 2018, pp.
806 – 812
Copyright© Faculty of Engineering, University of Nigeria, Nsukka,Print ISSN: 0331-8443, Electronic ISSN: 2467-8821 www.nijotech.com
The amount of rainfall is usually measured by means of a rain gauged which is essentially a circular funnel with a diameter of 203mm which collects the rain in a graduated and calibrated cylinder. This study is focused on River Kaduna which takes its source from Sherri Hill in Plateau State. River Kaduna flows north-west towards the Kaduna metropolis and thereafter takes a south west direction turn at Mureji. River Kaduna covers a total distance of 540km from source to mouth [21]. Kaduna State which occupies a central position in the Northern geographical region of Nigeria and also lies within the Northern Savana Zone of Nigeria is located on latitude 9030’N and latitude
11045’N; longitude 70E and 8030’E. It covers a total land
mass of 2,896,000km2
3. DATA AND METHODS
Precipitation in the study area has an uneven spatial and temporal distribution. The average annual precipitation is usually below 300mm. The rainfall is mostly concentrated between May and September. In the Kaduna river catchment area, there are seven (7) meteorological data collection points located at Kaduna North, Kaduna South, Zaria, Zonkwa, Kaura, Kangimi and Saminaka (Fig 1). Historical observation of rainfall data was required to interpolate spatial rainfall using
from 1979 to 1990 were adopted in the study.
3.1 Inverse Distance Weighing (IDW)
The IDW, widely recommended by [10]. The method estimate the unknown cell values in output surface by averaging the values of all input sample data points that lie within the specified search radius. Daily, hourly yearly etc. rainfall data for a region with station coordinates (Latitude and Longitudes) are input into the model. The method involves the process of assigning values to unknown points by using values from a set of known points, IDW can be used to estimate unknown spatial data from known data of sites that are adjacent to unknown site [2][10]. The IDW formula could be defined as;
∑
∑
Where is the unknown rainfall data (mm); is the known rainfall data (mm); N is the number of rainfall station; is the weighing of each rainfall stations; is the distance from each rainfall station to the unknown site; α refers to the power and is also the control parameter.
GIWA
R.TUBO
R. LADI TUBO DAN MARI CATCHMENT
R. HUNKUYI
ZARIA
KANGIMI
LOWER KADUNA CATCHMENT
DRINAGE MAP OF KADUNA RIVER
SCALE — 1,500000 OF ONE CM TO 15KM STATE BOUNDARY
CATCHMENT BOUNDARY METEOROLOGICAL STATION INTER. CATCHMENT BOUNDARY
GALMA CATCHMENT
R. POWI
KARAMI CATCHMENT
UPPER KADUNA CATCHMENT ANCHAU
R.GALMA
LERE
R. KA A N R
R . K A DUNA
KADUNA SOUTH
ZANGO K ZONKWA MIDDLE KADUNA
CATCHMENT R.TUBO
R. RUZA
KAURU MAKARFI
ZOBA
SAMINAKA
R . KA DU NA
KADUNA NORTH
LEGEND
7’00’ 7’30’ 8’00’ 8’30’ 8’45’E
7’00’ 7’30’ 8’00’ 8’30’ 8’45’E
11’30’E
11’00’
10’30’
10’00’
9’30’
9’00’N
11’30’E
11’00’
10’30’
10’00’
9’30’
9’00’N
The weighing factor used for calculating rainfall in equation (1) is;
3
where is the station with the record closer to the station that was estimated and is the next closer station. The optimum parameter α is the optimal number of rainfall stations close to the objective rainfall station (Table 3). The IDW model equation (equations 1and2) was applied to estimate the missing records. The optimum parameter α and the search radius of the IDW were used as control parameters for the IDW model formula. The results were all validated using correlation coefficient r.
3.2 Model Testing
The accuracy of the IDW model was is tested using the Root Mean Square Error (RMSE). It evaluate the difference between the values predicted or estimated by the model and the actual observed values. Furthermore, the correlation coefficient r was also used for evaluating whether the estimated data fits observed data or not. The formulas for RMSE and r are given as;
E √∑ ( ) ; E, 0
∑ ( ) √∑ ∑ ( )
4
Where refers to the spatial rainfall values interpolated using IDW in the unknown station
i; is the observed rainfall data in the known station i; n is the means number.
3.4 Interpolation Technique
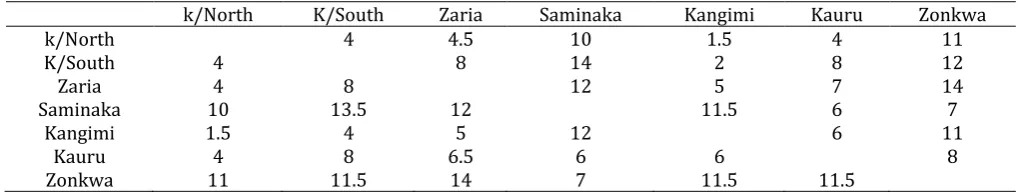
To interpolate the missing rainfall by IDW model, seven (7) rainfall recording station within Kaduna River catchment were used. Kaduna North rainfall station with no missing for the period (1979-1990) is considered as the index station while the remaining stations with most part of record missing for the period under review namely; Kaduna South, Zaria, Kangimi, Kauru Saminaka and Zonkwa were the unknown stations. Within the study period, there are existing records for the stations as follows; Kangimi in Kaduna North LGA (1981,1982,1983,1984), Kaduna South in Kaduna South LGA(1986,1988,1989,1990), Zaria in Zaria LGA (1986,1989,1990), Saminaka in Lere LGA(1986,1989) Kauru in Kauru LGA(1986,1989) and Zonkwa in Zangon Kataf LGA(1989). Table 1 shows the estimated distances in km among the respective rainfall station used to calculate the weighing factor for the stations in Table 2. The radius of influence was determined from the drainage map (22.5km-210km), similarly distances within the stations were traced from the drainage map in Fig 1.
4. RESULTS AND DISCUSSIONS
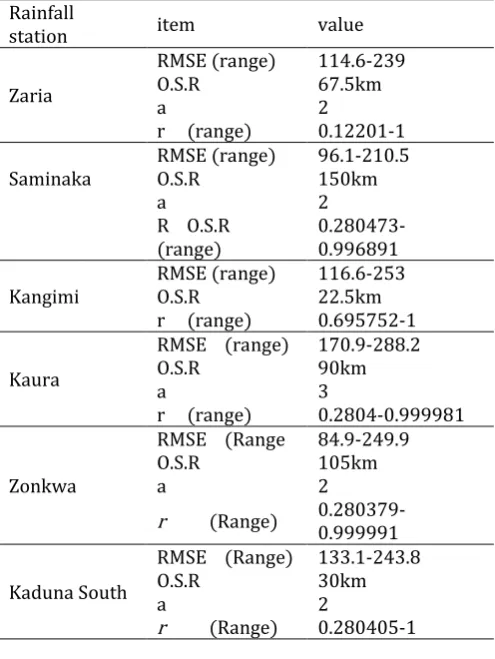
Six rainfall stations (Table 1), located on River Catchment are the unknown stations and the missing data were estimated in sequential order using IDW model formula and optimum parameter α -4. Each station was estimated individually using the observed data within the individual station search radius. The optimum parameter of the IDW, α, optimum search radii (O.S.R) and RMSE were calculated, the accuracy of the IDW technique was checked by validating the estimated results using correlation coefficient and the results shown in Table 3.
Table 1 Approximate distances in km (1cm-15km) between stations to the index station for calculation weighing factor.
k/North K/South Zaria Saminaka Kangimi Kauru Zonkwa
k/North 4 4.5 10 1.5 4 11
K/South 4 8 14 2 8 12
Zaria 4 8 12 5 7 14
Saminaka 10 13.5 12 11.5 6 7
Kangimi 1.5 4 5 12 6 11
Kauru 4 8 6.5 6 6 8
Zonkwa 11 11.5 14 7 11.5 11.5
Table 2 Weighing Factor for the unknown Station
K/South Zaria Saminaka Kangimi Kauru Zonkwa
From the results, it could be adduced that the range of the high range of the RMSE values could be due to small number of high error estimations resulting in overestimation of some estimation. It could also be due points were predicted values has a high difference with the observed. However, the correlation coefficient in the prediction suggests a strong linear relationship between the observed and estimated values and the total predictions.
The relationship between the interpolated and observed rainfall values for stations with missing data; Kaduna south (K/S), Zaria (ZR), Saminaka(SM), Kangimi(KM) Kauru(KR) and Zonkwa (ZK) was evaluated and the results shown in Figure 2, from the accuracy of the estimation and validation it can be observed that increase in RMSE has a better correlation between interpolated and observed rainfall. As the α value approaches one, the RMSE increases this showed that minimum variation at smaller α values irrespective of the number of rainfall stations used for the interpolation
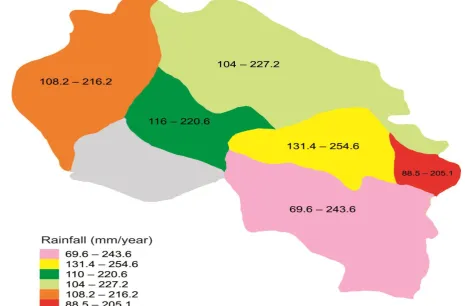
The IDW technique is a suitable method for rainfall interpolation on condition that optimum parameter and search radius must be measured. Finally the River Kaduna area was assigned missing records as shown in Fig 3.
5. CONCLUSION
In this study, two major findings can be established, by using the IDW for interpolating spatial rainfall. First the predicted accuracy of rainfall interpolated can be improved through the α value adjustment and secondly the number of known rainfall station is an influential
parameter in most cases the predicted accuracy increase with increasing number of known station, and at short optimum search radii. Finally the smaller the amount of the rainfall value, the better the prediction potential of IDW.
Table 3 Optimum parameters of IDW for interpolation of rainfall data
Rainfall
station item value
Zaria
RMSE (range) 114.6-239
O.S.R 67.5km
a 2
r (range) 0.12201-1
Saminaka
RMSE (range) 96.1-210.5
O.S.R 150km
a 2
R O.S.R (range)
0.280473-0.996891
Kangimi
RMSE (range) 116.6-253
O.S.R 22.5km
r (range) 0.695752-1
Kaura
RMSE (range) 170.9-288.2
O.S.R 90km
a 3
r (range) 0.2804-0.999981
Zonkwa
RMSE (Range 84.9-249.9
O.S.R 105km
a 2
r (Range) 0.280379-0.999991
Kaduna South
RMSE (Range) 133.1-243.8
O.S.R 30km
a 2
r (Range) 0.280405-1
-200
0 200 400 600
0 100 200 300 400 500
o
b
se
rv
ed
ra
in
fall
m
m
/y
r
interpolated rainfall mm/yr
1979
K/S ZR SM KG KR ZK
-200 0 200 400
-100 0 100 200 300
o
b
se
rv
ed
ra
in
fall
m
m
/y
r
interpolated rainfall mm/yr
1983
-200 0 200 400 600
-100 0 100 200 300 400 500
o b se rv ed ra in fall m m /y r
inperpolated rainfall mm/yr
1980
K/S ZR SM KG KR ZK
-200 0 200 400 600
-100 0 100 200 300 400 500
o b sre ve d ra if all m m /y r
interpolated rainfall mm/yr
1981
K/S ZR SM KG KR ZK
-500 0 500 1000
-100 0 100 200 300 400
o b se rv ed ra in fall m m /y r
interpolated rainfall mm/yr
1985
K/S ZR SM KG KR ZK
-500 0 500 1000
-200 0 200 400 600
o b se rv ed ra in fall m m /y r
interpolated rainfall mm/yr
1982
K/S ZR SM KG KR ZK
-200 0 200 400 600
-100 0 100 200 300 400
o b se rv ed ra in fall m m /y r
interpolated rainfall mm/yr
1986
K/S ZR SM KG KR ZK
-200 0 200 400 600
0 100 200 300 400
o b se rv ed ra in fall m m /y r
interpolated rainfall mm/yr
1987
K/S ZR SM KG KR ZK
-500 0 500 1000
-200 0 200 400 600
o b sre ve d ra in fall m m /y r
interpolated rainfall mm/yr
1988
K/S ZR SM KG KR ZK
-200 0 200 400
0 100 200 300
o b se rv ed ra in fall m m /y r
interpolated rainfall mm/yr
1989
Figure 2: Comparison between interpolated and observed rainfall values
Figure 3: Rainfall classification on River Kaduna catchment.
5 REFERENCES
[1] Yang X, Xie X, Liu D. L, Ji F and Wang L: Spartial interpolation of daily rainfall data for local climate impact assessment over Greater Sydney Region. Hindawi Publishing Corporation:Advances in meteoroly Vol. 2015
Article ID 563629;
http://dx.doi.org//10.1155/2015/563629.
[2] Prodanovic P. and Siminovic S.P. Assessment of water resources risk and vulnerability to changing climate conditions; Inverse flood risk modelling of Upper Thames iver Basin” eport No. VIII, Department of Civil and Environmental Engineering, The University of Western Ontanorio, London, Ontanorio Canada. 2006.
[3] Riley FJM, Clark H, Evan J. P., Argueso D and Fita L: High resolution rainfall prediction for the Graeter ydney egion in “ Proceedings of the 20th
International Congress on Modelling and Simulation pp. 2772-2778 Adelaide. Australia 2013.
[4] Mathew G; Spatial interpolation of precipitation in a dence gauged network for Manson storm events in South-western United State. Water Resources Research Vol.44 pp. 227-240; 2008.
[5] Hao W and Chang Xu; “Comparison of spatial interpolation methods for precipitation in Ningxia. China”. International Journal of Science and Research (IJSR) India Vol.2.Issue 8.pp 181-184. 2013.
-200 0 200 400 600
-100 0 100 200 300 400
o
b
se
rv
ed
ra
in
fall
m
m
/y
r
interpolated rainfall mm/yr
1990
[6] Sarann L; Different methods for spatial interpolation of rainfall data for operational hydrology and hydrological modelling ta watershed level. A review. Bio-technol. Argon. Soc. Environ. Vol 17(2), pp: 292-406.
[7] Gour D and ujan ; A “comparative study of different interpolation methods for rainfall distribution mapping using Remote Sensing and GIS Technologies in Parulia district “International Journal of Remote Sensing and Geoscience (IJRSG)
Vol.2 Issue 6,pp; 8-18, 2014.
[8] Buishand T. A, Beersma J. J., Sluiter R and Kroon T; Definitiestudie restedata meteorology De Bilt, KNMI/RWS Waterdienst, 2008.
[9] Sluiter R; Interpolation methods for climate data; Literature Review. De Bilt Royal Netherlands Meteorological Institute (KNMI), 2008.
[10] USACE; Hydrological Modeling System HEC-HMS, Technical reference manual. United State Army Corps of Engineers, Hydrological Engineering Center Davies California 2000.
[11] Tomczak ; “ partial interpolation and its uncertainty using automated anisotropic Inverse
Distance Weighing (IDW)- Cross
validation/jacknife approach” Journal of Geographic Information and Decision Analysis. Vol.2.no. pp,18-30.1998.
[12] Hutchinson M. F.; “Interpolation of rainfall data with thin plate smoothing splines-part1; two dimensional smoothing of data with short range correlation” Journal of Geographic Information and Decision Analysis. Vol. 2,pp 139-151,1998. [13] Cheng S. J, Hsieh HH and Wang YM: Geostatistical
interpolation of space time rainfall on Tamshu iver Basin Taiwan “Hydrological processes vol. 21.no.23 Pp3136-3145. 2007..
[14] Mair A and Fares A; Comparison of rainfall interpolation methods in a mountainous region of tropical island” Journal of Hydrological Engineering vol.16.no4,pp 371-383,2011.
[15] Grimes DIF, Fardo-Iguzquiza and Bonifacio R; “Optimal areal rainfall interpolation using rainfall gauges and satellite data” Journal of Hydrology,
vol222.no. 1-4.pp 93-101. 1999.
[15] Thomas A and Herzfeld UC ; “ egeotop new climate data fields for East Asia based on localized relief information and geostatistical methods”
International Journal of Climatology vol.24.no.10. pp 1283-1306, 2004.
[16] Haberlandt U ; “Geostatistical interpolation of hourly precipitation from raingauges and radar for a large scale extreme rainfall event”, Journal of Hydrology. vol.332. no. 1-2, pp 144-157, 2007. [17] Friedman J. H; An overview of predictive learning
and function approximation, in From Statistic to Neutral Networks. vol. 136 of NATO ASI Series, Pp 1-61, Springer, Berlin, Germany 1994.
[18] Huang Y, Wong P, and Gedeon P; “ patial interpolation using fuzzy reasoning and generic algorithm”. Journal of Geographic Information and Decision Analysis, vol2, pp. 204-214, 1998. [19] Wong K. W, Wong P. M, Gedeon TD and Fung CC;
Rainfall prediction model using soft computing, vol.7 no. 6, Pp. 434-438, 2003.
[20] Folorunsho J. O., Iguisi EO Muazu MB and Garba S; Application of Adaptive Neuro Fuzzy Inference System (Anfis) in River Kaduna Discharge Forecasting; Research Journal of Applied Sciences Engineering and Technology 4(21); 4275-4283, Maxwell Scientific Organisation 2012.
[21] Mahalingam B, Deidar AN and Vinay M; Analysis of selected spatial interpolation technique for rainfall data; Int J Cur Res. Rev/ol. 7- Issue 7. 2015.
[22] Noori .J, Hassan H.H and ustafa Y.T “ patial interpolation of rainfall distribution and its classification in Duhok Governorate using GI ”