A Reference Model of Public Institutions’ Quality Practices, Citizens’ Satisfaction
and Performance Quality
Asta Daunoriene, Alma Zekeviciene
Kaunas University of Technology
K. Donelaicio st. 73, LT-44029, Kaunas, Lithuania E-mail. [email protected], [email protected]
http://dx.doi.org/10.5755/j01.ee.26.4.6066
In recent years improving public services quality by using quality management methods became one of the most important quality initiatives in Lithuanian public sector. Public institutions have a great challenge to ensure a high level quality focusing on the citizens’ requirements, processes, innovation and environment as well. However, the relations of public institutions’ quality dimensions do not receive a lot of attention from research community and practitioners. This paper complements Lithuanian public institutions service quality area and its relationship with citizen satisfaction and adds an example of the operationalization of different dimensions of public institutions performance quality. Using secondary data along with methodological measurement, this paper provides representative information about citizens’ perceptions about the influence of public institutions quality improvement actions on citizen satisfaction and public institution’s performance quality. Research findings present the importance of citizens’ satisfaction survey results as a possibility to find service quality improvement areas by using different quality management practices as well as to increase citizens’ satisfaction on perceived service quality. Developed and explored reference model integrates different relationships between public institutions’ quality practices and infrastructure quality, and application waiting time and information quality. Moreover, the relationship between public institutions performance quality and public institutions’ quality practices shows the importance of continuous improvement initiatives. Reference model tested on the secondary statistical data presents evidence and provides informative results in order to take effective decisions.
Keywords: Public Institutions Performance Quality, Citizens’ Satisfaction, QM Methods.
Introduction
Continuously growing expectations in modern society and the economic crisis in the world has touched every sector. Public institutions are not an exception. Considering the changing society structure and growing citizens’ requirements, citizens’ satisfaction becomes increasingly important and relevant issue to the public sector success. Current situation requires public institutions to pay attention to the growing citizens’ requirements, to improve public administration processes, to promote public institutions to provide better, faster and more diversified services.
Satisfaction of citizens receiving services from public institutions’ associate with citizens experience on the public institution service and could be used to analyse how provided service meets the citizen’s expectations and needs (McDonald & Vangelder, 1998). Information based on public institutions’ customers’ satisfaction allows public institution managers to focus on the key elements of service and to pay attention to the citizens’ expectations.
In order to become more focused on the users of public institutions’ service, public institutions should improve service quality. The key element of these processes is to orient citizens' satisfaction demanding high-quality. Public institutions’ customer satisfaction measurements give an opportunity to develop high quality services and to change reputation and image in front public service users’ community.
The importance of citizens’ satisfaction measurement can be defined in one word - quality. (Denhardt & Denhardt, 2000; Alford 2002) argue that citizen satisfaction is one of the primary goals for every public institution, which oblige to listen to the "voice" of citizens, understand their needs, and verify the compliance of the actual services provided to meet citizens’ expectations. Citizens’ satisfaction measurement instrument assesses key factors of satisfaction on perceived service quality. However, received information on the citizens’ satisfaction determinants, usually does not influence taking improvement actions. The lack of knowledge’ between correlations of different citizens’ satisfaction determinants does not present full view of the perceived public institutions’ service quality.
The purpose of this paper is to investigate the links between citizens’ satisfaction determinants to overall satisfaction of citizens and to public institution performance quality in order to support quality improvement actions for public institutions managers. The research is based on the secondary data of the Lithuanian public institutions service quality surveys conducted by Vilmorus in 2009. This research complements public institutions service quality area.
Scientific problem analysed in the study is split into several questions:
How does citizens’ satisfaction with the perceived service quality impact on public institutions’ performance quality?
Research object covers public institutions’ citizens’ satisfaction dimensions.
Research methods are: scientific literature content analysis and descriptive statistics methods.
The Importance of Citizen Satisfaction to
Public Institutions Performance Quality
Public and the private sector customer conception vary considerably. In the private sector it is possible to define a customer, who is purchasing a commodity or service (Merriam – Webster dictionary, 2005) and is voting for quality paying money. (Kelly & Swindell 2002; Merkys & Braziene, 2009) and many other authors stated that the definition of public sector customer is much more complicated.
During citizen satisfaction analysis is not properly fair to apply producer – customer paradigm. Citizen needs and political ideologies cover more than public institutions final service conferment. (Abdullah & Kalian, 2008) stated, that in order to satisfy public institutions customers, citizen satisfaction should be indicated as a main goal.
The complexity of citizen satisfaction increases due to the different citizens’ roles and different public service nature. (Lane, 2001) expands public services into two types: direct public services, where customers could be discern from overall public services customers, and universal public services, for e.g. environmental monitoring and so on, that are obtainable to all citizens, which is difficult to discern into individual point of view.
Usually public institutions act in a complex relationship with the society. Then citizen could be defined as a user of public institutions direct services and as a citizen exploring public institutions responsibilities for the establishment of economic and social environment (for e.g., security of the country). Merriam – Webster dictionary defines citizen as an inhabitant of a city or town, especially: one entitled to the rights and privileges of a freeman. (Halaris et al., 2007) state that citizen satisfaction is affected from perceived service quality and expectations. The complexity of public institutions service displays different citizen’s roles (Stumbraite–Vilkisiene, 2010):
Recipient – a customer who receives a service as a cash payment, the service provider takes monopolistic role.
Customer –who is free to choose private or public organization providing services.
User – a customer who has no an alternative service provider.
Operator and producer – a customer who creates and uses a service, for e.g. volunteering.
Buyer – a customer who pays for the direct use of the services, for e.g. public transport.
Taxpayer – a customer who has clearly defined roles. Citizen – a customer who has rights but must respect the rules and certain procedures.
Recipient, user and citizen roles are covered by using public institution citizen definition in the content of this paper.
The characteristics of public institutions performance is a long debated topic in the public management area and scientific literature. Complexity of citizen definitions and roles shows, that citizen satisfaction is influenced by many factors such as elements or characteristics of the system, the users or the task situation. Many authors present the papers focused on different objective and subjective citizen satisfaction assessment variables. (Brown, 2007) differentiates public services by the degree of “captivity” and shows that citizen satisfaction varies by types of services. (Kelly & Swindell, 2002) decisively state that in order to evaluate public labour - intensive services (police, fire service) and capital - intensive services (care of roads, parks) different questionnaires should be prepared.
Adapting customer satisfaction theories, citizen satisfaction could be analysed in a several ways, but generally satisfaction is the fulfilment of person’s needs or requirements. Early customer satisfaction concepts could be described as a post choice evaluative judgment. Oliver & Linda (1981) introduced the expectancy - disconfirmation model, where customer satisfaction in product or service is a result of subjective expectations and perceptions’ comparisons. Later (Parker & Mathews, 2001) analysed customer satisfaction from the point of view of value – percept theory. Customer satisfaction was described as an emotional response triggered by a cognitive evaluative process. Expectancy - disconfirmation customers’ satisfaction model (Oliver & Linda, 1981; Spreng & Olshavsky, 1993) shows that customers’ satisfaction is the result of cognitive process, while the value – percept theory expands customer satisfaction into cumulative experience made with service (Eggert & Ulaga, 2002). In general citizens satisfaction could be expressed as a customer’s overall evaluation of quality of public institution’s provided service and overall performance as well.
Different methods and various aspects have been used to evaluate satisfaction – performance link. (Holzer, Charbonneau & Kim, 2009) analysed methods involving factors of trust (Bouckaert & Van de Walle, 2003; Yang & Holzer, 2006), bottom – up spill over effects (Sirgy et al., 2000), expectation – perception gaps (Parasuraman et al., 1985; Van Ryzin et al., 2004b; Roch & Poister, 2006), disconfirmation of expectation facts (Oliver, 1980; Eng & Niininen, 2005), importance – performance analysis results (Van Ryzin & Immerwahr, 2004, 2007) and user disgruntlement situations (Stradling et al., 2007). (Van Ryzin & Charbonneau, 2010) while comparing frequent and infrequent users paid attention to how differ performance surveys ratings.
Municipals leaders’ realized information about service quality dimensions may differ significantly from the citizens perceived service quality evaluations. It shows that to measure objectively public service customer satisfaction is a big challenge for public institutions (Kelly & Swindell, 2002).
quality of outputs data, efficiency data, effectiveness data, value for money data, equity data, responsiveness to service needs data and overall citizen satisfaction data. Major research examples include administrative performance measurements characteristics (Andrews et al., 2011). These studies discussed on the following dimensions of performance as well as effectiveness (e. g. measures of school test results, crime clearance rate), efficiency (e.g. cost per client served) and equity (e.g. allocation of grant funding to organization and professionals, managers and front-line staff inside public agencies). According to (Andrews et al., 2011) administrative performance indicators are selected by government institutions, so their compositions always reflect the priorities of powerful groups. “… studies using survey data typically asked respondents to assess achievements on the following dimensions of performance: effectiveness (e. g. parent’s perception of their child’s school readiness’), efficiency (e.g. how efficiently a local government is run), equity (e.g. whether the police treated people equally regardless of race), output quality (e. g. the quality of individual local services), responsiveness (e.g. ability to access services online), satisfaction (e.g. satisfaction with treatment received), social, economic and environmental well-being (e.g. how well the organization performs on this), and trust (e.g. confidence in an organization’s ability to deliver a service)… Survey-based studies cover the following stakeholders’ perceptions of performance: citizens, clients, managers, employees, front-line staff” (Andrews et al., 2011, p.233).
The results of public services evaluation studies in Lithuanian public sector showed that population satisfaction with provided public services is very diverse in different administrative units of municipality. The research of quality of life in the largest cities of Lithuania during the period of 2008–2009 (Sajeva et al., 2012) and in Lithuanian municipalities (Rybakovas et al., 2012) covered data related with social-emotional and physical-productive indicators. Mentioned studies didn’t cover the links between citizen’s satisfaction variables such as: infrastructure quality, application waiting time, citizens’ satisfaction on application quality, overall citizens’ satisfaction and used quality practices.
Despite the fact that public institutions could analyse other information channels that allow understanding citizens’ needs and expectations, citizen satisfaction survey is a highly sensitive instrument (Merkys & Braziene, 2009). “Citizen satisfaction as a measure of quality will continue to be a valuable tool, not only as perhaps the best overall indication of performance, but as the most salient — a particularly appealing measure for policy-level managers, elected officials, the media and citizen groups” (Holzer et al., 2009:409).
Kelly & Swindell, (2002) observed two general types of errors citizens might make in evaluating public services: errors of attribution and assessment errors. These errors make influence on citizen satisfaction survey results. Attribution errors appear when citizen believes that public institution is providing service that it is not provided by it or vice versa he believes that public institution is not providing service when it is. Assessment errors appear when citizen evaluates service quality in a contradiction of service quality
objective indicators, such as a performance measure. Public institution services evaluated by citizens’ are enhanced by their personal experience (Kelly & Swindell, 2002; Goodsell, 1983). Generally satisfaction is a person’s feelings toward a variety of factors affecting a given situation (Wixom & Todd, 2005).
Citizen satisfaction measurement is an on-going process, which helps to assess public services quality and to meet growing citizen expectations. Public institutions should improve service quality in order to provide better, faster and diversify services required by citizens. (Jiang et al., 2010) noticed that before taking quality improvement actions, citizens should trust public institutions. However, service quality, quantity, speed and trust of public institution services are not the only criteria to satisfy citizens. A service culture, service environment and employee professionalism are the other factors important to citizens.
Conceptualization of quality practices and customer satisfaction determinants should be considered to the main role to improve organization performance quality.
Methodological Approach
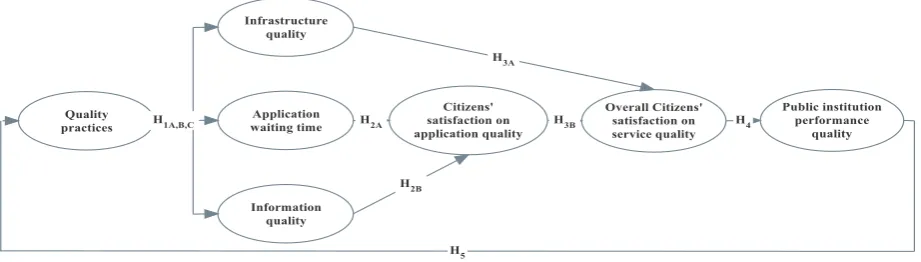
As a result of scientific literature analysis, following research questions were raised: how service quality assurance practices impact citizens’ satisfaction on perceived service quality? And how citizens’ satisfaction on perceived service quality impact public institution’s performance quality? General question, based on secondary data, was split into various hypotheses and constructed into a reference model (see figure 1). From survey instrument and related to Lithuanian public institution practice there were identified three areas to concern:
infrastructure quality; application waiting time; information quality.
Eggert & Ulaga, (2002) proposed that in order to find quality improvement areas both cognitive and affective variables are needed. Causal relationships between variables analysis lead to concentrate attention on the quality improvement areas (Sousa & Voss, 2002). (Kaynak, 2003; Perdomo-Ortiz et al., 2006) argue, that critical connections among quality management practices and citizens’ satisfaction impact public institution performance quality and allow to find new quality improvement practices. Accordingly there were raised and verified five general hypotheses:
H1A,B,C: Quality practices have positive effect on
infrastructure quality, application waiting time, information quality.
(Fynes & Voss, 2001) agreed that formally empirical evidence on the impact of different quality practices on service quality dimensions is not enough. Later (Kaynak, 2003) studied the relationships between quality management practices and various organization performance dimensions. He stated that positive relationships between quality management practices and organization performance quality exist.
H2A,B: Application waiting time, information quality
Pruyn & Smith, (1998) argue that improved waiting time and environment attractiveness could reduce negative effects on satisfaction. (Kim et al., 2008:4) describe that “distinction between objective measures of decision quality and subjective measures of choice satisfaction is particularly important, because the mechanisms responsible for positivity effects may produce differences in subjective choice satisfaction”. (Lee & Lambert, 2000) research results showed that discrepancy between waiting time and perceived waiting time influences customers estimation of service quality and customer satisfaction. Information quality usually is described as a multi-dimensional concept. Many organizations neglect the importance of information quality because of perceiving it not as an organizational issue, but rather as an isolated problem (Caballero et al., 2008). Organizations should evaluate and improve information quality used by critical business processes, especially evaluating service quality aspects. (Khristianto & Suyadi, 2012) state, that information quality is uni-directive and has significant effect on customer satisfaction. Relationship between variables shows that higher
information quality would bring higher customer satisfaction rates.
H3A,B: Infrastructure quality, citizens’ satisfaction on
application quality have a positive effect on overall citizens’ satisfaction on service quality.
Kiplel & Otiso, (2012) research results showed that infrastructure quality is accepted as a critical factor in ensuring service quality as well as citizens’ satisfaction on application quality.
H4: Overall citizens’ satisfaction on service quality has a positive effect on public institution performance quality.
Relationship between customer satisfaction and organization performance quality was discussed by many researchers. (Fynes & Voss, 2001) argue that business complexity needs to analyse various contributors to business performance. (Wiele et al., 2002) indicated that service quality really can make an impact on business results. Empirical evidences do not support customers’ opinion about changing organization performance quality especially in the case of non-profitmaking public institutions.
H5: Public institution performance quality has a positive effect on usage of quality practices.
Figure 1. Reference Model
In terms of quality and innovation there is a positive relationship between quality practices and organization performance (Nair, 2006; Prajogo & Sohal, 2006). The research made by (Prajogo & Sohal, 2006) presented the results on quality management relationship with quality performance. The authors argue that from a theoretical point of view it is expectable, that quality performance results variance could be explained by quality management practices if these were developed to achieve better organization quality performance results. Visible and positive results of implemented quality practice encourage organizations to improve their quality by using new quality management methods.
Hypotheses were tested using descriptive statistics, reliability and path analysis, which gives insights into the causal ordering of variables in a system of relationships. Reliability analysis as a measurement instrument determines relationships between multidimensional questions. For reliability testing there was chosen Cronbach’s α. Cronbach’s α provides a reliability coefficient (Gliem & Gliem, 2003). It is used to describe factors reliability extracted from multidimensional questionnaire, with chosen Likert rating scale. Cronbach’s α is expressed as a number between 0 and 1 (Gliem & Gliem, 2003). If Cronbach’s α coefficient is
closer to 1.0, then internal consistency of the items are greater.
Path analysis enables to estimate interrelationships between variables in a single framework based on the same decision context (Oh, 1999). To estimate path coefficients path analysis decomposes relationships between determinants. Path coefficients could be equated to regression coefficients (Muthen & Muthen, 2007). Path analysis conduces to decompose statistical relationships between determinants, counts inter – correlations, assesses sustain effects on depended variables, to measure effects of dependent variables.
Findings
First area to concern was infrastructure quality. During application waiting time analysis there were covered two types of information: admission waiting time and service contribution time. Information area covered the questions about proper information and ability to understand. All used
determinants were measured using 5 point Likert scale “1-strongly agree, 4- disagree, 5 – do not know”.
Determinants of reference model variables, sources and Cronbach’s α coefficients are shown in Table 1.
Table 1
Determinants of Reference Model Variables, Sources and Cronbach’s α, Meant and SD Coefficients
Construct variable Determinants α SD
Quality practices Used quality practices helps to provide service 0,845 1,495
Infrastructure quality Possibility to find required officer 0,781 0,816
Application waiting time Admission waiting time 0,768 0,905
Service contribution time 0,957
Information quality Received required information 0,767 0,908
Perspicuous information 0,927
Citizens’ satisfaction on application quality Satisfaction on application quality 0,765 0,976
Overall citizens’ satisfaction on service quality Satisfaction on service quality 0,757 0,938
Public institution performance quality Performance quality 0,845 0,986
Cronbach’s α was calculated for all construct variables and it values an excess of 0,7. Concern to α values (coefficient is closer to 1.0) the results were accepted.
Variability of determinants is small (from 0,816 to 1,495), but its analysis are crucial to understanding and explaining possible causes.
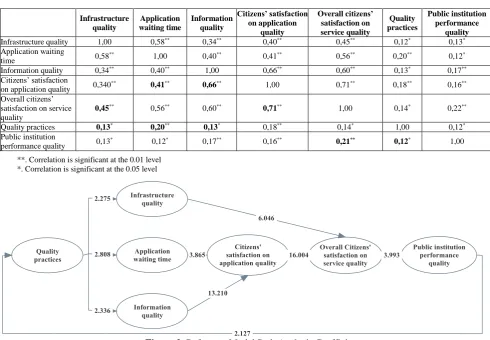
Correlation coefficients to test hypothesis (see Table 2, numbers shown in bold) at 1 % significant level are greater than 0,12 and at 5 % significant level are greater than 0,20.
In order to meet Path analysis (Heise, 1972) and standard normal distribution (Walpole, 1974) requirements all determinants were standardized. Other determinants as age, gender did not affect regression coefficients significantly.
The results of path analysis are shown in Figure 2 and Table 3. T–value was calculated to test significance of each causal path. Hypothesized relationships H1B, H2A,B, H3A,B,
H4 were statistically significant at p<0,05, t-value>1,96, H1A,C H5 were statistically significant at p<0,01.
Table 2
Reference Model Correlation Matrix
Infrastructure quality
Application waiting time
Information quality
Citizens’ satisfaction on application
quality
Overall citizens’ satisfaction on service quality
Quality practices
Public institution performance
quality
Infrastructure quality 1,00 0,58** 0,34** 0,40** 0,45** 0,12* 0,13*
Application waiting
time 0,58
** 1,00 0,40** 0,41** 0,56** 0,20** 0,12*
Information quality 0,34** 0,40** 1,00 0,66** 0,60** 0,13* 0,17**
Citizens’ satisfaction
on application quality 0,340
** 0,41** 0,66** 1,00 0,71** 0,18** 0,16**
Overall citizens’ satisfaction on service quality
0,45** 0,56** 0,60** 0,71** 1,00 0,14* 0,22**
Quality practices 0,13* 0,20** 0,13* 0,18** 0,14* 1,00 0,12*
Public institution
performance quality 0,13
* 0,12* 0,17** 0,16** 0,21** 0,12* 1,00
**. Correlation is significant at the 0.01 level *. Correlation is significant at the 0.05 level
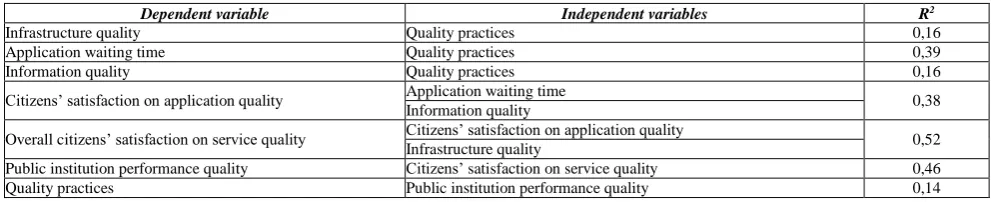
Table 3
Reference Model Determination Coefficients
Dependent variable Independent variables R2
Infrastructure quality Quality practices 0,16
Application waiting time Quality practices 0,39
Information quality Quality practices 0,16
Citizens’ satisfaction on application quality Application waiting time 0,38
Information quality
Overall citizens’ satisfaction on service quality Citizens’ satisfaction on application quality 0,52
Infrastructure quality
Public institution performance quality Citizens’ satisfaction on service quality 0,46
Quality practices Public institution performance quality 0,14
H1A,B,C: Quality practices have positive effect on
infrastructure quality, application waiting time, information quality.
(Fynes & Voss, 2001) provided rigorous statistical procedure and analysis of the quality practices effect on design quality in business environment. This study provided strong support to the impact of quality practices to detailed quality determinants in public institutions’ environment. Hypotheses are significant: 16 % variation in infrastructure quality, 39 % variation in application waiting time and 16 % variation in information quality could be explained by quality practices.
H2A,B: Application waiting time, information quality
have a positive effect on citizens’ satisfaction and on application quality.
Both hypotheses are significant and 38 % of citizens’ satisfaction on application quality could be explained by application waiting time and information quality. Information quality refers to the quality of outputs that produces public institution service. Findings support arguments that citizens’ perceived waiting time (Lee & Lambert, 2000) and information quality (Gorla et al., 2010) influence citizens’ estimation of application quality, which partly influences validation of H3A hypothesis.
H3A,B: Infrastructure quality, citizens’ satisfaction on
application quality have a positive effect on overall citizens’ satisfaction on service quality.
Positive effect of infrastructure quality, citizens’ satisfaction on application quality and overall citizens’ satisfaction on service quality is supported. 52 % of overall customers’ satisfaction variation could be explained by infrastructure quality and citizens’ satisfaction on application quality. These findings show more complex way to evaluation of overall public institutions service quality and its’ contribution to organization performance.
H4: Overall citizen’ satisfaction on service quality has a positive effect on public institution performance quality.
Overall citizen’ satisfaction on service quality and public institution performance quality is strongly supported. This finding approves previous studies on business environment and adds new insights on public institutions’ environment. Empirical evidence made by this research supports the importance of citizens’ estimation about changing organization performance quality.
H5: Public institution performance quality has a positive effect on usage of quality practices.
Relationship between public institution performance quality and quality practices usage is significant at 14 % variation level. It indicates that from the citizens’ point of
view changing public institutions’ performance quality encourages to use more quality practices which could be indicated as growing citizens’ satisfaction or service quality and organization performance quality as well.
According to the main role of quality practices and citizens’ satisfaction on perceived service quality, operationalized theoretical model is supported by the statistical results.
Discussion and Conclusions
In terms of operationalization of public institutions’ quality dimensions, this research incorporates quality practises and citizens’ satisfaction on perceived service quality as main dimensions of public institution performance quality. Previous studies (Fynes & Voss, 2001; Kaynak, 2003; Wiele et al., 2002) had paid attention to customers’ satisfaction deconstruction in business environment. Relationships between public institutions’ quality practices and citizens’ satisfaction on service and performance quality were not previously tested. This study sets out to accomplish the main goal – to conceptualize public institutions’ quality performance.
Developed reference quality model provides dependent and independent quality dimensions identified by the state of the art review, using objective metrics and taking into account primary research data. Developed reference quality model could be used of all public service providers.
Research results have proved the importance of public institution performance quality to the usage of quality practices. This finding substantiates an argument that higher level public institutions’ performance quality could influence the public institutions’ intensions to use more quality practices that could be described as a consequence of a growing citizens’ satisfaction and performance quality as well.
The research results also proved some clear indications for the Lithuanian public institutions’ quality management practice. The first indication is the need to recognize the importance of the usage of quality practices. Variety of used quality management tools (one window principle, ISO 9000, Common Assessment Framework, ISO 17020, ISO 17025 and etc.) shows the lack of quality management common approach. The research results proved that it is important to focus on quality practices that have a direct impact on infrastructure quality, application waiting time and information quality.
improvement solutions. Such finding requires elaborating more detail research in the future.
There are some limitations associated with this research. During the research citizens were invited to evaluate only one quality management tool. So this research was restricted by limitations of secondary data.
On the basis of this study a longitudinal research from the public institutions’ employees’ side could provide valuable contributions to the public service quality
management theory, which could help to present and compare performance quality results from different point of view. Further research could evaluate the changes between measured variables relationships in a period of time.
Public institutions’ performance quality measurement is an ongoing process. This paper provides new analysis possibility testing the relationships between public institutions’ service quality indicators and allows to benchmark results among public institutions.
References
Abdullah, H. S., & Kalianan, M. (2008). From customer satisfaction to citizen satisfaction: rethinking local government service delivery in Malaysia. Asian Social Science, 4 (11), 87–92.
Alford, J. (2002). Defining the client in the public sector: A social‐exchange perspective. Public administration review, 62(3), 337–346. http://dx.doi.org/10.1111/1540-6210.00183
Andrews, R., Boyne, G. A., & Walker, R. M. (2011). The impact of management on Administrative and survey measures of organizational performance. Public Management Review, 13(2), 227–255. http://dx.doi.org/10.1080/14719037. 2010.532968
Bouckaert, G., & Van de Walle, S. (2003). Comparing Measures of Citizen Trust and User Satisfaction as Indicators of “Good Governance”: Difficulties in Linking Trust and Satisfaction Indicators. International Review of Administrative Sciences 69(3), 329–343.
Brown, T. (2007). Coercion versus Choice: Citizen Evaluations of Public Service Quality across Methods of Consumption. Public Administration Review 67(3), 559–572. http://dx.doi.org/10.1111/j.1540-6210.2007.00737.x
Caballero, I., Caro, A., Calero, C., & Piattini, M. (2008). IQM3: Information Quality Management Maturity Model. J. UCS, 14(22), 3658–3685.
Denhardt, R. B., & Denhardt, J. V. (2000). The new public service: Serving rather than steering. Public administration review, 60(6), 549–559. http://dx.doi.org/10.1111/0033-3352.00117
Eggert, A., & Ulaga, W. (2002). Customer perceived value: a substitute for satisfaction in business markets?. Journal of Business & industrial marketing, 17(2/3), 107–118. http://dx.doi.org/10.1108/08858620210419754
Eggink, M. (2012). Innovation System Performance: How to Address the Measurement of a System's Performance. Journal of Innovation & Business Best Practices, 1–9. http://dx.doi.org/10.5171/2012.593268
Eng, T. Y., & Niininen, O. (2005). An Integrative Approach to Diagnosing Service Quality of Public Parks. Journal of Services Marketing 19(2), 70–80. http://dx.doi.org/10.1108/08876040510591385
Fynes, B., & Voss, C. (2001). A path analytic model of quality practices, quality performance, and business performance. Production and Operations Management, 10(4), 494–513. http://dx.doi.org/10.1111/j.1937-5956.2001.tb00089.x Gliem, J. A., & Gliem, R. R. (2003). Calculating, interpreting, and reporting Cronbach’s alpha reliability coefficient for
Likert-type scales. Midwest Research-to-Practice Conference in Adult, Continuing, and Community Education. Goodsell, Ch. T. (1983). The case of bureaucracy. Chatham, New York: Chatham House.
Gorla, N., Somers, T. M., & Wong, B. (2010). Organizational impact of system quality, information quality, and service quality. The Journal of Strategic Information Systems, 19(3), 207–228. http://dx.doi.org/10.1016/j.jsis.2010.05.001 Halaris, C., Magoutas, B., Papadomichelaki, X., & Mentzas, G. (2007). Classification and synthesis of quality approaches
in e-government services. Internet Research, 17(4), 378–401. http://dx.doi.org/10.1108/10662240710828058
Heise, D. R. (1972). Employing nominal variables, induced variables, and block variables in path analyses. Sociological Methods & Research, 1(2), 147–173. http://dx.doi.org/10.1177/004912417200100201
Holzer, M., Charbonneau, E. & Kim, Y. (2009). Mapping the terrain of public service quality improvement: twenty-five years of trends and practices in the United States. International Review of Administrative Sciences, 75(3), 403–418. http://dx.doi.org/10.1177/0020852309341330
Homburg, C., Artz, M., & Wieseke, J. (2012). Marketing Performance Measurement Systems: Does Comprehensiveness Really Improve Performance? Journal of Marketing, 76(3), 56–77. doi:10.1509/jm.09.0487http://dx.doi.org/10. 1509/jm.09.0487
Jiang, Y., Shang, J., & Liu, Y. (2010). Maximizing customer satisfaction through an online recommendation system: A novel associative classification model. Decision Support Systems, 48(3), 470–479. http://dx.doi.org/10.1016/ j.dss.2009.06.006
Kelly, J. & Swindell, D. (2002). A multiply-indicator approach to municipal service evaluation: correlating performance measurement and citizen satisfaction across jurisdictions. Public Administration Review, September/October, 62(5), 610–621. http://dx.doi.org/10.1111/1540-6210.00241
Kim, S., Healey, M. K., Goldstein, D., Hasher, L., & Wiprzycka, U. J. (2008). Age differences in choice satisfaction: A positivity effect in decision making. Psychology and aging, 23(1), 33. http://dx.doi.org/10.1037/0882-7974.23.1.33 Kiplel, M. C., & Otiso, K. N. (2012). The Effects of Customer Service on the Development of E-Commerce at Kenya
Commercial Bank Eldoret Branch. European Journal of Business and Management, 4(21), 181–187.
Khristianto, W., & Suyadi, I. (2012). The Influence of Information, System Quality, and Service Quality on CustomerSatisfaction and Loyalty in Online Shopping. Available from internet: http://www.academia.edu/ 2313509/The_Influence_of_Information_System_Quality_and_Service_Quality_on_Customer_Satisfaction_and_Loyal ty_in_Online_Shopping_International_Journal_of_Academic_Research_IJAR_Vol._4_No.2_2012
Lane, J. E. (2001). Viesasis sektorius, Vilnius: Margi rastai.
Lee, W., & Lambert, C. U. (2000). Impact of waiting time on evaluation of service quality and customer satisfaction in foodservice operations. Foodservice Research International, 12(4), 241–254. http://dx.doi.org/10.1111/j.1745-4506.2000. tb00021.x
McDonald C., & Vangelder, P. (1998). ESOMAR: Handbook of Market and Opinion Research. Amsterdam: Esomar. Merkys, G., & Braziene, R. (2009). Evaluation of public services provided by municipalities in Lithuania: an experience of
applying a standardized survey inventory. Social Sciences, 4(66), 50–61.
Merriam-Webster's collegiate dictionary (11th ed.). (2005). Springfield, MA: Merriam-Webster. Muthen, L., & Muthen, B. (2007). Mplus. Statistical analysis with latent variables. Version, 3.
Nair, A. (2006). Meta-analysis of the relationship between quality management practices and firm performance— implications for quality management theory development. Journal of Operations Management, 24(6), 948-975. http://dx.doi.org/10.1016/j.jom.2005.11.005
Oh, H. (1999). Service quality, customer satisfaction, and customer value: A holistic perspective. International Journal of Hospitality Management, 18(1), 67–82. http://dx.doi.org/10.1016/S0278-4319(98)00047-4
Oliver, R. L., & Linda, G. (1981). Effect of satisfaction and its antecedents on consumer preference and intention. Advances in Consumer Research, 8(1), 88–93. http://dx.doi.org/10.2307/3150499
Oliver, R. L. (1980). A Cognitive Model of the Antecedents and Consequences of Satisfaction Decisions. Journal of Marketing Research, 17(4), 460–469.
Parasuraman, A., & Grewal, D. (2000). Serving customers and consumers effectively in the twenty-first century: A conceptual framework and overview. Journal of the Academy of Marketing Science, 28(1), 9–16. http://dx.doi.org/10. 1177/0092070300281001
Parasuraman, A., Zeithaml, V. A., & Berry, L. L. (1985). ‘A Conceptual Model of Service Quality and its Implications for Future Research. Journal of Marketing 49(4), 41–50. http://dx.doi.org/10.2307/1251430
Parker, C., & Mathews, B. P. (2001). Customer satisfaction: contrasting academic and consumers’ interpretations. Marketing Intelligence & Planning. 19(1), 38–44. http://dx.doi.org/10.1108/02634500110363790
Perdomo-Ortiz, J., Gonzalez-Benito, J., & Galende, J. (2006). Total quality management as a forerunner of business innovation capability. Technovation, 26(10), 1170–1185. http://dx.doi.org/10.1016/j.technovation.2005.09.008 Prajogo, D. I., & Sohal, A. S. (2006). The relationship between organization strategy, total quality management (TQM), and
organization performance––the mediating role of TQM. European Journal of Operational Research, 168(1), 35–50. http://dx.doi.org/10.1016/j.ejor.2004.03.033
Pruyn, A., & Smidts, A. (1998). Effects of waiting on the satisfaction with the service: Beyond objective time measures. International Journal of Research in Marketing, 15(4), 321–334. http://dx.doi.org/10.1016/S0167-8116(98)00008-1 Roch, C. H., & Poister, T. H. (2006). Citizens, Accountability, and Service Satisfaction: The Influence of Expectations.
Urban Affairs Review 41(3), 292–308. http://dx.doi.org/10.1177/1078087405281124
Rybakovas, E., Liugailaite-Radzvickiene, L., & Sajeva, S. (2012). Objectively measured quality of life: the case of Lithuanian municipalities. Social Sciences, 4(78), 7–21.
Sajeva, S., Rybakovas, E., & Liugailaite-Radzvickiene, L. (2012). Subjectively evaluated quality of life: the case of largest cities of Lithuania. Social Sciences, 4(78), 22–34.
Sirgy, M. J., Rahtz, D. R., Cicic, M., & Underwood, R. (2000). A Method for Assessing Residents’ Satisfaction with Community-based Services: A Quality-of-life Perspective. Social Indicators Research 49(3), 279–316. http://dx.doi.org/10.1023/A:1006990718673
Spreng, R. A., & Olshavsky, R. W. (1993). A desires-as-standard model of consumer satisfaction: implications for measuring satisfaction. Journal of Consumer Satisfaction, Dissatisfaction and Complaining Behavior, 5(1), 169–177.
Stradling, S. G., Anable, J., & Carreno, M. (2007). Performance, Importance and User Disgruntlement: A Six-step Method for Measuring Satisfaction with Travel Modes. Transportation Research, 41(1), 98–106. http://dx.doi.org/10.1016/ j.tra.2006.05.013
Stumbraite–Vilkisiene, E. (2010). Viesosios paslaugos dalyviu kaip kokybes vertintoju samprata: pilietis – vartotojas. Jaunuju mokslininku darbai, 4(29), 148–156.
Trevor B. (2007). Coercion versus Choice: Citizen Evaluations of Public Service Quality across Methods of Consumption. Public Administration Review, 67(3), 559–572. http://dx.doi.org/10.1111/j.1540-6210.2007.00737.x
Van der Wiele, T., Boselie, P., & Hesselink, M. (2002). Empirical evidence for the relationship between customer satisfaction and business performance. Managing Service Quality, 12(3), 184–193. http://dx.doi.org/10.1108/09604 520210429259
Van Ryzin, G. G., & Immerwahr, S. (2004). Derived Importance–Performance Analysis of Citizen Survey Data. Public Performance and Management Review, 27(4), 144–173.
Van Ryzin, G.G., & Immerwahr, S. (2007). Importance–Performance Analysis of Citizen Satisfaction. Public Administration, 85(1), 215–226. http://dx.doi.org/10.1111/j.1467-9299.2007.00641.x
Van Ryzin, G. G., Muzzio, D., Immerwahr, S., Gulick, L., & Martinez, E. (2004b). Drivers and Consequences of Citizen Satisfaction: An Application of the American Customer Satisfaction Index Model to New York City. Public Administration Review, 64(3), 331–341. http://dx.doi.org/10.1111/j.1540-6210.2004.00377.x
Van Ryzin, G. G., & Charbonneau, E. (2010). Public service use and perceived performance: an empirical note on the nature of the relationship. Public Administration, 88(2), 551–563. http://dx.doi.org/10.1111/j.1467-9299.2010. 01820.x Vilmorus. (2009). Valstybes ir savivaldybes instituciju aptarnavimo kokybes verinimo klausimynas. Available from internet:
http://www.lidata.eu/data/quant/LiDA_LVP_0204/OTHER.001
Walpole, R. E. (1974). Introduction to statistics (p. 340). New York: Macmillan.
Wixom, B. H., & Todd, P. (2005). A theoretical integration of user satisfaction and technology acceptance. Information Systems Research, 16(1), 85–102. http://dx.doi.org/10.1287/isre.1050.0042
Yang, K., & Holzer, M. (2006). The Performance–Trust Link: Implications for Performance Measurement. Public Administration Review 66(1), 114–126. http://dx.doi.org/10.1111/j.1540-6210.2006.00560.x