ISSN 0975-928X
Research Article
Genetic diversity analysis for productivity enhancement through
desi-kabuli
introgression breeding in chickpea
H.B. Santosh*12, C. Bharadwaj1, S. Santosh2, K.P. Raghavendra2 and J. Kumar1 1
ICAR – Division of Genetics, Indian Agricultural Research Institute (IARI), New Delhi 110 012, India
2
ICAR – Central Institute for Cotton Research (CICR), Nagpur 440 010, Maharashtra, India
E-mail: santoshgpb@gmail.com
(Received: 30 May 2016; Revised: 15 March 2017; Accepted: 23 March 2017)
Abstract
Desi and kabuli are two seed types within the cultivated chickpea, having great contrast for various plant architectural and yield component traits. To obtain the basic information needed for advocated desi-kabuli introgression breeding for productivity enhancement in chickpea, 65 chickpea genotypes comprising both desi and kabuli belonging to bold and medium seed size categories were assessed for genetic variability for various yield component traits. Significant variability was observed for all the characters among the germplasm studied. Correlation analysis revealed highly significant positive genetic association of seed yield per plant with total branches per plant, pods per plant and 100 seed weight. Seed weight and pods per plant contributed maximum to the total genetic divergence as per Tocher’s method. The studied germplasm was grouped into 9 clusters based on genetic distance. Genetic divergence pattern through factorial coordinate analysis revealed existence of considerable genetic diversity both between and within desi and kabuli, and medium and bold seeded genotypes, and the pattern of divergence was more distinct for seed size compared to seed type. The information on genetic divergence, association among yield component traits and the identified, diverse medium and bold seeded, desi and kabuli
genotypes will be of immense utility for improvement of productivity and seed size in chickpea.
Key words
Chickpea, diversity, desi, kabuli, introgression
Introduction
Plant breeders need to focus more on the approaches with the greatest potential to increase the crop yields as assuring the food and nutritional security to the expected 170.5 crore Indian population by 2050 will be highly challenging particularly, in face of prevailing hunger and malnutrition, shrinking natural resources and evident climate change. Pulses are important source of proteins for majority of the population and hence, are the major component of nutritional food security. Though, India is the largest producer of pulses, it imports more than 10000 crores worth pulses annually to meet the domestic consumption. Chickpea (Cicer arietinum L.) is an important winter crop with significant contribution to Indian pulse economy. India produces 8.83 mt of chickpea from an area of 9.60 mha thus, contributing more than 65 per cent to the global chickpea area (13.54 m ha) and production (13.10 m t). With a productivity of 920 kg/ha, India ranks 36th among 57 chickpea growing countries, and 8th among 10 major chickpea producers (FAOSTAT, 2013). Hence, it is imperative to enhance the productivity potential of chickpea to achieve self-sufficiency in pulses.
Narrow genetic base in chickpea due to the evolutionary bottlenecks is the major impediment for its genetic improvement. Bringing new variation from secondary gene pool has met with limited success owing to the post zygotic inter-specific crossability barriers. Within the primary gene pool, desi and kabuli represents two distinct
seed types classified based on seed size (Moreno and Cubero, 1978). Apart from differences for botanical characters, desi and kabuli chickpeas differ for various plant architectural and yield component traits (Yadav et al., 2004; Upadhyaya et al., 2007). Desi types with higher number of branches, seeds per pod and pods per plant along with wilt, salinity, drought and heat tolerance, and kabuli types with larger pod size, seed size, tall erect plant type along with cold and iron induced chlorosis tolerance can benefit from the introgression of desirable genes from each other (Hawtin and Singh, 1980; Yadav et al., 2004). These diverse intra-specific groups with no hybridization barriers offer ample scope for transgressive breeding and holds immense promise for productivity enhancement in chickpea (Bahl 1980; Muehlbauer et al., 1989; Yadav et al., 2004; Gaur et al., 2007, Singh and Singh, 2016).
ISSN 0975-928X
Materials and methods
In the present investigation, 65 true breeding chickpea genotypes (35 released varieties, 16 breeding lines, 8 genetic stocks and 6 landraces) belonging to desi and kabuli seed types varying for seed size (Table 1) were evaluated in a Randomized Complete Block Design with three replications for various yield and yield attributing traits at Indian Agricultural Research Institute, New Delhi (228.61m altitude over mean sea level, latitude 28008’N and longitude 77012’E). Each genotype was grown in a single row of four meters length and inter- and intra- row distance were kept at 30 and 10 cm, respectively. The recommended package of practices was followed to obtain proper plant stand. The observations were recorded in each replication on five randomly chosen plants for plant height (cm), number of primary and total branches, pods per plant, seed yield per plant (g) and 100-seed weight (g). The days to 50 per cent flowering and days to maturity were observed row-wise while, the number of seeds from 5 randomly chosen pods were counted and expressed as seeds per 5 pods. Character-wise mean values for each replication were used for, diversity analysis using Mahalanobis D2 statistic, assessment of per cent contribution of individual traits towards genetic diversity using Tocher’s method and estimation of phenotypic and genotypic correlation coefficients, employing WINDOSTAT (ver. 8.5) statistical package. The mean Euclidean distance based genetic dissimilarity matrix was used for factorial coordinate analysis using DARwin software version 5.0.158.
Results and discussion
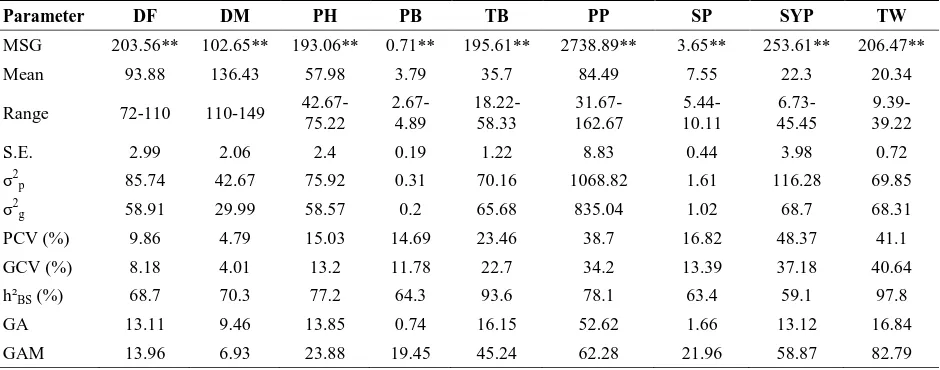
The analysis of variance revealed significant differences for all traits studied (Table 2), indicating existence of sufficient diversity among the genotypes which can be utilized to combine the desirable characters through desi-kabuli introgression breeding. High phenotypic coefficient of variability (PCV) and genotypic coefficient of variability (GCV) values coupled with high heritability and genetic advance were observed for seed yield per plant, 100 seed weight and pods per plant indicating the presence of additive gene action hence, selection may be more effective in such cases. While, days to maturity, days to 50% flowering and plant height recorded lower PCV, GCV and genetic advance indicating influence of environment on these traits. Highest heritability (97.8 %) was recorded for 100-seed weight, followed by total number of branches (93.6 %) revealing lesser environmental influence on expression of these traits. The lowest genetic advance as per cent of mean (GAM) was observed for days to maturity (6.93 %) followed by days to 50% flowering (13.96 %) while highest GAM was recorded for seed weight (82.79 %) followed by pod number per plant (62.28 %) indicating significance of these traits in breeding for higher
productivity. These findings are in congruence with the reports of Yadav et al. (2015), Desai et al., (2015) and Singh (2016).
Phenotypic and genotypic correlation coefficients among yield and yield attributing characters were computed and presented in table 3. The values of the phenotypic correlations were in accordance with the genotypic correlations which reflected the true contribution of genotype to the trait expression. The seed yield per plant had highly significant positive association with total branches per plant (0.46 and 0.45), pods per plant (0.62 and 0.62) and 100-seed weight (0.38 and 0.38) at phenotypic and genotypic level, respectively. At genotypic level, seeds per 5 pods was found to have a significant positive correlation with total branches per plant (0.47) and pods per plant (0.51) while, total branches per plant had significant positive correlation with pods per plant (0.59) and primary branches per plant (0.38). These findings are in general agreement with earlier reports of Farshadfar and Farshadfar (2008) and Sewak et al. (2012). Direct selection for seed yield is not often fruitful because of its quantitative inheritance with high influence of environment. So, the information on genetic association among yield component traits will be useful for the breeders in making indirect selection for yield.
The contribution of each trait to the total divergence was worked out using Tocher’s method and is presented in table 4. It was observed that 100-seed weight and pods per plant with high GCV (40.64 % and 34.2 %) and PCV (41.1 % and 38.7 %) contributed 49.9 % and 41.97 % towards total divergence, respectively. 100 seed weight ranked first 1038 times in 2080 total combinations while pods per plant ranked first in 873 times, together accounting for more than 90 % of total genetic divergence. Variation for primary branches per plant was observed to be low which contributed least (0.05 %) to the total divergence. Seed weight and pod number were reported to predominantly contribute to genetic divergence in chickpea (Prakash and Shekhawat, 2012 and Kuldeep et al., 2015) while, Parashi et al. (2013) reported that seed yield per plant and number of pods per plant contributes maximum to genetic diversity.
ISSN 0975-928X
except FLIP90-166 which is a kabuli genotype having medium seed size. Majority of genotypes in cluster II and IV were bold seeded genotypes except BG1073 (in cluster II), Pusa267, Pusa1103, BGD128 and Pusa1088 (in cluster IV). Clusters VI, VII and VIII contained only bold seeded kabuli genotypes except a bold seeded desi genotype DG5046 in Cluster VII. A medium seeded desi genotype Pusa209 was clustered separately.
Factorial coordinate analysis provides overall representation of diversity unlike tree methods which tend to faithfully represent the individual relations. Genetic divergence pattern through factorial analysis revealed existence of considerable genetic diversity both between and within desi and kabuli, and medium and bold seeded genotypes (Fig. 1). Divergence pattern was more distinct between bold and medium seeded chickpea genotypes where in almost all the bold seeded chickpea genotypes predominated the upper part of the first and second quarter in the factorial coordinate graph (rectangle in Fig. 1). The prominent seed size based clustering observed in the present study is due the highest contribution of 100-seed weight towards total genetic divergence among the genotypes (Table 4). Exceptions to this closer grouping were possibly due to variation in others productivity component traits contributing to the genetic divergence and past breeding efforts targeted to combine seed size of kabuli with vigour and adaptability of desi types (Yadav et al., 2015). Within bold seeded genotypes, the closer clustering was also observed among kabuli and desi genotypes (dotted ovals in Fig. 1). Prakash (2006) did not found any relationship between seed size and clustering pattern while studying genetic divergence among 81 kabuli chickpea. Clustering pattern showed some equivalence with pedigree and source albeit there were exceptions. Closer clustering of DG5042, DG5049 and DG5066 with its parent SBD377 indicated the influence of pedigree while majority of the genotypes in cluster IV were developed from IARI revealing the influence of source. On contrary, GNG663 and GNG469 though shared the pedigree and source, they were grouped in different clusters. These disagreements were possibly due to use of diverse material in breeding programme across different centres. The Euclidean based clustering has been employed by Almajali et al. (2012) and Zivkovic et al. (2012) for grouping of fig and alfalfa germplasm, respectively.
The maximum intra-cluster distance (658.75) was recored for cluster V (Table 6), indicating that 14 genotypes of the cluster which consisted of two kabuli and twelve desi chickpea genotypes were most divergent vis-à-vis rest of the genotypes. Maximum inter-cluster distance was recorded between cluster VIII and IX (12585.42) followed by cluster II and IX (8340.47) suggesting the
existence of maximum diversity between them (II, VIII and IX). Highest seed weight (39.87) was recorded for cluster VIII having bold seeded kabuli variety, KAK 2 and distinct grouping of variety Pusa209 from the rest of medium seeded genotypes in cluster IX might be because of the lower seed weight (10.67) (Table 5 & 7). The minimum intra-cluster distance (279.58) was noted within cluster I indicating the genotypes of the cluster share more similarity while least inter-cluster distance (822.29) was found between cluster II and VIII revealing lesser diversity. Prakash (2006), Prakash and Shekhawat (2012), Parashi et al. (2013) and Kuldeep et al. (2015) employed D2 analysis to assess the genetic divergence and to group the chickpea genotypes. The most divergent genotypes belonging to cluster II (DG 5042, DG 5066, MPJGK 3, DG 5049, BG 1073, SBD 377, Phule G-0516, Pusa 256), VIII (KAK 2) and IX (Pusa 209) could be utilized as parents in desi-kabuli introgression breeding programme.
Apart from seed yield, seed size is also an important trait of breeders’ interest as larger seed size fetches premium price in domestic and international markets, and varieties with larger seed size are known to be high yielding than medium seeded varieties both in desi and kabuli chickpea (Yadav et al., 2004, Gnyandev et al., 2015). We identified most diverse desi bold (DG 5049, DG 5042, DG 5066), desi medium (Pusa 209, Pusa 372, Pusa 261, JG 62), kabuli bold (KAK 2, MPJGK 3, Pusa 2024, Pusa 1053), and kabuli medium (ILC 202, Flip 90-166) seeded chickpea genotypes which can be used in different cross combinations for improvement of productivity and seed size in future desi-kabuli introgression breeding. We also emphasize the utility of 100-seed weight and pod number with high heritability and genetic advance, having significant positive genetic association with seed yield as selection criteria in desi-kabuli introgression breeding.
Acknowledgement
Financial support in the form of INSPIRE Fellowship provided to the first author for his PhD programme by Department of Science and Technology, Government of India is gratefully acknowledged. Authors thank Director and Joint-Director (Research) of IARI, New Delhi for providing required facilities.
References
Almajali, D., Abdel-Ghani, A.H. and Migdadi, H. 2012. Evaluation of genetic diversity among Jordanian fig germplasm accessions by morphological traits and ISSR markers. Sci. Hort.,147:8-19. Bahl, P.N. 1980. Kabuli–desi introgression and genesis
ISSN 0975-928X
Smithson, J.B. (Eds.) 28 Feb-2 Mar 1979, Hyderabad, pp. 75-80.
Desai, K., Tank, C.J., Gami, R.A., Patel, A.M. and Chauhan, R.M. 2015. Genetic variability in indigenous collection of chickpea (Cicer arietinum L.) genotypes for seed yield and quality traits. J. Prog. Agr.,6(1): 10-13.
FAOSTAT. 2013. Food and Agriculture Organization of the United Nations, Crop Production Statistics available at http://faostat.fao.org; accessed on 05 May 2016.
Farshadfar, M. and Farshadfar, E. 2008. Genetic variability and path analysis of chickpea (Cicer arietinum) landraces and lines. J. Appl. Sci., 8: 3951-3956.
Gaur, P.M., Gowda, C.L.L., Knights, E.J. et al. 2007. Breeding achievements. In: Chickpea breeding and management, Yadav, S.S., Redden, R., Chen, W. and Sharma, B. (Eds). CABI, Wallingford, pp 391-416.
Gaur, P.M. Samineni, S. Sajja, S. and Chibbar, R.N. 2015. Achievements and challenges in improving nutritional quality of chickpea. Legume Perspect., 9:31-33.
Gnyandev, B., Kurdikeri, M.B. and Salimath, P.M. 2015. Influence of seed size on seed yield and quality in desi and kabuli chickpea varieties. Int. J. Agr. Sci. Res.,5(4):99-104.
Hawtin, G.C. and Singh, K.B. 1980. Kabuli-desi
introgression: problems and prospects. In:
Proceedings of the International Workshop on Chickpea Improvement, 28 Feb-2 Mar 1979, Hyderabad, pp 51-60.
Kuldeep, R., Pandey, S., Babbar, A. and Prakash, V. 2015. Genetic diversity analysis in chickpea grown under heat stress conditions of Madhya Pradesh. Electron. J. Plant Breed., 6(2): 424-433.
Moreno, M. and Cubero, J.I. 1978. Variation in Cicer arietinum L. Euphytica,27: 465-485.
Muehlbauer, F.J., Simon, C.J., Spaeth, S.C. and Haddad, N.I. 1989. Genetic improvement of chickpea: key factors to be considered for a breakthrough in productivity. In: Chickpea in the nineties: Proceedings of the Second International Workshop on Chickpea Improvement, Rheenen, H.A., Saxena, M.C., Walby, B.J. and Hall, S.D. (Eds). ICRISAT, Hyderabad. pp. 209-216. Parashi, V.S., Lad, D.B., Mahse, L.B., Kute, N.S. and
Sonawane, C.J. 2013. Genetic diversity studies in chickpea (Cicer arietinum L.). Bioinfolet, 10(1): 337-341.
Prakash, V. 2006. Divergence analysis in kabuli
chickpea (Cicer arietinum L.) Indian J. Genet. Plant Breed., 66(3): 241-242.
Prakash, V. and Shekhawat, U.S. 2012. Genetic divergence in yield and yield contributing traits in chickpea. J. Prog. Agr.,3(1): 50-51.
Sewak, S., Iquebal, M.A., Singh, N.P., Solanki, R.K. and Sarika, J. 2012. Genetic diversity studies in chickpea (Cicer arietinum) germplasm. J. Food Legumes. 25(1): 31-36.
Singh, D.P. and Singh, B.B. 2016. Varietal improvement of pulse crops in India: Introspection and prospectives. Indian. J. Agr. Sci.,86(1): 3-24. Singh, T. 2016. Estimation of genetic parameters and
character associations for yield and quality traits in chickpea. Indian J. Agr. Res., 50(2): 117-121.
Upadhyaya, H.D., Dwivedi, S.L., Gowda, C.L.L. and Singh, S. 2007. Identification of diverse germplasm lines for agronomic traits in a chickpea (Cicer arietinum L.) core collection for use in crop improvement. Field Crops Res.,
100(2-3): 320-326.
Yadav, P., Tripathi, D.K., Khan, K.K. and Yadav, A.K. 2015. Determination of genetic variation and heritability estimates for morphological and yield traits in chickpea (Cicer arietinum) under late sown conditions. Indian J. Agr. Sci.,85(7): 877-882.
Yadav, S.S., Kumar, J., Turner, N.C., Berger, J., Redden, R., McNeil, D., Materne, M., Knights, E.J. and Bahl, P.N. 2004. Breeding for improved productivity, multiple resistance and wide adaptation in chickpea (Cicer arietinum L.).
Plant Genet. Resour.,4: 181-187.
ISSN 0975-928X
Table 1. List of chickpea genotypes with their type, pedigree and source
S. No. Genotype name Type* Pedigree / Identity Origin / Source
1 DG5042 DB/BL (SBD 377 × BG 1048) × (SBD 377 × BG 362) IARI, New Delhi 2 DG5046 DB/BL (SBD 377 × ICC 4958) × (BG 1032 × SBD 377) IARI, New Delhi 3 DG5047 DB/BL (BG 1073 × ICC 4958) × (BG 391 × SBD 377) IARI, New Delhi 4 DG5048 DB/BL (SBD 377 × ICC 4958) × (BG 1032 × SBD 377) IARI, New Delhi
5 DG5049 DB/BL SBD 377 × BG 1083 IARI, New Delhi
6 DG5066 DB/BL (SBD 377 × BG 1048) × (BG 1032 × SBD 377) IARI, New Delhi 7 SBD 377 DB/GS (ICCV 88109 × PRR 1) × ICC 4958 IARI, New Delhi 8 ICC 4958 DB/GS Jabalpur Gram Chhindwara-1 (JGC-1) JNKVV, Jabalpur (MP)
9 ILC 3279 DB/GS NA NA
10 Pusa 362 DB/RV (BG-203 × P179) × BG-303 IARI, New Delhi
11 Pusa 256 DB/RV (JG 62 × 850-3/27) × (L 550 × H 208) IARI, New Delhi
12 Pusa 391 DB/RV ICC 3935 × P 256 IARI, New Delhi
13 Pusa 5028 DB/RV (SBD 377 × Pusa 362) × (SBD 377 × BGD 72) IARI, New Delhi
14 BGD 72 DB/RV (Pusa 256 × E 100Ym) × Pusa 256 IARI-RS, Dharwad (KAR)
15 Bheema DB/RV NA NA
16 BG 376 DM/BL P 436-2 × BG-274 IARI, New Delhi
17 BG 203 DM/BL P 827 × C 235 IARI, New Delhi
18 BGD 1005 DM/BL BG 303 × Pusa 261 IARI-RS, Dharwad (KAR)
19 IPC 71 DM/BL Breeding line (C. arietinum x C. judaicum) IIPR, Kanpur (UP)
20 PDG84-10 DM/BL NA IIPR, Kanpur (UP)
21 PDG84-16 DM/BL NA IIPR, Kanpur (UP)
22 PG 96006 DM/BL NA MPKV, Rahuri (MH)
23 E100YM DM/BL Mutant of E100YM NA
24 BGD 112 DM/GS (GL 84038 × BG 209) × BG 212 IARI-RS, Dharwad (KAR)
25 ICC 3935 DM/GS P-4636-1 Iran
26 ICC 14669 DM/LR RSW-61 JNKVV, Jabalpur (MP)
27 JG 62 DM/LR Selection from land race JNKVV, Jabalpur (MP)
28 ICC 16903 DM/LR KP 5388 Maharashtra, India
29 ICC 16487 DM/LR BAM-2939(5) Pakistan
30 ICC 5639 DM/LR LUDHIANA-8 PAU, Ludhiana (Punjab)
31 Sadabahar DM/RV Selection from germplasm P108 CSAUA&T, Kanpur (UP)
32 BG 209 DM/RV P 827 (Exotic)× C 235 (Indian) IARI, New Delhi
33 Pusa 1103 DM/RV (Pusa 256 × C. reticulatum) × Pusa 362 IARI, New Delhi
34 Pusa 212 DM/RV P 340 × G 130 IARI, New Delhi
35 Pusa 240 DM/RV BG 303 × P179 IARI, New Delhi
36 Pusa 244 DM/RV (850-3/27 × P 922) × P 9847K IARI, New Delhi
37 Pusa 261 DM/RV P 827 × P 9847 IARI, New Delhi
38 Pusa 372 DM/RV P 1231 × P 1265 IARI, New Delhi
39 ICCV 10 DM/RV (ICCV-2×Surutato 77)× (ICC 7344–1 CC×870026- PB-PB-14P-BP-62AK-7AK-BAK)
ICRISAT, Hyderabad (TS)
40 JG 315 DM/RV Selection from genetic stock, WR 315 JNKVV, Jabalpur (MP)
ISSN 0975-928X
Table 1. Contd.,
S. No. Genotype name Type* Pedigree / Identity Origin / Source
42 SAKI 9516 DM/RV (H82-2 × E100ym) × Bhima JNKVV, Jabalpur (MP)
43 ICCV 4516 DM/RV NA NA
44 C 235 DM/RV IP 58 × C 1234 PAU, Ludhiana (Punjab)
45 RSG 44 DM/RV GL 769 × GNG 146 RAU, Durgapur (RJ)
46 RSG 143-1 DM/RV NA RAU, Durgapur (RJ)
47 GNG 469 DM/RV Annigeri × H 75-35 RAU, Sriganganagar (RJ)
48 GNG 663 DM/RV GNG 16 × Annigeri 1 RAU, Sriganganagar (RJ)
49 MPJGK-3 KB/BL NA JNKVV, Jabalpur (MP)
50 Phule-G-0516 KB/BL NA MPKV, Rahuri (MH)
51 BG 1053 KB/RV ICCV 3 × Flip 88-20 IARI, New Delhi
52 Pusa 2024 KB/RV (BG 261 × ICC 88503) × (GL 920 × BG 1003) IARI, New Delhi 53 Pusa 5023 KB/RV (Flip 90-166 × BG 1072) × (BG 1082 × BG 1073) IARI, New Delhi 54 Pusa 1105 KB/RV (C 104 × BG 1003) × (ICC 88503 × BG 1048) IARI, New Delhi 55
Pusa 1108 KB/RV
[(BG 315 × ILC 72) × (ICCV 13 × Flip 85-11)] × (ICCV
32 × Surototo 77) IARI, New Delhi
56 KAK 2 KB/RV (ICCV 2 × Surutato 77) × ICC 7344 PDKV, Akola (MH)
57 ICC 7323 KM/LR Plant Introduction-251783 USSR
58 FLIP 90-166 KM/GS Breeding line ICARDA, Aleppo (Syria)
59 ILC 202 KM/GS NEC 142-2 ICARDA, Aleppo (Syria)
60 EC539009 KM/GS Genetic Stock Spain
61 Pusa 1088 KM/RV (Pusa 256 × ICCV 32) × ICCV 32 IARI, New Delhi 62 BG 1073 KM/RV (BG 315 × ILC 73) × (ICCV 13 × BG 315) IARI, New Delhi
63 Pusa 1003 KM/RV A mutant of L 532 IARI, New Delhi
64 Pusa 267 KM/RV USA 613 × BEG 482 IARI, New Delhi
65 BGD 128 KM/RV ICCV 2 × ICCV 5 IARI-RS, Dharwad (KAR)
* Type: DB-desi, bold seeded; DM-desi, medium seeded; KB-kabuli, bold seeded and KM-kabuli, medium seeded; BL-Breeding
ISSN 0975-928X
Table 2. Mean squares and estimates of variability parameters for yield component traits in chickpea
Parameter DF DM PH PB TB PP SP SYP TW
MSG 203.56** 102.65** 193.06** 0.71** 195.61** 2738.89** 3.65** 253.61** 206.47**
Mean 93.88 136.43 57.98 3.79 35.7 84.49 7.55 22.3 20.34
Range 72-110 110-149 42.67-75.22
2.67-4.89
18.22-58.33
31.67-162.67
5.44-10.11
6.73-45.45
9.39-39.22
S.E. 2.99 2.06 2.4 0.19 1.22 8.83 0.44 3.98 0.72
σ2
p 85.74 42.67 75.92 0.31 70.16 1068.82 1.61 116.28 69.85
σ2
g 58.91 29.99 58.57 0.2 65.68 835.04 1.02 68.7 68.31
PCV (%) 9.86 4.79 15.03 14.69 23.46 38.7 16.82 48.37 41.1
GCV (%) 8.18 4.01 13.2 11.78 22.7 34.2 13.39 37.18 40.64
h²BS (%) 68.7 70.3 77.2 64.3 93.6 78.1 63.4 59.1 97.8
GA 13.11 9.46 13.85 0.74 16.15 52.62 1.66 13.12 16.84
GAM 13.96 6.93 23.88 19.45 45.24 62.28 21.96 58.87 82.79
*, ** Significant at 5 and 1 per cent levels, respectively
Table 3. Correlation co-efficients [phenotypic: above diagonal and genotypic: below diagonal] among the yield and yield attributing traits
DF DM PH PB TB PP SP SYP TW
DF - 0.07 0.03 -0.14 0.05 0.23 0.08 -0.01 -0.28*
DM 0.1 - 0.13 0.01 0.01 -0.11 -0.25 -0.15 -0.04
PH 0.04 0.14 - 0.25 0.03 -0.07 -0.14 0.30* 0.49**
PB -0.18 0.01 0.29* - 0.34** 0.19 0.01 0.29* 0.27*
TB 0.05 0.01 0.03 0.38** - 0.59** 0.45** 0.45** -0.11
PP 0.25 -0.11 -0.07 0.21 0.59** - 0.49** 0.62** -0.28*
SP 0.1 -0.26* -0.14 -0.01 0.47** 0.51** - 0.31* -0.27*
SYP -0.01 -0.15 0.3 0.31* 0.46** 0.62** 0.31* - 0.38**
TW -0.31* -0.04 0.49** 0.31* -0.11 -0.28* -0.28* 0.38** -
*, ** Significant at 5 and 1 per cent levels, respectively
DF: Days to 50% flowering; DM: Days to maturity; PH: Plant height (cm); PB: number of primary branches per plant; TB: number of total number of branches per plant; PP: number of pods per plant; SP: number of seeds per 5 pods; SYP: seed yield per plant (g); TW: 100 seed weight (g).
Table 4. Contribution of individual trait to the total genetic divergence
Character Times ranked first
% contribution towards total divergence
Days to 50% flowering 3 0.14
Days to maturity 13 0.63
Plant height 55 2.64
Primary branches/plant 1 0.05
Total branches/plant 71 3.41
Pods/Plant 873 41.97
Seeds/5 pods 7 0.34
Seed yield/plant 19 0.91
ISSN 0975-928X
Table 5. Cluster-wise distribution of chickpea genotypes on the basis of D2-statistic
Cluster No. of
genotypes Genotypes
I 9 ILC3279#, IPC71, BGD1005, Pusa1003*, GNG469, Pusa212, JG74, PG96006, EC539009* II 8 DG5042#, DG5066#, MPJGK3¥, DG5049#, BG1073*, SBD377#, PhuleG-0516¥, Pusa256#
III 14 Pusa240, BGD112, GNG663, RSG44, RSG143-1, Pusa372, Pusa261, JG62, PDC84-16, Pusa244, C235, SAKI9516, FLIP90-166*, ICC3935
IV 14 Pusa362
#, BG5028#, BG203, Pusa391#, Pusa1103, Pusa267*, BGD72#, ICC4958#,
BGD128*, DG5047#, DG5048#, Pusa1088*, Pusa1105¥, Pusa2024¥
V 14 Sadabahar, ILC202
*
, ICCV4516, ICC5639, E100Ym, ICCV10, ICC16487, ICC16903, ICC14669, JG315, PDG84-10, Bheema#, BG376, ICC7323*
VI 1 Pusa1053¥
VII 3 Pusa1108¥, DG5046#, BG5023¥
VIII 1 KAK2¥
IX 1 Pusa209
Note: # Bold seeded Desi; ¥ Bold seeded Kabuli; * Medium seeded Kabuli; Medium seeded desi genotypes are not marked with the symbol.
Table 6. Average inter- and intra cluster (underlined) distances
Cluster I II III IV V VI VII VIII IX
I 279.58
II 1769.22 386.66
III 1394.95 4763.17 561.59
IV 1043.57 1893.85 1743.79 560.53
V 981.42 2941.27 2271.95 2720.49 658.75
VI 2734.63 2332.14 3671.90 1000.22 5545.97 0.00
VII 1865.81 989.78 4056.03 1164.18 3910.16 842.70 392.72
VIII 4036.05 822.29 8148.09 3924.87 5206.52 3840.67 2085.87 0.00
IX 3723.56 8340.47 1148.55 3310.18 5227.21 4900.99 6640.02 12585.42 0.00
Table 7. Mean performance of different clusters for various yield and yield attributing characters
Character Cluster
$
I II III IV V VI VII VIII IX
Days to 50% flowering (no.)
97.44 88.58 97.93 93.67 92.93 88.00 94.44 82.33 88.67 Days to maturity (no.) 136.89 136.69 135.71 134.17 138.44 137.00 141.17 126.67 134.00 Plant height (cm) 64.90 60.41 53.36 59.09 52.86 64.86 72.09 51.33 50.47 Primary branches/plant
(no.)
3.94 3.83 3.72 3.98 3.48 4.11 3.85 4.11 3.33 Total branches/plant (no.) 32.40 26.44 40.60 40.02 30.75 44.78 44.33 25.89 45.22
Pods/plant (no.) 77.99 52.00 117.38 100.32 54.37 115.78 76.56 31.89 162.67
Seeds/5 pods (no.) 7.23 6.82 8.17 7.71 7.18 7.56 8.00 6.22 10.11
Seed yield/plant (g) 19.82 20.46 22.88 32.33 11.18 39.52 29.15 12.37 25.22 100-seed weight (g) 18.64 32.16 12.65 24.64 13.81 33.26 32.68 39.87 10.67
$
ISSN 0975-928X
Fig. 1. Factorial analysis for yield and yield component traits in chickpea