IJCCR
Study of Cardiac Morbidities in Critically Ill Patients
Admitted to Intensive Care Unit Due to Non-Cardiac
Causes
1
M. Mokhtar Gomaa, Yaser El-Sayed
2, M. Abo-Mandour Moussa
3, M. Moaens Mohy El-Din
4,
*Omar Ahmed Omar
51,2,3,4,5Department of Cardiology, Faculty of Medicine – AL-Azhar University, Egypt
This study was conducted in cooperation between Al-Azhar university and El-Haram specialized hospital in Cairo - Egypt during the period between November 2015 and November 2016 to detect and assess the new cardiovascular adverse events that happened to critically ill patients during their admission in intensive care unit, the commonest complications happened was Venous-Thrombo-Embolism and Atrial Fibrillation. This study focused on the etiology, incidence and management of cardiovascular adverse events. The objective of this study was to evaluate the type and outcomes of cardiovascular complications in patients admitted to intensive care unit (ICU) due to non-cardiac causes.
Keywords: Atrial fibrillation; critically ill patients; intensive care unit; deep venous thrombosis; cardiac adverse effects
INTRODUCTION
Venous thromboembolism (VTE), including deep venous thrombosis (DVT) and pulmonary embolism (PE), is recognized as a common complication in critically ill patients. Risk factors including critical illness, mechanical ventilation, sedative medications, and central venous catheter insertion are major contributing factors to the high risk of VTE (Boonyawat and Crowther,2015
Venous thromboembolism (VTE) is a common lethal disease that affects hospitalized patients, recurs frequently, is often overlooked, and can result in long term complications, including chronic thromboembolic pulmonary hypertension and post thrombotic syndrome. Although it is the 3rd most common cause of hospital-related deaths, less than half of all hospitalized patients at risk for VTE, received adequate prophylactic treatment. Most of hospitalized patients have at least one or more risk factors for VTE, and without prophylaxis, the incidence of hospital acquired DVT is 10% to 20% among medical patients and even higher among surgical patients (15% to 40%) (Al Solaiman and Kim,2009).
Atrial fibrillation (AF) is the most common arrhythmia in patients hospitalized in intensive care units (ICUs) and is associated with increased morbidity and mortality (Arrigo et al., 2014).
Atrial fibrillation, atrial flutter, AV-nodal reentry tachycardia with rapid ventricular response, atrial ectopic tachycardia, and pre-excitation syndromes combined with atrial fibrillation or ventricular tachyarrhythmia are typical arrhythmias in intensive care patients. Most frequently, the diagnosis of the underlying arrhythmia is possible from the physical examination, the response to maneuvers or drugs, and the 12-lead surface electrocardiogram (Trappe and Brandts, 2003).
*Corresponding author: Omar Ahmed Omar, Cardiology resident, AL-Azhar University E-mail: dr.omarahmad86@gmail.com Co-Author: M. Mohy El-Din, Department of Cardiology, Faculty of Medicine –AL-Azhar University, Egypt, E-mail: drmoanes11@yahoo.com
International Journal of Cardiology and Cardiovascular Research Vol. 3(2), pp. 037-044, October, 2017. © www.premierpublishers.org. ISSN: XXXX-XXXX
12-lead electrocardiogram is the corner stone to identify the rhythm of tachyarrhythmia, presence of pre-excitation, bradyarrhythmias and heart blocks (Ahmed, 2009).
Cardiac arrhythmias are a common problem encountered in the intensive care unit (ICU) and represent a major source of morbidity. The inciting factor for an arrhythmia in a given patient may be an insult such as hypoxia, infection, cardiac ischemia, catecholamine excess (endogenous or exogenous), or an electrolyte abnormality (Tarditi and Hollenberg, 2006).
Bradyarrhythmias and conduction blocks are common electrocardiographic findings. Many of these arrhythmias are asymptomatic and don’t require specific therapy, whereas others can be life threatening, requiring rapid intervention (Oommen, 2009).
Pulmonary edema is due to the movement of excess fluid into the alveoli as a result of an alteration in one or more of Starling's forces. In cardiogenic pulmonary edema, a high pulmonary capillary pressure (as estimated clinically from the pulmonary artery wedge pressure) is responsible for the abnormal fluid movement. In contrast, noncardiogenic pulmonary edema is caused by various disorders in which factors other than elevated pulmonary capillary pressure are responsible for protein and fluid accumulation in the alveoli. The distinction between cardiogenic and noncardiogenic causes is not always possible, since the clinical syndrome may represent a combination of several different disorders. The diagnosis is important, however, because treatment varies considerably depending upon the underlying pathophysiologic mechanisms (Givertz et al., 2015).
Myocardial infarction (MI) is defined as a clinical (or pathologic) event caused by myocardial ischemia in which there is evidence of myocardial injury or necrosis. Criteria are met when there is a rise and/or fall of cardiac biomarkers, along with supportive evidence in the form of typical symptoms, suggestive electrocardiographic (ECG) changes, or imaging evidence of new loss of viable myocardium or new regional wall motion abnormality (Thygesen K et al., 2012).
Sudden cardiac death (SCD) is the result of a change of cardiac activity from normal (typically sinus) rhythm to a rhythm that does not pump adequate blood to the brain. The most common rhythms leading to SCD are ventricular tachycardia (VT) or ventricular fibrillation (VF). These result from an accelerated ventricular pacemaker or ventricular reentrant waves. Despite significant efforts to develop accurate predictors for the risk of SCD, current methods for risk stratification still need to be improved (Lerma and Glass, 2015).
MATERIAL AND METHODS
This prospective study was conducted in co-operation between Al-Azhar university and El-Haram specialized
hospital during the period from November 2015 to November 2016 .
All patients admitted to ICU during this period were included in the study, 319 patients were admitted to ICU during this time with medical emergency, surgical emergency or for post-operative observation, 167 patients were excluded from the study. The remaining 143 patients were enrolled in the study as they were admitted due to non-cardiac etiology
Exclusion criteria
1. All patients admitted due to cardiac emergencies such as:
▪ Cardiogenic shock
▪ Acute coronary syndrome
▪ Symptomatic bradycardia or tachycardia
▪ Heart failure
▪ Acute pulmonary edema
▪ Cardiac temponade
▪ Acute pulmonary embolism
2. Duration of stay in ICU less than 3 days
3. Patient with chronic AF
The remaining 143 patients fulfilled the following inclusion criteria were included with emphasis on duration of stay in ICU to be at least 3 days or more.
Inclusion criteria
The study included all 143 patients admitted to ICU due to:
1. Medical causes
▪ Patients admitted with cerebro-vascular accidents.
▪ Patient admitted due to chest problems and respiratory failure.
▪ Patient admitted due to endocrinal or metabolic abnormalities.
▪ Patients admitted with acute renal failure or chronic renal failure.
▪ Patients admitted with liver cell failure.
2. Surgical causes
▪ Patients admitted due to road traffic accidents & multiple traumas.
▪ Patients admitted due to acute pancreatitis, acute cholecystitis and other acute abdomen emergencies.
3. Postoperative causes
▪ After neurosurgical operations e.g. excision of brain tumor
Data collection
Data were collected from all patients at time of ICU admission. The data collection sheet includes:
▪ Demographic characteristics
o Age
o gender
o Body weight measurement using the body weight scale with exception of bed ridden patients
o Height measurement using the height scale.
o BMI was calculated according to the following formula:
o BMI= Body weight (Kg) / Height (m2).
▪ Risk factors
o Diabetes mellitus was defined as fasting plasma glucose ≥126 mg/dl and/or random plasma glucose ≥200 mg/dl for two successive days and/or using of glucose lowering medication. Duration and type of medication (oral hypoglycemic drugs, Insulin or combination of both) were also noted.
o Hypertension defined as blood pressure BP >140/90, and/or use of BP lowering medication.
o Dyslipidemia defined as total cholesterol >200 mg/dL, LDL cholesterol > 100 mg/dL, use of lipid lowering medication or hypertriglyceremia defined as TAGs> 150mg /dL
o Smokers were defined as those who currently smoking or had quit within the last 5 years.
▪ Clinical assessment
All study population sheets contained clinical data on admission including:
o Heart rate measurement by counting the radial pulse per minute
o Systolic and diastolic Blood pressure measurement by non-invasive manual sphygmomanometer both palpatory and auscultatory methods.
o Measurement of body temperature sublingually by mercury thermometer in Celsius degree.
o Measurement of respiratory rate per minute
o Duration of stay in ICU
▪ Laboratory work up
o Complete blood count
o Fasting lipid profile (total cholesterol, LDL, and TGs).
o Sodium, Potassium, Magnesium and Calcium levels in blood
o International normalization ratio
o Arterial blood gases
o Liver function tests (AST – ALT)
o Kidney function tests (blood urea & Creatinine).
▪ 12-lead electrocardiogram
Done for all patients included in our study and the ECG data analyzed for:
• Atrial and Ventricular Enlargement.
• Ventricular Conduction Disturbances - Bundle Branch Blocks.
• Myocardial Ischemia and Infarction, ST Segment Elevation Ischemia and Q Wave Infarct Patterns.
• Supraventricular Arrhythmias, Premature Atrial and AV Junctional Beats, Paroxysmal Supraventricular Tachycardias, and AV Junctional Rhythms.
• Atrial Flutter and Atrial Fibrillation.
• Ventricular Arrhythmias.
• Atrioventricular (AV) Heart Block.
o Horizontal or down sloping ST depression ≥ 0.5 mm at the J-point in ≥ 2 contiguous leads indicates myocardial ischemia (according to the 2007 Task Force Criteria).
o Inverted T waves: T-wave inversions due to myocardial ischemia or infarction occur in contiguous leads based on the anatomical location of the area of ischemia/infarction: But these change must be supported by clinical scenario (chest pain, chest tightness or dyspnea)
o
• Biphasic T waves: Ischemic T waves rise and then fall below the cardiac resting membrane potential
• Hypokalemic T waves fall and then rise above the cardiac resting membrane potential Wellens' Syndrome is a pattern of biphasic T waves in V2-3. It is generally present in patients with ischemic chest pain.
• Type 1: T-waves are symmetrically and deeply inverted
• Type 2: T-waves are biphasic with negative terminal deflection and positive initial deflection
• Flattened T waves: Dynamic T-wave flattening due to anterior ischemia.
• Pathological Q Waves Any Q-wave in leads V2–V3 ≥ 0.02 s or QS complex in leads V2 and V3. Q-wave ≥ 0.03 s and > 0.1 mV deep or QS complex in leads I, II, aVL, aVF, or V4–V6 in any two leads of a contiguous lead grouping (I, aVL,V6; V4–V6; II, III, and aVF)
▪ Echocardiography
Two-dimensional, M-mode and Doppler echocardiographic studies were performed in all patients using a 2.5 MHz transducer of the commercially available machine within 2-3 days after ICU admission.
Patients were examined in the supine and left lateral decubitus to obtain the best images. The following views were obtained in all subjects:
▪ Parasternal long-axis view
valve
▪ Apical four-chamber view
▪ Apical five-chamber view
▪ Apical two-chamber view
▪ Apical three-chamber view
▪ M-mode measurements included:
o Mitral valve and aortic valve morphology were assessed.
o Left ventricular end-diastolic and end-systolic dimensions as per the American Society of Echocardiography recommendations.
o Interventricular septum and posterior wall thickness measured at the level of the tips of the mitral valve leaflets at end-diastole in the parasternal long-axis view.
o Calculation of fractional shortening (FS) was done using the following formula.
Where LVEDD is left ventricular-end diastolic dimension and LVESD is left ventricular end-systolic dimension.
▪ Calculation of ejection fraction
▪ Left atrial diameter
▪ Aortic root diameter
▪ Two-dimensional measurements included:
o In apical 4-chamber view the mitral and tricuspid valves morphology were assessed
o In apical 5-chamber view the aortic valve morphology was assessed.
▪ Doppler imaging included:
Transmitral inflow pattern was assessed by placing the pulsed-wave Doppler sample volume at the tips of the mitral valve leaflets in the apical four-chamber view to measure the peak early diastolic velocity (E wave), peak late diastolic velocity (A wave) and deceleration time of the E wave. E/A ratio was calculated and the type of diastolic dysfunction was determined accordingly:
• Impaired relaxation (grade): E/A ratio < 1 .
• Pseudonorrmalization (grade II): E/A ratio > 1 reversing with Valsalva maneuver with normal deceleration time (160 – 230 msec).
• Restrictive pattern (grade III): E/A ratio > 2 with shortened deceleration time (< 160 msec).
o Trans aortic outflow pattern was assessed by placing the continues -wave Doppler at the aortic valve the apical five-chamber view.
o Trans tricuspid inflow pattern was assessed by placing the continuous -wave Doppler at the tricuspid valve the apical four-chamber view.
o Pulmonary valve is assessed in parasternal short axis view, by placing the Continues Flow Doppler across the pulmonary valve.
regurgitation across the mitral valve, aortic valve and tricuspid and pulmonary valves.
o Pulmonary artery systolic pressure is calculated by placing the continues -wave Doppler at the tricuspid valve at the apical four-chamber view and was calculated as the sum of the estimated RA pressure (RAP) and the peak pressure gradient between the peak right ventricle and the right atrium, as estimated by application of the modified Bernoulli equation to peak velocity represented by the tricuspid regurgitation Doppler signal, and RA pressure is estimated from IVC diameter and respiratory changes
o Regional Wall Motion Abnormality
o A sixteen-segment model was used for left ventricular segmentation; this model consists of six segments at both the basal and mid-ventricular levels and four segments at the apex. The attachment of the right ventricular wall to the left ventricle defines the septum, which was divided at basal and mid-left ventricular levels into anteroseptum and inferoseptum. Continuing counterclockwise, the remaining segments at both basal and mid-ventricular levels are labeled as inferior, inferolateral, and anterolateral and anterior. The apex includes septal, inferior, lateral and anterior segments. Each segment was analyzed individually and scored on the basis of its motion and systolic thickening. Each segment’s function was confirmed in multiple views. Segments were assessed for: normal, hypokinesis, akinesis and dyskinesis (or aneurysmatic). The complications happened in ICU was monitored along the patient period of admission the surveillance concentrated on
o Occurrence of DVT, confirmed by venous duplex.
o Pulmonary embolism, confirmed by D-dimer, ECHO, and CT-pulmonary angiography.
o Occurrence of Atrial fibrillation and other arrhythmias.
o Pulmonary edema.
o ACS, confirmed clinically, by ECG and cardiac enzymes.
The study included 143 patients, they were divided into two groups, group A=non-complicated group and group B=complicated group.
STATISTICAL ANALYSIS
The comparison between two groups with qualitative data were done by using Chi-square test and/or Fisher exact test was used instead of Chi-square test when the expected count in any cell was found less than 5.
The comparison between two independent groups with quantitative data and parametric distribution was done by using Independent t-test while data with non-parametric distribution compared between two groups using Mann-Whitney test.
The comparison between more than two independent groups with quantitative data and parametric distribution was done by using One Way Analysis of Variance (ANOVA) while data with non-parametric distribution were compared using Kruskall-Wallis test.
Logistic regression analysis was used to assess the best predictors of patients with complications in univariate and multivariate models.
The confidence interval was set to 95% and the margin of error accepted was set to 5%. So, the p-value was considered significant as the following:
▪ P > 0.05: Non significant
▪ P < 0.05: Significant
▪ P < 0.01: Highly significant.
RESULTS
From 143 patients admitted to ICU, 54 (37.8%) suffered from cardiac complications: 50% (27 cases) of AF, 24.1% (13 cases) of pulmonary embolism, 14.8% (8 cases) of DVT, supraventricular tachycardia in 5.6% (3 cases), and pulmonary edema in 3.7% (2 cases). Finally the incidence of NSTEMI was only 1.9% (1 case). (table1)
Table (1): Shows the number of complicated patients, types of
complications and fate of all studied population
No. %
Complications Non complicated 89 62.2%
Complicated 54 37.8%
Types of complications
Atrial fibrillation 27 50.0%
Deep venous
thrombosis 8 14.8%
Supra ventricular
tachycardia 3 5.6%
Pulmonary embolism 13 24.1%
Pulmonary edema 2 3.7%
NSTEMI 1 1.9%
Fate Death 49 34.3%
Discharge 94 65.7%
Figure (1): Shows the types of complications and the percentage of each one of complications
The table (2) shows that there was statistically significant relation found between complicated patients and age and incidence of diabetes mellitus with P-value = 0.028, 0.002; respectively while no statistically significant relation found with sex, HTN, Smoking and IHD with P-value > 0.05.
Patients with age group around 64 years old are found to be exposed more to complications than patients with age group 58 years old.
74% of complicated patients had a previous history of DM which represents a significantly important relation to the complicated cases.
▪ Complications in relation to age
There was statistically significant difference regarding age (P-value < 0.05). The range of age of the study group was from 17 to 93 years, the mean age in complicated group was around 64.69 years old, compared with mean of 58.37 years in non-complicated group. This is consistent with Guenancia study (Guenancia C et al,. 2015)
▪ Complications in relation to sex
There was no statistically significant difference regarding sex (P-value> 0.05). However the number of females with complications was higher than number of males. This is consistent with Fuster study (Fuster et al., 2011)
▪ Complications in relation to smoking
There was no statistically significant difference regarding smoking (P-value> 0.05).
▪ Complications in relation to hypertension
There was no statistically significant difference regarding hypertension (P-value> 0.05). However, the number of hypertensive patients with complications was higher than normotensive patients,
Table (2): Relation between complication and demographic data and risk factors of the studied patients
Non complicated Complicated Chi-square test
No.= 89 No.= 54 X²/t* P-value
Age (yrs) Mean ± SD 58.37 ± 18.06 64.69 ± 13.55 -2.218* 0.028
Range 17 – 86 28 – 93
Sex Female 43 (48.3%) 34 (63.0%) 2.902 0.088
Male 46 (51.7%) 20 (37.0%)
HTN Yes 49 (55.1%) 30 (55.6%) 0.003 0.954
DM Yes 42 (47.2%) 40 (74.1%) 9.930 0.002
Smoking Yes 40 (44.9%) 18 (33.3%) 1.879 0.170
Heart disease Yes 28 (31.5%) 14 (25.9%) 0.496 0.481
Table (3): Relation between complication, vital signs, anthropometric measures, duration of ICU stay and fate of the studied patients.
Non complicated Complicated Independent t-test
No.= 89 No.= 54 t/X²* P-value
Heart rate Mean ± SD 99.33 ± 20.33 102.87 ± 17.30 -1.068 0.287
Range 60 – 160 65 – 140
Systolic BP Mean ± SD 131.24 ± 24.72 122.41 ± 29.39 1.926 0.056
Range 70 – 190 70 – 180
Diastolic BP Mean ± SD 78.88 ± 13.60 75.65 ± 16.94 1.252 0.213
Range 50 – 110 50 – 100
Temperature (°C) Mean ± SD 38.09 ± 0.64 38.00 ± 0.49 0.833 0.406
Range 37 – 40 37 – 39.2
Respiratory rate Mean ± SD 23.34 ± 4.03 25.89 ± 4.48 -3.521 0.001
Range 16 – 35 18 – 35
Weight (kg) Mean ± SD 86.40 ± 16.15 96.63 ± 19.68 -3.376 0.001
Range 40 – 137 65 – 137
Height (cm) Mean ± SD 169.15 ± 6.17 165.35 ± 4.60 3.906 0.000
Range 150 – 185 160 – 175
BMI (kg/m2) Mean ± SD 30.00 ± 4.67 35.44 ± 7.49 -5.360 0.000
Range 18 – 46 23 – 50
Duration of stay
in ICU (days)
Mean ± SD 8.31 ± 3.12 8.04 ± 2.54
0.552 0.582
Range 3 – 21 4 – 14
Fate Death 21 (23.6%) 28 (51.9%) 11.913* 0.001
Figure (2): Show the Age difference between complicated and Figure (3):Shows the percentage of diabetic patients among
non-complicated groups. complicated and non-complicated groups.
of diabetic patients with complications was 40 patients (74.1% of cases) and the number of non-diabetic patients with complications were 14 patients (25.9% of cases). This is consistent with Rosenberg study (Rosenberg MA et al.,2012)
▪ Complications in relation to Heart failure
There was no statistically significant difference regarding heart failure (P-value> 0.05)
▪ Complications in relation to weight
There was statistically significant difference regarding weight(P-value< 0.05). This is consistent with stein study. (Stein et al; 2011)
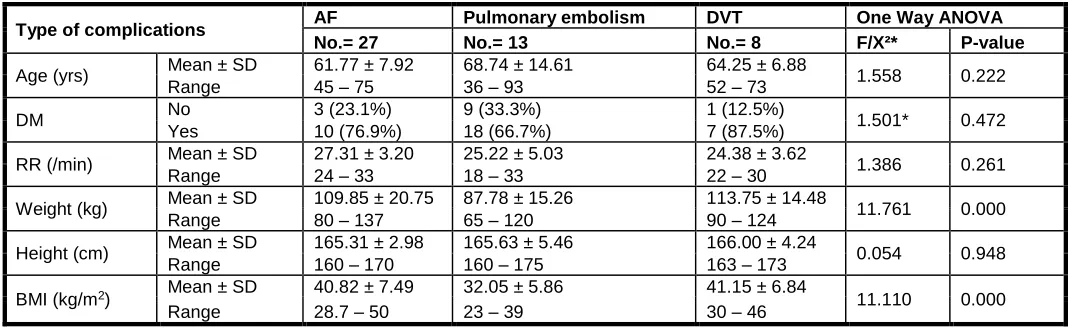
Table (4): Relation between the three major complications (AF, PE & DVT) and Age, DM, RR and anthropometric measures
Type of complications AF Pulmonary embolism DVT One Way ANOVA
No.= 27 No.= 13 No.= 8 F/X²* P-value
Age (yrs) Mean ± SD 61.77 ± 7.92 68.74 ± 14.61 64.25 ± 6.88 1.558 0.222
Range 45 – 75 36 – 93 52 – 73
DM No 3 (23.1%) 9 (33.3%) 1 (12.5%) 1.501* 0.472
Yes 10 (76.9%) 18 (66.7%) 7 (87.5%)
RR (/min) Mean ± SD 27.31 ± 3.20 25.22 ± 5.03 24.38 ± 3.62 1.386 0.261
Range 24 – 33 18 – 33 22 – 30
Weight (kg) Mean ± SD 109.85 ± 20.75 87.78 ± 15.26 113.75 ± 14.48 11.761 0.000
Range 80 – 137 65 – 120 90 – 124
Height (cm) Mean ± SD 165.31 ± 2.98 165.63 ± 5.46 166.00 ± 4.24 0.054 0.948
Range 160 – 170 160 – 175 163 – 173
BMI (kg/m2) Mean ± SD 40.82 ± 7.49 32.05 ± 5.86 41.15 ± 6.84 11.110 0.000
Range 28.7 – 50 23 – 39 30 – 46
*: Chi-square test, DM= diabetes mellitus, RR= respiratory rate, BMI= body mass index
compared with range of 18 to 46 kg/m2 in the non-complicated group with mean around 30 kg/m2. (Stein et al.,2011)
▪ Complications in relation to duration of stay in ICU There was no statistically significant difference regarding septic shock (P-value<0.05).
DISCUSSION
This study was conducted in cooperation between Al-Azhar university and El-Haram specialized hospital during the period between November 2015 and November 2016 to detect and assess the cardiac adverse effects that happened to critically ill patients during their admission in ICU, the commonest complications happened was Venous-Thrombo-Embolism and Atrial Fibrillation.
Venous thromboembolism (VTE), including deep venous thrombosis (DVT) and pulmonary embolism (PE), is recognized as a common complication in critically ill patients. Risk factors include prolonged bed ridden, mechanical ventilation, sedative medications, and central venous catheter insertion are major contributing factors to the high risk of VTE, it’s a common lethal disease that affects hospitalized patients, recurs frequently, is often overlooked, and can result in long term complications, including chronic thromboembolic pulmonary hypertension and post thrombotic syndrome.
Atrial fibrillation (AF) is the most common arrhythmia in patients hospitalized in intensive care units (ICUs) and is associated with increased morbidity and mortality.
This study included 143 patients admitted to ICU, only 54 patients suffered from cardiac complications, in descending manner:
1. AF is the most common complication happened in 27 patients (50%).
2. Pulmonary embolism comes next with 13 patients (24.1%).
3. DVT in the third place with 8 patients (14.8%). 4. Supraventricular tachycardia with 3 patients (5.6%). 5. Then pulmonary edema with 2 patients (3.7%). 6. Finally, the incidence of NSTEMI was only 1.9% with
only one case.
The age of patients admitted to ICU was directly related to complications happened in ICU, the older the patient is the more he is vulnerable to complications.
The increased body mass index and increased Wight was directly related to complications happened in ICU.
Also, we found that HB level is strongly related to cardiac complications, so that we must pay more attention to anemic patients and try to find out and treat the cause of anemia.
Finally, we must know that any patient admitted to ICU is at more stress condition than patient admitted to ward, also he is at increased risk of DVT and VTE due to prolonged bed ridden state, and he is not mobile because of disturbed level of consciousness due to stroke, ICH. Fracture lower limb long bones and fracture pelvis also make the patient bed ridden for longer time, anemia also plays an important role.
CONCLUSION
▪ The ICU patients have a higher risk than other patients for adverse cardiac complications
▪ Cardiac complications mostly are AF, DVT and pulmonary embolism
▪ Cardiac complications lead to increases rate of mortality and morbidity
RECOMMENDATIONS
▪ Include a larger number of patients to the study
▪ Follow-up the patients of longer periods
REFERENCES
Ahmed SH (2009). Common ECG patterns. Topol and Griffin’s manual of cardiovascular medicine, 4th edition.
Al Solaiman F and Kim ESH (2009). Venous thromboembolism and hypercoagulable states. Topol and Griffin’s manual of cardiovascular medicine, 4th edition.
Arrigo M, Bettex D and Rudiger A (2014). Management of atrial fibrillation in critically ill patients. Critical Care Research and Practice; 840615.
Boonyawat K and Crowther MA (2015). Venous thromboembolism prophylaxis in critically ill patients. Seminar in Thrombosis and Hemostasis; 41(1):68-74. Fuster V, Rydén LE, Cannom DS, et al. (2011). 2011 ACCF/AHA/HRS focused updates incorporated into the ACC/AHA/ESC 2006 Guidelines for the management of patients with atrial fibrillation: a report of the American College of Cardiology Foundation/American Heart Association Task Force on Practice Guidelines developed in partnership with the European Society of Cardiology and in collaboration with the European Heart Rhythm Association and the Heart Rhythm Society. Journal of the American College of Cardiology; 57(11):e101-98. Givertz MM, Colucci WS, Braunwald E. Clinical aspects of
heart failure; pulmonary edema, high-output failure. In: Heart Disease: A Textbook of Cardiovascular Medicine, 7th ed, Zipes DP, Libby P, Bonow RO, Braunwald E (Eds), Elsevier Saunders, Philadelphia 2005. p.539.
Guenancia C, Binquet C, Laurent G, et al. (2015): Incidence and Predictors of New-Onset Atrial Fibrillation in Septic Shock Patients in a Medical ICU. PLoS One; 10(5):e0127168.
Lerma, C. and Glass, L. (2016), Predicting the risk of sudden cardiac death. J Physiol, 594: 2445–2458. doi:10.1113/JP270535
Oommen SS (2009). Bradyarrhythmias, AV block, Asystole, and Pulseless Electrical activity. Topol and Griffin’s manual of cardiovascular medicine, 4th edition.
Rosenberg MA, (2012). Diastolic dysfunction and risk of atrial fibrillation: a mechanistic appraisal. Circulation 126:2353–62
Stein PD, Matta F, Goldman J. (2011). Obesity and pulmonary embolism: the mounting evidence of risk and the mortality paradox. Thromb Res; 128(6):518-23
Tarditi DJ and Hollenberg SM (2006). Cardiac arrhythmias in the intensive care unit. Semin Respir Crit Care Med; 27(3):221-9.
Thygesen K, Alpert JS, Jaffe AS,
et al
. Third universal
definition of myocardial infarction. Circulation 2012;
126:2020.
Trappe HJ and Brandts B (2003). Arrhythmias in the intensive care unit. Curr Opin Crit Care. 2003 Oct;9(5):345-55. Review.PMID:14508146
Accepted 9 September 2017
Citation: M. Mokhtar Gomaa, Yaser El-Sayed, M. Abo-Mandour Moussa, M. Moaens Mohy El-Din, O. Ahmed Omar (2017). Study of Cardiac Morbidities in Critically Ill Patients Admitted to Intensive Care Unit Due to Non-Cardiac Causes. International Journal of Cardiology and Cardiovascular Research, 3(2): 037-044.