Mojtaba ESLAHI
a, *,Rani EL MEOUCHE
a, *,Anne RUAS
b, *aInstitut de Recherche en Constructibilité (IRC), ESTP Paris, 28 Avenue du Président Wilson, 94230 Cachan, France, Mojtaba Eslahi, [email protected], Rani El Meouche, [email protected]
bLISIS/ IFSTTAR, Université de Marne-la-Vallée, 5 Boulevard Descartes, 77420 Champs-sur-Marne, France, [email protected]
Abstract: Many studies, using various modeling approaches and simulation tools have been made in the field of urban growth. A multitude of models, with common or specific features, has been developed to reconstruct the spatial occupation and changes in land use. However, today most of urban growth techniques just use the historical geographic data such as urban, road and excluded maps to simulate the prospective urban maps. In this paper, adding buildings and population data as urban fabric factors, we define different urban growth simulation scenarios. Each simulation corresponds to policies that are more or less restrictive of space considering what these territories can accommodate as a type of building and as a global population.
Among the urban growth modeling techniques, dynamic models, those based on Cellular Automata (CA) are the most common for their applications in urban areas. CA can be integrated with Geographical Information Systems (GIS) to have a high spatial resolution model with computational efficiency. The SLEUTH model is one of the cellular automata models, which match the dynamic simulation of urban expansion and could be adapted to morphological model of the urban configuration and fabric.
Using the SLEUTH model, this paper provides different simulations that correspond to different land priorities and constraints. We used common data (such as topographic, buildings and demography data) to improve the realism of each simulation and their adequacy with the real world. The findings allow having different images of the city of tomorrow to choose and reflect on urban policies.
Keywords: urban sprawl, scenario-based SLEUTH model, urban fabric and Geographical Information Systems (GIS)
1. Introduction
The size of cities increased all over the world. The process, named urbanisation is mainly due to population growth, rural exodus to cities and to life style. World urbanization prospects of department of economic and social affairs of United Nations demonstrate that in 2017, 55 % of the world’s population lived in urban areas and the coming decades the both global population growth and urbanization will continue in urban areas. Moreover, those projections show that urbanization and the population growth will cause to increase the urbanization to more than 66% in 2050 (see figure 1).
Figure 1: Proportions of urban and rural world population, 1950 to 2050 (From United Nations, 2014)
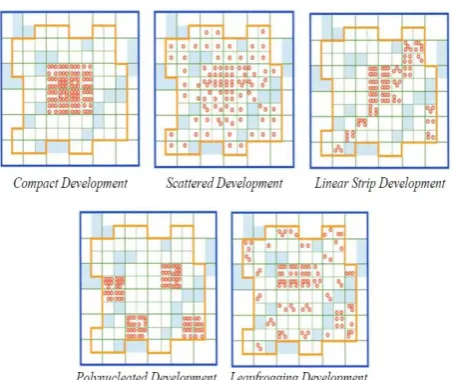
Figure 2: Physical patterns defining sprawl; (From Galster et al., 2001)
illustrates five different patterns that could be considered as the urban sprawl patterns (Galster et al., 2001). Urbanization often induces irreversible changes and can impress on biodiversity, ecosystems and urban climate. It also transforms landscapes and degrades agricultural and natural areas. Tracking and controlling the artificial territories represent an important challenge for local authorities facing with transversal objectives of sustainable development and it is a pressing societal demand in environmental matters. Therefore, sustainable urban planning and management require reliable land change models, which can be used to improve decision-making.
Many recent studies, using diverse modeling approaches and simulation tools of varying complexity have been conducted in the field of urban growth. A significant number of researches have been carried out on urban growth and land use changes, including the linear and non-linear behavior of urban systems. Researches show that the urban growth is a dynamic system and therefore it is highly complex and non-linear in nature. From all existing approaches, the cellular automata modelings (Clarke et al., 1996; Clarke et al., 2001), agent-based modelings (Robinson et al., 2012; Arsanjani et al., 2013), spatial-statistics modelings, artificial neural network modelings (Pijanowski et al., 2009; Mohammady et al., 2014) and fractal modelings (Herold et el., 2002; Triantakonstantis, 2012) are the most used in the last two decades.
Among all dynamic models spatially explicit, those based on CA are more common for their applications in urban areas. CA can be integrated with GIS to have a high spatial resolution model with computational efficiency. The CA models are used to simulate urban growth, sprawl and land use changes (Al-shalabi et al., 2013; Deng et al., 2014; Nourqolipour et al., 2014), project future scenarios of urban landscape (Maeda et al., 2011; Yin et al., 2011) and investigate urban ecological security (Gong et al., 2009; Mao et al., 2013).
However, in most of urban sprawl technics, the lack of urban fabrics such as buildings and population data are obvious, which renders it difficult to use the results to make reasonable decision for sustainable urban planning and management. The proposed method in this article tries to give more reliable urban growth simulation results by integrating the topographic data, buildings and the demography. The aim is to be able to propose a set of different simulations that correspond to different land priorities and constraints and to use common data (such as topographic data, buildings and demography) to improve the realism of each simulation and their adequacy with the real world. In next section, we present the study area. The process and methodology are defined in section 3. In section 4, the scenario based urban growth simulations are described and modeled and the different urban fabric scenarios are presented and discussed.
2. Study Area: Toulouse Metropolitan
In 1950, around 45% of the people in France lived in rural place and 55% lived in cities. The urban population in
France is increased to more than 75% in 2014 and it is anticipated to growth to more than 85% for 2050 (United Nations, 2014).
The used method has a generic process and could be applied to different cities. We have already assayed the method on a metropolis and we are currently applying it on a small town and a village in order to study the re-scalability. The study area of this research is Toulouse metropolis, the fourth most populous commune in France, which is the capital of the French department of Haute-Garonne, in Occitanie region, located in south-west of France (43°36’16” N; 1°26’38” E). The study area has the surface of 6375 km2 and it is bigger than the city of Toulouse including some parts of five other departments around (see figure 3).
Toulouse contains 342 municipalities. From 1990 to 2006 the population grown up with a rhythm of 14 000 newcomers per year. This demographic growth leaded to increase of urbanization area around 1 300 ha per year over the same period. The population growth rate between 2006 and 2011 was +1.34% per year. This growth rate is the highest growth rate of any French metropolitan area with half a million inhabitants or more; however, it is slightly lower than the growth rate registered between the 1999 and 2006 censuses. In 2014, the population of the metropolitan area was more than 1.33 million inhabitants.
Figure 3: Location and extent of the urban area of Toulouse
3. Process and Methodology
Almost all urban sprawl technics use the historical geographic data such as urban, road and excluded maps to simulate the prospective maps. They can produce different results by varying the growth coefficients. In our proposed method, we add two more data (building types and population) and define different scenarios to have various images of the city of tomorrow, respecting the different land priorities and limitations.
In our study, we use SLEUTH urban growth technique for simulating different scenarios from 2017 to 2050. Each scenario is composed of 33growth cycle.
In order to integrate the demography and life style, we have classified the buildings to six different residential categories considering their height and configuration to study the human settlement capacity (HSC). To do so, we used real demographic and topographic data. Thus, we define a relation between the building types and the capacity.
Then, the new simulated urban patches are classified according to the defined building classes, and a land use pattern is generated.
Next, the intermediate population for the study area is estimated. According to the expected population growth and the building types, some fictive urban fabric scenarios called primary urban fabric scenarios are assumed and compared to better understand how this land could be used and how many inhabitants could live in these new areas. Based on the results the new urban fabric scenarios called final urban fabric scenarios are defined to enrich the simulations. The simulation modelling and the results are discussed in detail in next section. Figure 4 illustrates the proposed method procedure.
Figure 4: The proposed method procedure
4. Implementation of the model
4.1 Simulation modeling and parameters
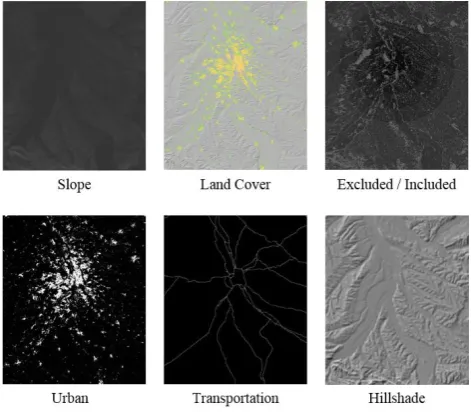
The used urban growth technique is SLEUTH-3r version that is based on the SLEUTH basic model (Clarke et al., 2007; project Gigalopolis, 2018; Jantz et al., 2010). SLEUTH’s acronym is derived from its data input requirements which are Slope, Land use, Exclusion, Urban, Transportation and Hillshade that we call hereafter ‘map’ which are indeed matrices of parameter values. These six different types of maps are used as input data for urban growth simulation. Geospatial database and geographic information systems are applied to create initial spatial data and used during the simulation. The simulation is based on the growth rules i.e. spontaneous growth, new spreading centers, edge growth and road-influenced growth. In SLEUTH model, five coefficients of dispersion, breed, spread, slope and road gravity, are affected on how the growth rules are applied. These coefficients are calculated by calibration process on historical maps. In this paper, we cannot go in detail in the
description of SLEUTH model and its parameters but the point is to see the use of topographic data to improve the simulations.
The Geospatial database used as input topographic data composed the maps of 2000, 2008, 2012 and 2017. Slope and hillshade maps are derived from Digital Elevation Model (DEM) of RGE ALTI with a spatial resolution of 5m, provided by the French National Geographic Institute (Institut Géographique National - IGN). Urban areas, excluded areas and transportation maps are generated automatically from BD TOPO and BD ORTHO fromIGN. Urban map is classified into two classes of urban and nonurban. Population and census on district zone are taken from national institute of statistics and economic studies of 2011 (Institut national de la statistique et des études économiques - INSEE).
In next section, the different urban growth prospective scenarios will define. Each scenario needs its specific input layer. Therefore, the different types of each input maps will be presented and it will be explained how the scenario input maps are generated. Figure 5 illustrates the basic SLEUTH input maps. All these input maps have the size of 1658*1422 pixels that feature a cell size of 52*52 meters (~2700 m2).
Figure 5. The six basic SLEUTH input maps
4.2 Using topographic data to improve urban sprawl simulation (scenario-based SLEUTH model)
In our research, different scenarios are defined in order to challenge the environmental protection and to improve the urban sprawl simulation results. Each scenario corresponds to different explicit priorities. None of the results will ever occur in the real world but they shape the possibilities and are useful for decision-making.
4.2.1 Simulation scenarios
right to extend such as parks and the maps of inclusion describe the places or objects that attract urbanization e.g. along the roads. The exclusion and inclusion (or attractive) maps are generated by using topographic data. Excluded areas are fully protected from urban growth. Thus, they are excluded 100% from the possible urban growth. Other areas (pixels) have different values to restrict or attract urban sprawl. The value of 50 indicates a neutral weight for development. Between 100 and 50 is a relative exclusion whereas under 50 means that there is an attraction. These maps give us the opportunity to determine five different environmental protection scenarios (see table 1).
Table 1. SLEUTH simulation scenarios and the pixels values of each excluded/inclusion input map
The activity area consist of administrative, culture and leisure, education, water management, industrial or commercial, health, sports and transport areas. The remarkable buildings and areas cover the remarkable building, cemetery, airfield runway and sports ground. In the scenarios above (table 1), the scenarios level mentioned the environmental protection level. For example in the first scenario, there is no protection for the environmental zone except for parks.
The smart growth scenario can automatically consider a tendency for the growth area to be occurred in the desired places (Jantz et al., 2010). In this scenario, we imagine that a city center is more attractive for the inhabitants. We defined four concentric zones with different attraction rates, which try to attract to the center of the city and to prohibit in periphery. The water surfaces and railway stations are also considered as attraction areas for dwelling. For this scenario, a layer is defined as concentric zones of attraction. This layer has four concentric zones with radius of 7.5, 15, 22.5 and 30km from the center of the city with the corresponding values of 10, 20, 30 and 40. The others have a value of 50. The areas with attraction of the water surfaces and the attraction of the railway stations have the values 5, 15, 25, 35, 45 with respect to the concentric zones of attraction. These areas are in the distance of 364 meters (7 pixels) from water surfaces and railway stations.
4.2.2 SLEUTH simulation results and evaluations The SLEUTH model consists of three processes of calibration, forecasting and self-modification. In calibration process, a value is initialized for the first simulation of each coefficient. To find the best-fit coefficient values, the process of SLEUTH calibrations performs Monte Carlo number of times through the historical data using the brute force method. These values
are then used in forecasting process of simulation. Table 2, illustrates best-fit coefficient values for our study area.
Table 2. Best-fit coefficient values driven from calibration process of SLEUTH-3r
In forecasting process, the model is first run with the input urban map of 2000 to obtain the prospective urban map for 2017. In this case, it is possible to evaluate the accuracy of the model with different scenarios comparing to real urban map of 2017. The construction slope threshold of 15% is considered as critical slope.
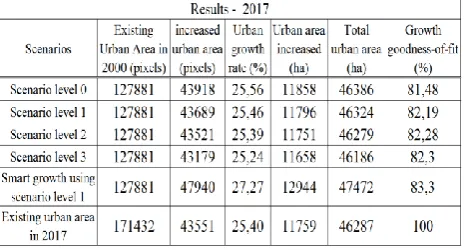
A brute-force search is used to systematically enumerate all urban pixels to check the goodness-of-fit of urban growth projections. The algorithm compares between the observed and the simulated change and persistence. The overall accuracy (OA) is calculated to measure the overall proportion of the pixels that change correctly to the total number of cells. Table 3, illustrates the results of simulated urban maps for 2017 and compare them to the real urban map of 2000 and 2017. As shown, five different results are obtained due to the different scenarios. Comparing simulation results of all scenarios marks that the simulated urban areas are reduced in more environmental protection areas. The evaluations demonstrate the scenario SG Level 1 has a better goodness-of-fit but the scenario level 2 obtain the best growth rate comparing to the real urban 2017. However, the scenario SG Level 1, has the possibility of directing the urban sprawl towards the desired attractive areas.
Table 3. Urban growth simulated results obtained from different scenarios and the comparison of the results to the actual map of 2017, Toulouse.
Table 4. Urban growth simulated results obtained from different scenarios for 2050, Toulouse.
Despite the results illustrated in table 3 and table 4, the future growth will definitely be different due to the population growth, urban planning, land prices and other factors; and might be closer to the other scenarios. Even though these simulations are interesting, they are under-defined and stay abstract because there are plenty of ways to fill the new urban areas produced by the simulation model. In order to be able to understand and to use these simulations, we propose to try to see what could mean these new urban areas in terms of building types, what would be its capacity of human settlement and how does it fit with demographic forecasting. Hence, in the next section we propose to use population growth and building type to try to improve the results.
4.3 Improvement of simulation results by using urban fabric, urban configuration and demography
The form and the configuration of a city is related to its geography and natural environment. The urban expansion is the consequence of the increased population via newborn generation, immigration and succession. Urban sprawl could be constrained by the authorities in order to protect the environment and prevent the risk through urban planning and crisis management. In the following, we try to see the kind of buildings (call the urban fabric) that could fill the simulated urban areas and for each scenario to see the quantity of population could include.
In our research, we present new method of land use planning. This urban land use pattern can be applied for different study area. Having the existence urban area and the growth area, we propose to create new building patterns. To create these patterns (4.3.2), we first need to use a building type classification (4.3.1).
4.3.1 Building type classification:
The structure elements of Toulouse are classified due to the land use planning and the urban fabrics of the city. Department of planning and environment of NSW Government of Australia (NSW Government, Australia, 2017), has defined and classified different building types of a city which can be match to Toulouse metropolitan. These building types are used as element classifications of our study area to create the land use patterns.
According to this classification, the single dwellings are the buildings with 1 to 2 floors in height (i.e. h =3m~5m). Low-rise housing contains townhouse, terrace housing and small-scale residential apartment buildings with 2 to 4
floors and the height of 6m to 12m. The shop top housing are generally the buildings with 3 to 5 floors in height (i.e. h =14m~17m). The medium rise housing are the buildings with 5 to 7 floors with height of 18m~25m and the medium/high rise housing contains the buildings with 8 to 9 floors with height of 26m~29m. The high-rise housing are contains of three categories, the 9 to 12 floors, 13 to 18 floors and 19 to 25 floors.
To classify the structure elements of our study area, the information of the two layers of undifferentiated and industrial buildings are taken into account. This information derived from BD TOPO of IGN database. In undifferentiated buildings, for each types of urban objects, the numbers and the height of the buildings are extracted and an average height for each type is calculated. The industrial buildings are classified to commercial buildings, industrial buildings, agricultural buildings, greenhouses and silos. For each class an average value of height is calculated. The green houses and silos are ignored from industrial fields of classification because of their low effects on urban planning.
4.3.2 Urban patches weighting and generating land use
patterns:
To classify the urban structure elements, it is needed to find the value of the average height of the buildings for the simulated urban patches via presenting a land use pattern. The previous urban land use models e.g. the concentric zone model (R. E. Park et al., 1920), sector model (H. Hoyt, 1939) and multiple nuclei model (C.D. Harris & E.L. Ullman, 1945) were developed to generalize the patterns of urban land use of the industrial cities mostly in United States. They are predefined models, which have to be created for each study area manually.
(1)
In this equation, Hʹ is the likelihood for height value to be given to new urbanized pixel. H is a local value of the percentage; V is the number of pixels that have non-zero value of the height in each layer. N is the number of chosen layer and i, j and k are the number of first, second and third neighbors loop respectively. Using the equation one, building height likelihoods for each pixel is calculated. Later, having the demography the number of people in correspond pixels will calculated.
4.3.3 Demography and population management As discussed before, the SLEUTH simulation results are definitely needed to be evaluate by the population density. Having the building classes, the simulated urban growth and the mean population, in this section, we rate the suitable growth cycle to achieve the desired urban fabrics. To interpolate population, first we estimate the compound annual population rate using equation 2 (Jantz et al., 2014).
(2)
Where, G is compound annual population growth rate for the study area. P is successive population estimates and ty and tyʹ are the year intervals. The average growth rate estimated during 1999 and 2011 is around 1.34% per year. This growth rate is considered in the next steps.
Afterwards, having the population count and compound annual population rate, we estimate the intermediate population for the coming years as follow:
(3)
In the equation above, Pʹ is intermediate population estimate for the study area. P is successive population value. G is compound annual population growth rate calculated previously. The year intervals are shown by ty, tyʹ and tx is the target year.
4.3.4 Implementation, results and discussion
The compound annual population growth rate is calculated for the simulated urban growth of 2050 means in 33 growth cycles from 2017. This estimated rate, gives 55% increased population, considering the actual population count of 1.35 million inhabitants for 2017.
Next, we define four different urban fabric scenarios. These primary scenarios are fictive and they do not correspond to reality but they help to better understand how this land could be used and how many inhabitants could live in these new areas. The four scenarios are as follow:
1) Sprawl urban: The first scenario considered that all new urban patches filled with single dwellings.
2) Medium dense urban: Second scenario, assumed that single dwellings placed in 50% of the new simulated urban areas and others 50% filled by medium rise housing.
3) Medium/High dense urban: The third scenario presumed the 30% of single dwellings and other 70% medium rise housing
4) High dense urban: The forth scenario defined to accommodate just medium rise housing.
For each scenario, we assay the simulated urban growth results from SLEUTH having the specific population increased. For each pixel, the number of inhabitants is estimated from the building classification of urban land use pattern and the population map driven from INSEE. Table 5, illustrates the comparison of all these scenarios. As it shows, we cannot accommodate enough people in the sprawl urban scenario during the 33 growth cycles, while in the high dense scenario, many more people can be placed and therefore less spread. However, we have produced different scenarios with different densities from sprawl to high dense urban but none of those gives the estimated population growth rate of 55% for 33 simulated growth cycles.
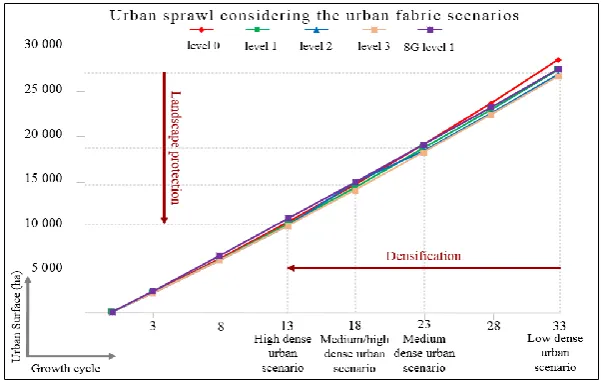
Therefore, we tried to find out which growth cycle would match better the desired urban fabric, and thus we applied other growth cycles. These new scenarios called final urban fabric scenarios. As represented in table 6, the 13th, 18th and 23rd growth cycles give the best results for the medium dense, medium/high dense and high dense urban fabric scenarios respectively with the population growth of around 55%. To find the urban fabric that seems to fit with today tendency we defined another urban fabric scenario called low dense urban for the 33rd growth cycle. In this scenario, 35% of new simulated urban areas are considered as single dwellings, 40% as low-rise housing and rest 25% as medium rise housing. These building class percentages are closer to the existing urban fabric of Toulouse metropolitan. In all scenarios represented in table 6, the urban growth environmental protection level 2 and level 3 taking the best goodness-of-fit and in SG level 1 the urban sprawl is more directed to the attractive areas.
Table 5. Comparing the population growth of four different primary urban fabric scenarios
Table 6. Urban fabric scenarios comparison according to the growth cycle to have similar rate of increased population. The gray column represents the population increasing of low dense urban fabric scenario during 33-growth cycle that is closer to the existing urban fabric
Figure 6: Urban sprawl via the urban fabric scenarios to locate 55% urban population growth
5. Conclusion
For a city in size of Toulouse, urban sprawl phenomena is a big challenge for the authorities and urban planners. This paper presents a way to evaluate and to improve the simulated urban sprawl by using the topographic and population density. The prospective spatial data, urban fabrics and demography are integrated to improve the forecasted urban sprawl and to obtain more reliable urban growth simulation results for the desired forecasting date. We have proposed set of different simulations that related to different land priorities and constraints. Then, we compared the prospective urban growth with forms of dense city and sprawl city while keeping the same
population growth rate. Using common data such as topographic data, buildings and demography, we improved the realism of each simulation and their adequacy with the real world.
6. References
shalabi, M., Billa, L., Pradhan, B., Mansor, S. and Al-Sharif A.A.A. (2013). Modelling urban growth evolution and land-use changes using GIS based cellular automata and SLEUTH models: the case of Sana’a metropolitan city Yemen. Environ Earth Sci, 70(1):425–437
Arsanjani, J. J., Helbich, M., Noronha Vaz, E. (2013). Spatiotemporal simulation of urban growth patterns using agent-based modeling: The case of Tehran, Cities 32 (2013) 33–42.
Clarke, K. C., Gazulis, N., Dietzel, C.K., Goldstein, N.C. (2007). A decade of SLEUTHing: Lessons learned from applications of a cellular automaton land use change model. Chapter 16 in Fisher, P. (ed) Classics from IJGIS. Twenty Years of the International Journal of Geographical Information Systems and Science. Taylor and Francis, CRC, Boca Raton, FL. pp. 413–425.
Clarke, K. C., Hoppen, S., Gaydos, L. (1996). Methods and techniques for rigorous calibration of a cellular automation model of urban growth. In: Proceedings of the Third International Conference/Workshop on Integrating GIS and Environmental Modelling, Santa Fe, New Mexico, January 21–25, 1996.
Clarke, K. C., Parks, B. O., Crane, M. P., and Parks, B. E. (2001). Geographic Information Systems and Environmental Modeling (1st ed.), Prentice Hall.
Construction elements classification (Sydenham to Banks town Urban Renewal Corridor, Draft Urban Renewal Corridor Strategy, Department of Planning and Environment - NSW Government, Sydney, Australia. (2017).
Deng, Z., Zhang, X., Li, D. and Pan, G. (2014). Simulation of land use/land cover change and its effects on the hydrological characteristics of the upper reaches of the Hanjiang Basin. Environ Earth Sci.
Galster, G., Hanson, R., Ratcliffe, M. R., Wolman, H., Coleman, S., and Freihage, J. (2001). Wrestling Sprawl to the Ground: Defining and Measuring an Elusive Concept, Housing Policy Debate, 12, 681-717.
Gong, J.Z., Liu, Y.S., Xia, B.C. and Zhao, G.W. (2009). Urban ecological security assessment and forecasting, based on a cellular automata model: a case study of Guangzhou China. Ecol Model, 220(24):3612–3620
Harris, C.D. and Ullman, E.L. (1945). Building the Future City. Annals of the American Academy of Political and Social Science Vol. 242, pp. 7-17.
Herold M., Scepan J. and Clarke K. C. (2002). The Use of Re-mote Sensing and Landscape Metrics to Describe Struc-tures and Changes in Urban Land Uses, Environment and Planning A, Vol. 34, No. 8, 2002, pp. 1443-1458.
Homer Hoyt. (1939). The Structure and Growth of Residential Neighborhoods in American Cities Washington, Federal Housing Administration.
Jantz, C.a., Drzyzga, S., Maret, M. (2014). Calibrating and validating a simulation model to identify drivers of urban land cover change in the baltimore, md metropolitan
region. Land 2014, 3, 1158-1179; doi: 10.3390/land3031158
Jantz, C.a., Goetz, S. J., Donato, D. (2010). Designing and implementing a regional urban modeling system using the SLEUTH cellular urban model. Computers, Environment and Urban Systems 34 (2010) 1–16
Maeda, E.E., Almeida, C.M., Ximenes, A.C., Formaggio, A.R., Shimabukuro, Y.E. and Pellikka, P. (2011). Dynamic modeling of forest conversion: simulation of past and future scenarios of rural activities expansion in the fringes of the Xingu National Park, Brazilian Amazon. Int J Appl Earth Obs, 13:435–446
Mao, X., Meng, J. and Xiang, Y. (2013). Cellular automata-based model for developing land use ecological security patterns in semi-arid areas: a case study of Ordos, Inner Mongolia China. Environ Earth Sci, 70(1):269–279
Mohammady, S., Delavar, M. R., Pahlavani, P. (2014). Urban growth modeling using an artificial neural network, a case study of Sanandaj city, Iran, The International Archives of the Photogrammetry, Remote Sensing and Spatial Information Sciences, The 1st ISPRS International Conference on Geospatial Information Research, Tehran, Iran.
Nourqolipour, R., Shariff, A., Balasundram, S.K., Ahmad, N.B., Sood, A.M., Buyong, T.and Amiri, F. (2014). A GIS-based model to analyze the spatial and temporal development of oil palm land use in Kuala Langat district. Environ Earth Sci, Malaysia.
Park, R. E., Burgess, E. W., & McKenzie, R. D. (1925). The city. Chicago, Illinois: The University of Chicago Press.
Pijanowski, B.C, Tayyebi, A., M. R., Delavar, and M. J, Yazdanpanah. (2009). Urban Expansion Simulation Using Geospatial Information System and Artificial Neural Networks, Int. J. Environ., Res., 3(4):493-502.
Project Gigalopolis. (2018). http://www.ncgia.ucsb.edu/ Robinson, D. T., Murray-Rust, D., Rieser, V., Milicic, V.,
and Rounsevell, M. (2012). Modelling the impacts of land system dynamics on human well-being: Using an agent-based approach to cope with data limitations in Koper, Slovenia. Computers, Environment and Urban Systems, 36(2), 164–176.
Triantakonstantis D. P. (2012). Urban Growth Prediction Modelling Using Fractals and Theory of Chaos, Open Journal of Civil Engineering, 2, 81-86
United Nations, World urbanization prospects: Department of Economic and Social Affairs, Population Division. (2014). https://archive.is/wOOs1