ISSN 0975-928X
Research Note
Genetic divergence for quantitative traits in rice germplasm
P. K. Bhati*, S. K. Singh, S. Y. Dhurai and Amita Sharma
Department of Genetics and Plant Breeding, Institute of Agricultural Sciences, Banaras Hindu University, Varanasi - 221 005, Uttar Pradesh, India
Email: bhatipradeep5@gmail.com
(Received: 09 Oct 2014; Accepted: 7 Nov 2014) Abstract
An investigation was carried out with 52 genotypes of rice to study the nature and magnitude of genetic divergence using D2 statistics. Fifty two genotypes were grouped into 8 clusters based on Euclidean cluster analysis with cluster-IV containing maximum of 14 genotypes. Maximum intra-cluster distance was observed in cluster- IV (187.87) indicating greater genetic divergence among genotypes belonging to this cluster. Number of spikelets panicle-1, plant height, grain panicle-1 and grain yield plant-1 contributed maximum towards genetic divergence. Maximum inter-cluster distance was observed between
cluster-IV and VIII (1875.84) followed by cluster IV and cluster VII (1453.19), cluster II and cluster VIII (1275.66) and cluster II and cluster VII (1034.22) indicating wide genetic diversity between the clusters which may be used in rice hybridization programme(s) for improving grain yield through transgressive breeding. Hence, the crosses between BPT-5204 × IR 58025B, IET 20924 × IR 68897B and BPT-5204 × IR 68897B (cluster-IV × cluster-VIII), BPT-5204 × Khuta Dhan and IET 20924 × Khuta Dhan (cluster-IV × cluster-VII), Dantaswari × IR 58025B and IDR-763 × IR 58025B (cluster-II × cluster-VIII), Dantaswari × Khuta Dhan and IDR-763 × Khuta Dhan (cluster-II × cluster-VII) could be suggested for the exploitation of transgressive segregants for both yield and yield traits.
Keywords
Oryza sativa, clusters, genetic divergence, germplasm, yield Rice is a cereal crop belonging to genus Oryza of family Poaceae. About half of the world’s population depends on rice for their survival. Rice is being cultivated in around 113 countries of the world. The present world rice area, production and productivity is 158.93 mha, 465.03 mt and 4.36 t/ha, respectively. In India, it is being grown in 45.10 mha area with production of 103.60 mt and productivity of 3.51 t/ha and contributes 25% to agricultural GDP (Foreign Agriculture Services/USDA, Office of Global analysis, April 2013).To feed the ever growing population, the targeted rice production of the world, China and India for the year 2030 is envisaged as 771.02, 168.90 and 130.02 million tonnes respectively. Genetic variability is a prerequisite for plant improvement to develop high yielding varieties of crops. The study of genetic divergence in rice genotypes provides an idea of genetic variability among the available genotypes therefore, collection and evaluation of effective germplasm lines becomes the primary objective for any breeding programme(s). Genetic diversity plays an important role in plant breeding since progeny originating from diverse parents exhibit greater heterosis and provide broad spectrum of variability in segregating generations. Genetic diversity is pre requisite for any crop improvement program, as it helps in the development of superior recombinants (Naik et al., 2006). Diversity not only results in inducing genetic variation but also provides new recombination of genes in gene pool. The estimate of genetic divergence in the available germplasm is
important for the selection of desirable donors for breeding programme. Several workers have emphasized the importance of genetic divergence for the selection of desirable parents (Sinha et al. 1991, Rahman et al. 1997, Ashok et al.2014). The use of Mahalanobis’s D2 statistic for estimating genetic divergence has been emphasized by Sarawagi and Rita (2007). The present investigation was aimed to estimate the magnitude of genetic divergence present in the 52 rice genotypes and to identify the diverse genotypes for future breeding programme(s) by using Mahalanobis D2 analysis.
ISSN 0975-928X
50% flowering (period taken from the date of seeding to 50% panicle emergence) and days to maturity (by counting the number of days from date of sowing to grain ripening) on individual plot basis, plant height (measured in cm from ground level to the tip of the main panicle excluding awns at maturity), number of tillers plant-1, number of effective tillers plant-1, panicle length (measured in cm from collar to the tip of the panicle), number of spikelets panicle-1, number of grains panicle -1 (counted at maturity), sterile spikelets/ panicle pollen fertility (%), spikelets fertility (%), grain weight panicle-1 (g), 1000 grain weight (g), grain yield plant-1 (g), kernel length (mm), kernel breadth (mm) and kernel L/B ratio. Panicle and grain characters were recorded on five panicles of selected plants. The experimental data were compiled by taking mean value over randomly selected plants from all the replications and subjected to the following statistical analysis viz; analysis of variance (Panse and Sukhatme 1961) and genetic divergence analysis (Mahalanobis’s 1936, Tocher’s method as described by Rao 1952).
The data collected for all the characters were subjected to statistical analysis as mentioned earlier. The ANOVA for all the characters was found to be highly significant, thus indicating a wide variation for all the traits considered. The studies on genetic divergence based on 17 yield and yield contributing traits among 52 genotypes of rice under three different replications was done by adopting Mahalanobis’s D2 statistic analysis. Wilk’s ‘V’ (statistic) criterion was used to test the significant differences between the groups based on the pooled effects of all the characters. The ‘V’ statistic value was highly significant indicating that genotypes differed significantly when all the characters were considered simultaneously. The significance of genotypes clearly indicated the significant pooled effect of all the characters between different genotypes. Hence, further analysis was made to estimate D2 values.Genetic divergence has been considered as an important factor in discriminating the genetically diverse parents for efficient and successful hybridization programme in order to get potential transgressive segregants. Multivariate analysis using Mahalanobis’s D2 statistic has been found to be a potential biometrical tool in quantifying the degree of divergence in germplasm collections of crop plants. Genetic divergence analysis was conducted to identify suitable parents out of 52 rice genotypes to initiate a breeding programme for development of varieties for seventeen yield and yield contributing characters using Mahalanobis’s D2 analysis. The significance of Wilk’s ‘V’ (statistic) value indicated that the genotypes differed significantly among themselves when all the characters were considered simultaneously. This
indicated that there is a considerable diversity in the material. Tocher’s method of grouping is the most widely used procedure of clustering.
The analysis of variance showed significant difference among the 52 genotypes for all the seventeen characters indicating the existence of high genetic variability among the genotypes for all the traits (Table 2). The D2 values of inter-cluster the genotypes ranged from 0.00 to 1875.84 indicating that the material was quite diverse. Based on the genetic distance, All 52 two genotypes were grouped into eight clusters by using Tocher’s method (Singh and Choudhary 1977). Maximum 14 genotypes were grouped in cluster IV followed by cluster III with 13 genotypes and Cluster I with nine genotypes. Cluster II, Cluster V and cluster VIII had four genotypes. Cluster VI and cluster VII had two genotypes (Table 3). The clustering pattern revealed that the genotypes from different sources clustered together indication that there was no association between eco geographical distribution of genotypes and genetic divergence. The possible reason for grouping of genotypes of different states in one cluster could be the free exchange of germplasm among the breeders of different regions, or unidirectional selection practiced by breeder in tailoring the promising cultivars for different regions. Similar findings were reported by Chaturvedi and Maurya (2005). This indicated that, in general, selection has been towards the same goal in the different centers of origin of these genotypes and yet, there is sufficient genetic variability, which distinctly differentiates them into 8 clusters.
ISSN 0975-928X
belonging to these clusters were relatively closer to each other, in comparison to lines grouped in other clusters. Such analysis was meant to avoid selection of parents from genetically homogenous clusters, and to maintain a relatively broad genetic base. The minimum intra-cluster distance was recorded for cluster-I (59.6), while it was zero for cluster-VI, VII and VIII. The largest intra-cluster distance was recorded for cluster IV (187.87) followed by clusters VI (176.69) and cluster III (140.61) which showed that the lines included in clusters IV, VI and III were relatively more diverse than those in the other clusters. Fifty two genotypes were grouped into eight clusters and each consisted of genotypes from different geographical regions indicating that there was no association between geographical distribution and genetic diversity in corroboration with the reports of earlier workers viz Vivekanandan and Subramanian (1993), Kaw et al. (1995), Senapati and Sarkar (2005), Kumar (2008), Sabesan et al. (2009), Ashok et al.(2014). The genetic diversity among the genotypes may be due to factors like history of selection, heterogeneity, selection under diverse environments and genetic drift. Therefore, for hybridization, the selection of parents should be based on genetic diversity besides per se performance and empirical knowledge of the breeder. The intra-cluster distance was found minimum for cluster-I (59.6) and maximum for cluster-IV (187.87), while it was zero for cluster- VI, VII and VIII (Table 4). The inter-cluster distance was minimum between cluster I and cluster V (105.94) indicating close relationship and similarity for most of the characters of genotypes falling in these clusters. Such analysis was meant to avoid selection of parents from genetically homogenous clusters and to maintain a relatively broad genetic base.
The cluster means (Table 5) for days to 50% flowering varied from 83.56 (Cluster-IV) to 119.75 (Cluster-VI). Days to maturity ranged from 96.92 (Cluster-I) to 170.36 (Cluster-VII). For plant height, cluster means extended from 7.10 (Cluster-VII) to 13.79 (Cluster-III). The mean values for number of tillers plant-1 varied from 5.09 (Cluster-VII) to 11.89 (Cluster-III) and for number of effective tillers plant-1 extended from 22.40 (Cluster-V) to 34.85(Cluster-VII). Similarly, panicle length varied from 112.61(Cluster-IV) to 147.16 (Cluster-VI), whereas the number of spikelets panicle-1 ranged from 134.50 (Cluster-IV) to 469.06 (Cluster-VIII) and number of grains panicle-1 ranged from 112.66 (Cluster-IV) to 436.00 (Cluster-VIII). The cluster mean for Sterile Spikelets/ Panicle extended from17.20 (Cluster-I) to 40.91 (Cluster-VI), The cluster mean for Pollen Fertility (%) extended from 85.34 (Cluster-VI) to 93.83(Cluster-VIII). The cluster mean for spikelets fertility % extended from 84.48 (Cluster-VI) to
90.57 (Cluster-VIII). The cluster mean for grain weight panicle-1 ranged from 2.24 (Cluster-IV) to 8.66 (Cluster-VII) and for grain yield plant-1 ranged from 15.86 (Cluster-V) to 34.68 (Cluster-VII). The 1000-grain weight varied from 12.04 (Cluster-V) to 24.77 (Cluster-VII). The Kernel Length varied from 4.56 (Cluster-VI) to 7.30 (Cluster-II). The Kernel Breadth varied from 1.82(Cluster-VIII) to 2.17 (Cluster-V) and Kernel L/B Ratio varied from 2.39 (Cluster-V) to 3.63 (Cluster-IV)
In all combinations of inter-cluster distances, each character is ranked on the basis of inter-cluster distances. The relative contribution of different plant characters to the total genetic divergence estimated by D2 analysis indicated that maximum contribution (Table 6) spikelets panicle-1 (37.48%) followed by plant height (29.03%), grains panicle-1 (16.29%) and grain yield Plant-1 (6.56%) were the important traits contributing maximum towards divergence in rice. Similar result reported by Kanwal et al. (1983), Bansal et al. (1999) and Prasad et al. (2009) for grain yield plant-1 and plant height Singh et al. (2006). Other characters viz; days to 50% flowering, grain weight panicle-1, number of effective tillers plant-1, 1000 grain weight, panicle length, kernel length and kernel breadth contributed 4.75, 1.51, 1.44, 1.43, 0.75, 0.53 and 0.15%, respectively to genetic divergence in decreasing order. On the contrary, number of tillers plant-1, days to maturity, sterile spikelets panicle-1, pollen fertility and kernel L/B ratio contributed none towards genetic divergence The above study recommends the crosses between BPT-5204 × IR 58025B, IET 20924 × IR 68897B, BPT-5204 × IR 68897B, IET 20924 × IR 58025B and RPBIO-226 × IR 58025B (cluster-IV × cluster-VIII), BPT-5204 × Khuta Dhan and IET 20924 × Khuta Dhan (cluster-IV × cluster-VII), Dantaswari × IR 58025B, IDR-763 × IR 58025B and Dantaswari × IR 68897B (II × cluster-VIII), Dantaswari × Khuta Dhan and IDR-763 × Khuta Dhan (cluster-II × cluster-VII) could be suggested for the exploitation of transgressive segregants for both yield and yield traits.
Acknowledgement
The financial support for this study was provided by Ministry of Science and Technology, Department of Science and Technology, New Delhi, Government of India as a DST-INSPIRE Fellowship(INSPIRE Code IF-20350) for full-time doctoral (Ph.D.) degree programme at Banaras Hindu University, Varanasi, Uttar Pradesh. References
ISSN 0975-928X
Bose, L. K. and Pradhan, S. K. 2005. Genetic divergence in deep water rice genotypes. J. Central European Agric., 64: 635-640.
Chaturvedi, H. P. and Maurya, D. M. 2005. Genetic divergence analysis in rice (Oryza sativa L.). Adv. Plant Sci.18(1): 349-353.
Foreign Agriculture Services/USDA, Office of Global
analysis, April 2013.
http://www.fas.usda.gov/psdonlir.
Kanwal, K. S., Singh, R. M., Singh, J. and Singh, R. B. 1983. Divergent gene pools in rice improvement. Theor. Appl. Genet., 65: 263-267.
Kaw, R. N. 1995. Analysis of divergence in some cold tolerant rice. Indian J. Genet., 55(1): 84- 89. Kumar, A., Singh, S. K., Sharma, Amita, Bhati, P. K.
and Dhurai, S. Y. 2014. Genetic Divergence for Quantitative Traits in Rice Germplasm. Res. J. Agric. Sci.,5(2): 249-253
Kumar, D. B. M. 2008. Genetic divergence in red rice. Karnataka J. Agric. Sci., 21(3): 346-348. Mahalanobis, P. C. 1936. On the generalized distances in
statistics. Proceed. Natural Institution Sci. India 2: 49-55.
Naik, D., Sao, A. Sarawagi, S. K. and Singh, P. 2006. Genetic divergence studies in some indigenous scented rice (Oryza sativa L.). accessions of Central India. Asian J. Plant Sci.,5(2): 197-200.
Panse, V. G. and Sukhatme, P. V. 1961. Statistical methods for agricultural workers. 2nd Edition. ICAR, New Delhi. pp 361.
Prasad, R., Prasad, L. C. and Agrawal, R. K. 2009. Genetic diversity in Indian germplasm of aromatic rice. Oryza ,46(3): 197-201.
Rahaman, M., Acharya, B., Shukla, S. N. and Pande, K. 1997. Genetic divergence in lowland rice germplasms. Oryza, 34(3): 209- 212.
Rama, T. 1992. Heterosis and inbreeding depression in rice. IRRI Newslr., 17(5): 7.
Rao. C. R. V. 1952. Advance statistical methods in biometrical research. John Wiley and Sons Inc, New York. pp 236-272.
Sabesan, T., Saravanan, K. and Anandan, A. 2009. Genetic divergence analysis for certain yield and quality traits in rice (Oryza sativa L.) grown in irrigated saline low land of
Annamalainagar, South India. J. Central
European Agric., 10(4): 405-410.
Sarawgi, A. K. and Rita, B. 2007. Studies on genetic divergence of aromatic rice germplasm for agro-morphological and quality characters. Oryza, 44(1): 74-76.
Senapati, B. K. and Sarkar, G. 2005. Genetic divergence in tall indica rice under rainfed saline soil of Sunderban. Oryza, 42(1): 70-72.
Singh, R. K. and Chaudhary, B. D. 1977. Biometrical methods in quantitative genetic analysis. Kalyani Publishers, New Delhi. pp 1-303. Singh, P. K, Mishra, M. N, Hore, D. K. and Verma, M.
R. 2006. Genetic divergence in lowland rice of north eastern region of India. Communications in Biometry and Crop Sci., 1(1): 35-40. Sinha, P. K, Chauhan, V. S., Prasad. K. and Chauhan, J.
S. 1991. Genetic divergence in indigenous upland rice varieties. Indian J. Genet., 51(1): 47-50.
ISSN 0975-928X
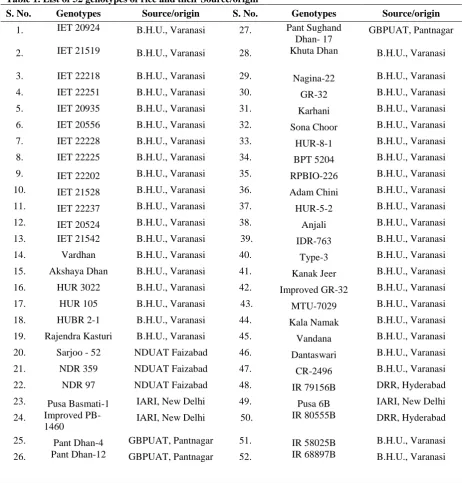
Table 1. List of 52 genotypes of rice and their Source/origin
S. No. Genotypes Source/origin S. No. Genotypes Source/origin
1. IET 20924 B.H.U., Varanasi 27. Pant Sughand Dhan- 17
GBPUAT, Pantnagar
2. IET 21519 B.H.U., Varanasi 28. Khuta Dhan B.H.U., Varanasi 3. IET 22218 B.H.U., Varanasi 29. Nagina-22 B.H.U., Varanasi
4. IET 22251 B.H.U., Varanasi 30. GR-32 B.H.U., Varanasi
5. IET 20935 B.H.U., Varanasi 31. Karhani B.H.U., Varanasi
6. IET 20556 B.H.U., Varanasi 32. Sona Choor B.H.U., Varanasi
7. IET 22228 B.H.U., Varanasi 33. HUR-8-1 B.H.U., Varanasi
8. IET 22225 B.H.U., Varanasi 34. BPT 5204 B.H.U., Varanasi 9. IET 22202 B.H.U., Varanasi 35. RPBIO-226 B.H.U., Varanasi 10. IET 21528 B.H.U., Varanasi 36. Adam Chini B.H.U., Varanasi
11. IET 22237 B.H.U., Varanasi 37. HUR-5-2 B.H.U., Varanasi
12. IET 20524 B.H.U., Varanasi 38. Anjali B.H.U., Varanasi
13. IET 21542 B.H.U., Varanasi 39. IDR-763 B.H.U., Varanasi
14. Vardhan B.H.U., Varanasi 40. Type-3 B.H.U., Varanasi
15. Akshaya Dhan B.H.U., Varanasi 41. Kanak Jeer B.H.U., Varanasi 16. HUR 3022 B.H.U., Varanasi 42. Improved GR-32 B.H.U., Varanasi
17. HUR 105 B.H.U., Varanasi 43. MTU-7029 B.H.U., Varanasi
18. HUBR 2-1 B.H.U., Varanasi 44. Kala Namak B.H.U., Varanasi 19. Rajendra Kasturi B.H.U., Varanasi 45. Vandana B.H.U., Varanasi 20. Sarjoo - 52 NDUAT Faizabad 46. Dantaswari B.H.U., Varanasi
21. NDR 359 NDUAT Faizabad 47. CR-2496 B.H.U., Varanasi
22. NDR 97 NDUAT Faizabad 48. IR 79156B DRR, Hyderabad
23. Pusa Basmati-1 IARI, New Delhi 49. Pusa 6B IARI, New Delhi 24. Improved
PB-1460 IARI, New Delhi 50.
IR 80555B DRR, Hyderabad
25. Pant Dhan-4 GBPUAT, Pantnagar 51. IR 58025B B.H.U., Varanasi 26. Pant Dhan-12 GBPUAT, Pantnagar 52. IR 68897B B.H.U., Varanasi
Table 2.ANOVA for Dispersion
Source of Variations df Mean Squares
Varieties 51 1.0111***
Error 101 6.2231
ISSN 0975-928X
Table 3. Cluster composition of 52 rice genotypes (Tocher’s method)
Clusters Number of
genotypes
Name of genotypes
I 9 IET 20935, IET 20556, IET 22202, IET 22237, Akshaya Dhan, Pusa Basmati-1, Karhani, Type-3, Vandana
II 4 Nagina-22, HUR-5-2, IDR-763, Dantaswari
III 13 IET 22218, IET 20524, HUR 3022, HUR 105, HUBR 2-1, Sarju 52, NDR 359, NDR 97 ,Improved PB 1460 ,Pant Dhan-12, HUR-8-1, Anjali, IR 79156B
IV 14 IET 20924, IET 21519, IET 22228, IET 22225, IET 21528, IET 21542 ,Vardhan, Rajendra Kasturi , Pant Dhan-4, Pant Sughand Dhan -17, BPT 5204, RPBIO-226, MTU-7029, CR-2496
V 4 GR-32, Sona Choor, Adam Chini, Kanak Jeer
VI 2 Improved GR-32, Kala Namak
VII 2 IET 22251, Khuta Dhan
VIII 4 Pusa 6B, IR 80555B, IR 58025B, IR 68897B
Table 4. Inter-cluster and Intra-cluster (diagonal) average of D2 and D values (parenthesis) of 52 rice genotypes (Tocher’s method)
Clusters I II III IV V VI VII VIII
I 59.601 (7.720)
156.305 (12.502)
148.464 (12.184)
409.821 (20.244)
105.936 (10.292)
337.118 (18.360)
721.577 (26.862)
753.607 (27.451) II
86.176 (9.283)
149.846 (12.241)
193.978 (13.927)
265.766 (16.302)
391.879 (19.795)
1034.218 (32.159)
1275.658 (35.716)
III 140.609
(11.857)
315.166 (17.752)
229.805 (15.159)
340.776 (18.460)
846.994 (29.103)
1016.507 (31.882)
IV 187.874
(13.706)
552.461 (23.504)
587.900 (24.446)
1453.190 (38.120)
1875.844 (43.311)
V 0.000
(0)
252.146 (15.879)
613.963 (24.778)
525.965 (22.933)
VI 176.691
(13.292)
487.603 (22.081)
847.234 (29.107)
VII 0.000
(0)
370.540 (19.249)
VIII 0.000
ISSN 0975-928X
Table 5.Cluster means for seventeen characters in 52 genotypes of rice (Tocher’s Method) Clusters Days to
50% Flowering
Days to Maturity
Plant Height(cm)
Tillers Plant-1
Effective Tillers Plant-1
Panicle Length (cm)
Spikelets Panicle-1
Grains Panicle
-1
Sterile Spikelets Panicle-1
Pollen Fertility
(%)
Spikelet Fertility (%)
Grain Weight Panicle
-1
(g)
1000 Grain Weight
Grain Yield Plant-1 (g)
Kernel Length (mm)
Kernel Breadth
(mm)
Kernel L/B Ratio I 105.792 96.923 12.185 9.684 25.582 135.208 243.033 225.787 17.208 92.159 90.333 4.432 20.371 29.603 6.737 2.132 3.211 II 94.768 103.574 11.659 8.582 26.889 122.319 189.359 165.577 24.661 90.818 86.134 3.659 23.769 25.980 7.308 2.052 3.566 III 96.917 108.525 13.792 11.898 26.084 125.208 228.417 194.958 33.042 87.758 84.752 3.115 21.298 30.526 6.556 1.847 3.587 IV 83.556 113.622 12.003 9.711 25.383 112.611 134.500 112.667 21.722 88.302 84.492 2.242 22.732 20.790 6.682 1.880 3.632 V 105.000 105.633 11.333 7.607 22.400 134.000 297.000 276.333 20.667 91.300 85.800 2.997 12.040 15.867 5.177 2.173 2.390 VI 119.750 154.733 9.483 7.591 28.400 147.167 287.833 247.583 40.917 85.343 84.480 3.369 14.507 19.518 4.568 1.915 2.461 VII 107.000 170.367 7.100 5.090 34.850 134.333 391.667 361.667 30.000 92.887 90.367 8.660 24.773 34.687 5.753 1.843 3.113 VIII 107.000 111.700 10.567 7.753 25.400 132.667 469.067 436.000 33.067 93.833 90.560 6.717 14.317 26.397 6.883 1.823 3.283
Table 6. Contribution of seventeen characters in 52 genotypes of rice
Sources Times Ranked 1st Contribution %
1 Days to 50% Flowering 63 4.75
2 Plant Height (cm) 385 29.03
3 Tillers plant-1 0 0.00
4 Effective Tillers plant-1 19 1.43
5 Panicle length(cm) 10 0.75
6 Days to maturity 0 0.00
7 Spikelets panicle-1 497 37.48
8 Grains panicle-1 216 16.29
9 St. spikelets panicle-1 0 0.00
10 Pollen fertility % 0 0.00
11 Spikelet fertility % 1 0.08
12 Grain weight panicle-1 (g) 20 1.51
13 1000 Grain weight (g) 19 1.43
14 Grain Yield Plant-1 87 6.56
15 Kernel length (mm) 7 0.53
16 Kernel Breadth (mm) 2 0.15