Survey of HIS Method in Image Change
Detective Algorithms Using Kernel Techniques
Gholam Reza Shahriari, Seyed Mostafa Bijani, and Abolfazl Amiri
Department of electronic and engineering, azad booshehr university,Booshehr,Iran Email:Ghreza50@yahoo.com, [email protected], [email protected]Abstract—This article is studied changes detection used in
hyper spectrum images. Change Detection (CD), processing of identity and non-dependent studies and spectral changes in the signal. Sensors hyper spectrums of image (HSI) are able to collect data on thousands of narrow-band spectrum. Also the sensors provide High spatial resolution and immaterial valuable data that can be useful for CD. This process developed and used in algorithms to detect changes in hyper spectrum images for The main objective of this study is to investigate HSI differences in algorithms of detect changes. Studied methods in this article including differing image, the image processing, the principal component analysis, identifying changes of linear chronogram, correlation coefficient of the possibility, scale of detect differences of coronel changes. Algorithms in MATLAB is displayed and their efficiency shows with a false alarm clauses rate and deleted changes.
Index Terms—hyper spectrum xerography, detective
algorithms of changes (HIS), spatial resolution, ratio forming of image.
I. INTRODUCTION
The ability to detect and identify changes in the images of the same scene at different times have been of image processing researchers` favorite over the years which due to the large part of inclusion number of administrative programs in doctrine is varied. Xerography of detect ability of tiny changes lead to high false alarm rate will limit EO / RGB . Hyper imaging spectrum (HIS) notwithstanding the spectral information includes the most detect ability. Almost motion is defined as variety while the spectral changes are due to changing position of objects. Legal force and army are interested in monitoring vehicles. Identification of vehicles and their movement`s change could benefit from monitor with perform the operator of intruders or the activities. Identify changes include quickly impact assess or event damage or an activity . Hyper spectrum imaging is suggested to achieve this relatively new technology. Therefore, the purpose of this article is development and implementation of algorithms for the detection and identification of false warnings regarding the use of hyper spectrum images. The challenges and complexity of data is HIS.
Manuscript received April 25th, 2013; revised July 24, 2013
II. PURPOSES
The following cases are achieved:
Provide a background in HIS and CD field. Survey and comparison of existing CD methods Perform various CD algorithms in HIS data and
compare their performance using data of changes Survey of CD validity on the base of HIS using
different methods
Discuss about results and future different research ways
III. HYPER SPECTRUM IMAGING
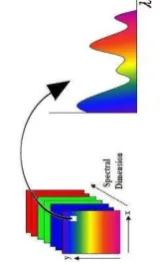
The main idea related to hyper spectrum imaging in the detection position of change is subject herein. Hyper spectrum cubes as image storage, is considered one on top of another, where each picture in storage is expressing IFOV in bar is at a certain wavelength of light. Thus, two dimensional images from scene is provided with three-dimensional image cube, where the third dimension represents the wavelength of the light .
Each point or pixel in the image is collected with hyper spectrum sensor with general information about the spectrum of the light. However, the discrete spectrum HSI includes data with higher resolution than RGB images or EO . Different materials have different absorption dependent on the wavelength . Hyper spectral images of reflected energy are recognized as spectral symptoms. Fig. 1 shows how to produce a complete spectrum for each pixel of the image by spectrums of hyper spectral imaging.
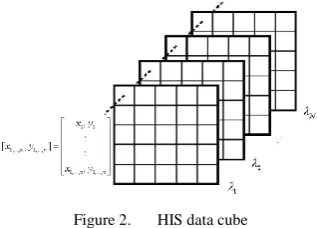
Format of HIS cube is shown in Fig 2. Pixel vector describes ƛn in special spectral range as pn = (xn, yn) =( 1 [x1,y1,…,xN,yN]T with each (x1,y ) represents position of pixel in image.
At each pixel location, the density is recorded as a function of wavelength which creates a continuous spectrum of symptoms. In this Cube, x and y suggest the number of bands hyper spectral data. as matrix image, three-dimensional array of pixel density is created.
Figure 2. HIS data cube
However, HSI sensors act as cameras; images were collected at a continuous wavelength are considered as the video frames contains . The set of HSI images cube 001 per set of milliseconds to several seconds or more. Moving object within a set of HSI image results moving spectral. In fact, HSI objects through different bands of video of motion is created with showing collected images in successive spectral bands. The most interesting, following the movement of the images is perform by bands. Review HSI continuesfor images in Cd means of for CD are possible in the two cases: of use of HSI Cubes which seek changes in the two images cubic to CD cubic collected in both directions and CD between the spectral bands in a single cube in a way. All methods dicussed CD these two states (Table I). are performable in
TABLE I. METHODS DISCUSSED CD IN TWO STATES
statement application describe situation discover of temporary changes Most of usage
related to CD processing CD band
frequency like frequency analysis
of different cubes band Cube to cube Depend on sensor compentency Allow to processing with frequencies CD like cube
analysis of succesfull frequency bands Band to
band
These states are suggested in pictures which HIS cube data are following them.
Figure 3. Analysis of cube to cube changes
Figure 4. Analysis of band to band changes
IV. DIFFERENT ALGORITHMS OF HYPER SPECTRAL IMAGING IMAGE DIFFERENTIATE
Image differentiate is one of the easiest and very useful CD techniques. Differentiate trying to find the ranges of a scene which constantly changing and usually correspond motion or movement in the scene.
Image differentiate Includes detract the number of density in the same pixel location of two images that have been taken in two different periods of time.
The two images simultaneously recorded are compared pixels–pixels and pixel-related with transitive boundaries causing changed significantly, of the pixels associated with unchanged area of the third new image.
(1)
The third image or different image for making change or any change classification by the beginning is analyzed . The main stage of the CD way is law identity. The only corresponding pixel in different images which is above the beginning is adverse with result changes in its place. After implementation, the different binary image is created, every existing pixel in show a change with the value of 1 (white) and unchanged pixels with value 0( Black).
V. PRINCIPAL COMPONENT ANALYSIS
A principal component analysis is a linear deformation
technique
and probably the most common type of thisFigure 5. Analysis to identify changes of Principal component
(2)
It is suggest that this explanation for CD analysis cube to cube is described, but can be easily be converted into a single cube within a band. Therefore the use of PCA for CD consists of components with the lowest correlation as title the 2nd principal component which reflect changes in the data are under review.
VI. THE SCALE OF DETECTIVE DIFFERENCES OF KERNEL CHANGE
This section is described CD process based on techniques of kernel forming. The compare of two discussion area is necessary in different locations within the same time to achieve CD. Using the kernels, the design of the nonlinear input space into design space causes linear discrete data. It is described that a separator in high-dimensional space with a curved design vectors input variables in the raw space dimension is low. Fig. 6 shows how to design non-linear data by kernel design space where the linear hyper sheet is a remarkable individual.
Figure 6. Design non-linear data
Kernel functions with respect to the data acts on top atmosphere . The most common linear kernel, multi number, the main function of a kernel of radius mathematically, is described as point between the spines of the input variables.
Kernel function is defined as linear production to proof Mercer theory.
Except for calculating the cost of Kernel function K (x, y) by is not associated with additional cost of consumption. Outline clearly never be calculated.
Many kernel functions are suggested for this mapping, however, all kernel functions are equally useful. For this study, two types of kernel functions considered are the following:
1. Multi number kernel
( , )
(
T) ,
d0
tan
k x y
x y
where d
is a cons
t
2. RBF kernel
2
2
( , ) exp , 0 tan
2 x y
k x y where is a cons t
Here, d is the degree of multi number kernel and σ is Gussian variance. Both kernels take advantage of Mercer locations and is used for mapping .
At first kernel is normalization for each pixel in the data set is k (x, y) = 1 . This approach is valid because each kernel which shown with point is normalization and the main kernel result will remain.
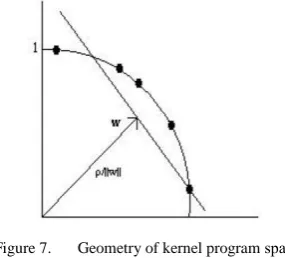
Before advancing to scale of differences, design space geometry is shown in Fig. 7 with w and p parameters to define a hyper sheet.
Figure 7. Geometry of kernel program space
VII. HIS DATA COLLECTION
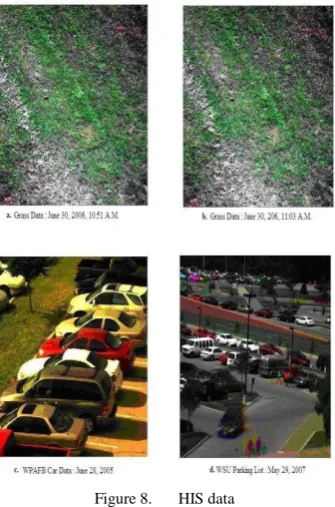
This study uses of HIS data series for CD techniques analysis. Measured close to the target of data cube collection consists of taking pictures 215 * 215 gray levels with 33 strips 400nm to 720nm. On the each tape, a dark offset is obtained and decrease from the original. the first data collection which shown in Fig. 8 (a) and Fig. 8 (b) footer purely used to Cube to Cube analysis.
Figure 8. HIS data
VIII. SPECTRAL SIGN ANALYSIS
Understanding the spectral signs in the interpretation of spectral data cube images hyper spectral is necessary. Different cases are distinct with dependent wavelength absorption and reflection. Thereby each plan contains a graphical representation and unique spectral reflectance so a function of wavelength is generated which is defined as its spectrum bookmarks. Hyper spectral sensors provide a highly sophisticated way regard to spectral symptoms that because of the scan of hundreds of very narrow spectral bands with a possible space for the continuous spectral response curve . Fig. 9, Fig. 10 and Fig. 11 represents image statistics of at different image cubic data has been collected which described in the previous section. The presented plans survey the average, maximum, minimum, and standard deviation of the data points .box drawn on the image express the selected pixels are used in the statistical analysis. This method of extraction of spectral cues assess potential problem of saturation sensor.
Design cut is on top of the region of Fig. 11 sensor saturates that potentially makes some 11scales invalid.
Figure 9. Image statistics of grass data
image statistics of
Figure 11. Car information
Different cases are diverse with absorption and reflection which is depends on wavelength. Results of Process of this experiment are shown in Fig. 12 longest wavelength band corresponding to 720nm is considered to make a distinct change.
And hence, different Cornell Scale for cube to cubic case is considered.
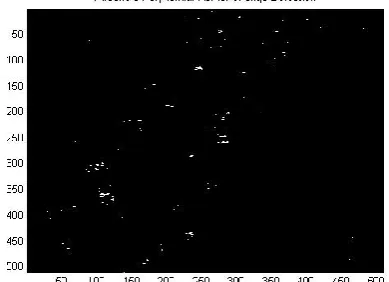
The binary change design of initial for multi numerical kernel is shown in Fig. 13.
Figure 12. Change design of measure differences of multi numerical kernel
Figure 13. Initial of change design of measure differences of multi numerical kernel
In the comparison, the algorithm of kernel differences is configured by use of the kernel Kernel function of radial basis Gaussian.
(5)
RBF
where, 5.0 = σ it objectively chosen as a parameter. The impact result of kernel RBF parameters is shown in Fig 14. Fig 15 shows the results of initial different kernel parameter.
Figure14: Change design of measures differ kernel RBF
Figure 15: Initial change design measures kernel
RBF
The above results are in the cube to a cube state, visualize features of the two routes which are between the gross pictures.
IX. RESULTS OF LOSS TIME IN GROSS DATA
This study is designed to CD available in different time intervals in the gross way collection . The time of gross data collection is 91:15:01. Then, the scene is specified by two entering paths and leaving scene. The recorded time for the collection of these experiments are summarized in Table II.
TABLE II. SUMMARIZED OF COLLECTION OF THESE EXPERIMENTS
. Figure16: Changes after than 6:32 minutes
. Figure17: Changes after than 11:01 minutes
. Figure18: Changes after than 16:47 minutes
X. CONCLUSION
This paper is set to compare and survey of detect changes relate to the hyper spectral imaging based on spectral and temporal changes between successive observations. The activity reviews CD in the paper. CD dependents on spectral and temporal effects and variability and spectral analysis help to evaluate associated change. Based on visual and quantitative results as above, some primary results about the performance of different CD algorithms in using for specific data sets are considered in the paper. ROC scheme of Fig. 5 to Fig. 8.5 will support this conclusion. based on a background investigation is emphasis kernel algorithm has superior results regard to linear algorithms. Analogous results is shown in Table III in terms of computational complexity that The computational time for each algorithm is estimated to detect changes in the results can be reported.
When the suitable algorithm is selected for the intended application, the computational complexity will be considered .
TABLE III. TIME CALCULATION OF ALGORITHM CHANGE TRACKING
Grass DATA(seconds)
Differencing 23.032
Ratioing 55.078
PCA 77.953
LLC 513.031
Correlation Cofficient 291.156
Kernel(polynomial) 9758.531
Kernel(RBF) 11700.922
REFERENCES
[1] R. C. Aldrich, “Detecting disturbances in a forest environment,” Photogrammetric Engineering and Remote Sensing, vol. 41, pp. 39–48, 1975.
[2] M. A. Alwashe and A. Y. Bokhari, “Monitoring vegetation changes in Al Madinah, Saudi Arabia, using Thematic Mapper data,” International Journal of Remote Sensing, vol. 14, pp. 191–197, 1993.
[3] L. Andres, W. A. Salas, and D. Skole, “Fourier analysis of multitemporal AVHRR data applied to a land cover classification,” International Journal of Remote Sensing, vol. 15, pp. 1115–1121, 1994.
[4] L. Bruzzone and S. B. Serpico, “Detection of changes in remotely-sensed images by the selective use of multi-spectral information,” International Journal of Remote Sensing, vol. 18, pp. 3883–3888, 1997.
[5] L. Bruzzone and S. B. Serpico, “An iterative technique for the detection of landcover transitions in multitemporal remote-sensing images," IEEE Transactions on Geoscience and Remote Sensing, vol. 35, pp. 858–867, 1997.
[6] G. S. Burns and A. T. Joyce, “Evaluation of land cover change detection techniques using Landsat MSS data,” in Proc. 7th PECORA Symposium, Sioux Falls, SD, USA (Bethesda, MD: ASPRS), 1981, pp. 252–260.
[7] V. Caselles and M. J. LÓPEZ GARCÍA, “An alternative simple approach to estimate atmospheric correction in multitemporal studies,” International Journal of Remote Sensing, vol. 10, pp. 1127–1134, 1989.
[8] J. B. Collins and C. E. Woodcock, “An assessment of several linear change detection techniques for mapping forest mortality using multitemporal Landsat TM data,” Remote Sensing of Environment, vol. 56, pp. 66–77, 1996.
[9] J. E. Colwell and F. P. Weber, “Forest change detection,” in Proc. 15th International Symposium on Remote Sensing of Environment,
Ann Arbor, MI, USA (Ann Arbor, MI: ERIM), 1981, pp. 839–852.
[10] J. E. Colwell, G. Davis, and F. Thomson, “Detection and measurement of changes in the production and quality of renewable resources,” USDA Forest Service Final Report 145300-4-F, ERIM, Ann Arbor, MI, USA, 1980.
Gholam Reza Shahryari received a B.S. and a M.S.
Renewable Energy Center of the Young Researchers Club (BPJ), Iran. His main research interests are Analysis and Simulation of Power Regulation and integrated circuits (cmos).
Mostafa Bijani received B.S and M.S degrees. in
Electronic and Electrical of Engineering from Bushehr University, Iran in 2007 and 2011, respectively. From 2011 to 2012, he was a senior researcher in the the Department of Electronic and Electrical Engineering Bushehr & Borazjan University, Bushehr, Iran. He joined the Department of Electrical Engineering of Borazjan University in 2011, where he has been active in research on the digital signal processing systems and intelligent systems using
integrated blocks and circuitshe is also have many done researchers on am modulators, neural network, and automatic gain control and CMOS technology.
Abolfazl Amiri received B.S and M.S degrees in