New image analysis method for the estimation of global and spatial changes
in fruit microstructure**
Piotr M. Pieczywek1*, Justyna Cybulska1, Barbara Dyki2, Dorota Konopacka2, Monika Mieszczakowska-Frąc2, and Artur Zdunek1
1Institute of Agrophysics, Polish Academy of Sciences, Doświadczalna 4, 20-290 Lublin, Poland 2Research Institute of Horticulture, Pomologiczna 18, 96-100 Skierniewice, Poland
Received September 17, 2015; accepted December 7, 2015
*Corresponding author e-mail: [email protected] **This research had been conducted within the ‘BIOSUSZ’ PBS Project financed by the National Centre for Research and Development (PBS1/A8/13/2012).
A b s t r a c t. A new image analysis method for the spatial characterization of microscopy images of fruit microstructure is proposed in order to analyse the heterogeneous microstructure of unprocessed fruit and the possible inhomogeneous effects of various technological treatments on this microstructure. The micro- structure of tissue samples was characterized using the global statistics of size and shape parameters calculated for all visible objects. Global analysis was supported by a novel algorithm that allowed for drawing of the maps of the cell wall fraction from microscopy images and for the analysis of both global and local compaction or loosening of tissue. The spatial distribution of the cell wall fraction was visualised in the convenient form of bivariate histograms. To test the developed image analysis pro-tocols, structural changes resulting from ultrasonic and osmotic treatments of apple tissue samples were studied. Peeled and cored apples were submersed in a liquid medium (distilled water or 60 oBx sucrose solution) for 45 and 90 min with and without ultra-sonic treatment. After these treatment procedures, tissue samples were cut into slices, stained and imaged using a microscope. The proposed method allowed to characterise the effects of different sample treatments.
K e y w o r d s:image analysis, apple, microstructure, osmotic, ultrasound, bivariate histograms
INTRODUCTION
Mass transfer through fruit tissue is affected by several
aspects of its morphology, such as; the intracellular net -work of spaces, cell wall properties, boundary (cell walls) fractions and plasmalemma permeability. The presence of intracellular spaces has a significant influence on the physi-cal properties of plant tissue which consists of a significant
fraction of pores ranging from 1% for tissues that con
-tain densely-packed cells of polygonal shapes like potato or carrot parenchyma, to over 30% in the case of apples (Mebatsion et al., 2009). The percentage volume of pores is associated with firmness and crispness and promotes the texture of mealiness (Harker and Suthrland, 1993). The
structure of the material is important for supplying and
removing the gases (O2 and CO2) required for intracellular
respiration (Ho et al., 2009, 2010, 2011; Mebatsion et al.,
2008) and it also determines water transport mechanisms
(Chiralt and Talens, 2005, Mendoza et al., 2007). Tissue pre-treatments leading to changes in structure may sig-nificantly alter the effectiveness of further food processing techniques. Ultrasound can affect any element of the tis-sue sub-structure ie it can lead to cell-to-cell detachment which increases the space between cells, loosening of cell wall assembly, or it may destroy plasmalemma as well as the tonoplast. Generally, the method of ultrasound (US)-assisted extraction of biocomponents from rigid structures involves the use of high frequencies ie up to 500 kHz. On the other hand low frequencies of 20-40 kHz are used for flexible materials that are complex, substrate-dependent and generally not well characterized (Rosello-Soto et al.,
2015a). Power ultrasound refers to sound waves beyond audible frequency between the range of 20 kHz and 1 MHz, which are able to interact with both solid and liquid media. Depending on the wave frequency and the level of
ener-gy applied, ultrasound can produce chemical, mechanical or physical changes in food processing and the resulting products (Kentish and Ashokkumar, 2011). When power ultrasound is passed through subjected media sequential compressions and expansions are generated, which in turn
leads to acoustic cavitation effects, seen in the form of gas
bubbles in the liquid medium that can explosively collapse and generate localised pressure as well as increases in
tem-perature (Simal et al., 1998; Wan et al., 1992). Due to its ability to interact with a wide range of media, ultrasound is becoming a regular feature in many aspects of agro-food
technology (Cárcel et al., 2012). US treatment is one of those promising non-conventional food processing technol-ogies that is especially suitable for the preservation of the fluid foods. US may be used alone or in combination with other preservation techniques, such as mild heating, high
pressures and antimicrobials (Zinoviadou et al., 2015). US
treatment is also considered to be one of the most impor-tant non-conventional technologies that are being used by different food scientists and industry to improve the recovery rate of high-added value compounds from the
dif-ferent wastes and by-products (Barba et al., 2015a, 2015b;
Koubaa et al., 2015; Rosello-Soto et al., 2015b; Šic Žlabur
et al., 2015). Ultrasonic pre-treatment offers new possibili-ties for biological material modification, something which has been thoroughly investigated, with reference to its use as a tool for enhancing biomaterial drying efficiency
(García-Pérez et al., 2007; Mothibe et al., 2011). Despite
the existence of numerous examples of studies concerning ultrasound-biostructure interactions, the tissue comple-xity and gaps in methodological aspects still require more detailed study that should confirm the anticipated inter-action mechanisms.
The motivation for this study was to show the effect of
ultrasonic and osmotic treatments on the microstructure of
apples as a model fruit. Since the change of microstructure is anisotropic, future research is needed to develop new methods of image analysis. Therefore, the goal of this work was to develop new image analysis methods for global and local characterisation of fruit tissue structure that would be useful for studying structural changes caused by osmotic treatment.
Two methodologies were applied for the evaluation of structural changes of the tissue-conventional global image analysis and a novel analysis based on the
calcula-tion of spatial maps of local variacalcula-tions of tissue structural
parameters. The first one involved image segmentation and quantification using a set of geometric parameters calcu-lated for each individual object. The new methodology presented involves calculations of maps of the cell wall
fraction representing local variations in microstructure
density. Spatial maps were quantified by means of bivariate histograms showing the distribution of the cell wall fraction with respect to the relative position of the sampling area.
MATERIALS AND METHODS
The common apple variety ‘Idared’ was used as a raw material. The apples were collected at harvest maturi-ty from the Experimental Orchard of the Research Institute of Horticulture in Dąbrowice, Poland. Until it was time for processing, the fruit was stored at regular cold storage
conditions (0oC, 90%RH).
The apples were peeled and cored by hand before being cut into 1 cm cubes with a shredder (Hällde RG-100, Kista, Sweden), after which they were submersed in a liquid
medium (distilled water or 60 oBx sucrose solution) with
a fruit to liquid medium ratio of 1:4. The treatment was conducted for 45 and 90 min with and without the
applica-tion of ultrasound. The samples were sonicated at 40ºC in
beakers placed in a water bath (InterSonic, Olsztyn, Poland)
fitted with ultrasonic transducers (25 kHz, 0.1 Wcm-3) and
a shaking plate (30 r.p.m.). After treatment the apple cubes
were removed from the beakers, strained and rinsed for
a few seconds in tap water, then blotted with absorbent paper to remove any excess solution.
For each type of sample treatment two technical repe-titions were carried out. The material obtained was imme-diately frozen and totally dehydrated using a freeze drying method, this allowed for good structure fixation. As a refe-rence material freshly cut apple cubes were frozen and freeze dried without any treatment. Freeze drying was car-ried out using a standard procedure – samples were frozen using liquid nitrogen and placed in the vacuum chamber of a lyophiliser. Finally 9 objects with different tissue structure modifications induced by various technical treat-ments, with and without the application of ultrasound were generated.
For histological (planimetric) studies fragments of freeze dried apples of diversified tissue structure were obtained using the procedure described above. The micros-copy samples were prepared using the standard paraffin method. The cubes of apples tissue were fixed with CrAF (chromic acid, acetic acid, formalin), dehydrated in ethanol and embedded in paraffin. Material hardened in paraffin was cut into slices using a rotary microtome (PFM Medical Rotary 3002), each slice had a thickness of 15 µm, and then the slices were stained with safranin and fast green for light
microscopy analysis (Gerlach, 1972).
For the analysis of global geometrical descriptors of
tissue microstructure, images from an optical transmis -sion microscope were used. Images were captured using an OLYMPUS BX51 (Olympus Corporation, Tokyo, Japan) microscope, equipped with UPlanSApo 4x/0.16 eyepiece with 4x magnification. Images were recorded with a resolu-tion of 1024 pixels. The pixel size was 3.14 μm. For each treatment, 10 to 20 microscopy images were recorded. The images were segmented using a proprietary code developed in Matlab (MathWorks, Natick, MA, USA) and the image analysis tool pack. Due to vignetting of the optical sys-tem all images were pre-processed using the illumination field flattening procedure. The contrast and clarity of the images were enhanced by consecutive Top-hat and Bottom-hat operations. Subsequently, a median filter was applied
in order to remove noise from the images and to smooth
for all images. Partially separated objects were merged by
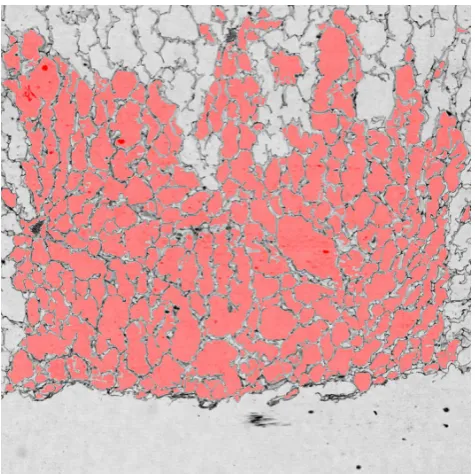
means of consecutive morphological operations – dilata -tion and erosion (Fig. 1).
All boundary objects as well as objects consisting of less than 100 pixels were excluded from the analysis. Statistical analysis was carried out on representative sam-ples of 1050 objects randomly selected for each treatment. Furthermore no distinction between cells and intracellular spaces was made. All objects were analyzed without being divided into categories.
Each selected object was described by four geometrical
descriptors: area, perimeter, elongation, and circularity that
were calculated using standard MATLAB protocols. In order to obtain maps of the cell wall fraction from the cross-sections of the sample, images were captured using an Olympus SZX16 microscope with SDF PLAPO 1.6XPF objective. Images were recorded with a Canon Power Shot A640 digital camera. Initial imaging resolution was equal to 1.93 μm per pixel. Images used for cell wall fraction mapping were composed of 4-5 smaller pictures of tissue samples. Due to long processing times, the final mosaic images were scaled down to 25% of their initial size (8.6 – 9.0 mega pixels). Images were recorded in transmis-sion mode.
Images of apple tissue samples were captured in RGB colour space and initially de-noised with a 3 x 3 median filter. The contrast and clarity of the images were enhanced by consecutive top-hat and bottom-hat operations. Contrast enhancement was achieved by subtraction of the image resulting from the bottom-hat operation from the sum of the original image and the result of the top-hat operation.
Application of the illumination field-flattening procedure was required, because the optical system produced a rela-tively strong effect of vignetting. The non-uniformity of field illumination was reduced by the subtraction of the background image from each individual channel. The background image was obtained from the morphological
opening of the complement of the original image, using
a relatively large structural element in the shape of disk. The image segmentation procedure was based on colour information stored in CIE L*a*b* colour space. Using the CIE L*a*b* colour space transformation, the image was
divided into three components - the lightnessL*
compo-nent and two colour compocompo-nents a* (green-magenta) and b* (blue-yellow). The colour transformation was carried out using built-in Matlab protocols described in the Mathlab Reference Guide (Mathworks, 2011). The following seg-mentation was based on two colour components a* and b*, which served as the input data for the k-means clustering algorithm. Clustering was carried out using the squared Euclidean distance as a measure of the distance between cluster centroids. The clustering algorithm was run ten times with the assumption that three clusters were present in the image data. The iteration of the lowest within-cluster sums of point-to-centroid distances was chosen as the final result. It was assumed that the pixels of the biggest cluster represented the image background, while the sum of pixels of the two remaining clusters indicated cell walls. On this basis cluster data was converted into binary images of cell walls (Fig. 2a).
All objects consisting of less than 50 pixels were removed from the binary image. Next, the morphological closing function was applied, and all holes visible on the binary image were filled. Holes were defined as a set of background pixels that could not be reached by filling in the background from the edge of the image. The final bina-ry image showed the silhouette of the whole tissue sample (Fig. 2b).
The original binary image of cell walls and the silhou-ette image were convolved using a mask image in shape of a circle. The values of all the pixels of the mask image inside the circle were equal to one; therefore convolution was computed as a cumulative sum of pixel values that overlapped non-zero elements of the mask image.
Next, the convolved cell wall image was divided pixel-wise by the convolved silhouette image. As a result of this operation local values of cell wall fractions (Fig. 2d) were calculated with respect to the pixel neighbourhood defined by the radius of the circle of the binary mask image. To enhance the local variations of the cell wall fraction the global trend of spatial data (Fig. 2e) was estimated and sub-tracted from each map. The global trend of data distribution was approximated by fitting of the plane equation to cell wall fraction data. The final image (Fig. 2f) shows a map of the cell wall fraction after subtraction of the global trend of data distribution.
Finally spatial distribution of the cell wall fraction in examined samples was quantified using bivariate histo-grams. Histograms showed frequencies of co-occurrences of values of the two analyzed variables – cell wall fraction and pixel distance from the sample centre. Histograms were in a shape of two dimensional 10 x 10 matrices with rows corresponding to cell wall fraction intervals and columns corresponding to intervals of normalised distance, both
organised in ascending order with the origin at the bottom left corner of the matrix. Each entry of this matrix indi-cated the number of occurrences of the cell wall fraction at a certain distance that falls into a specific combination of intervals.
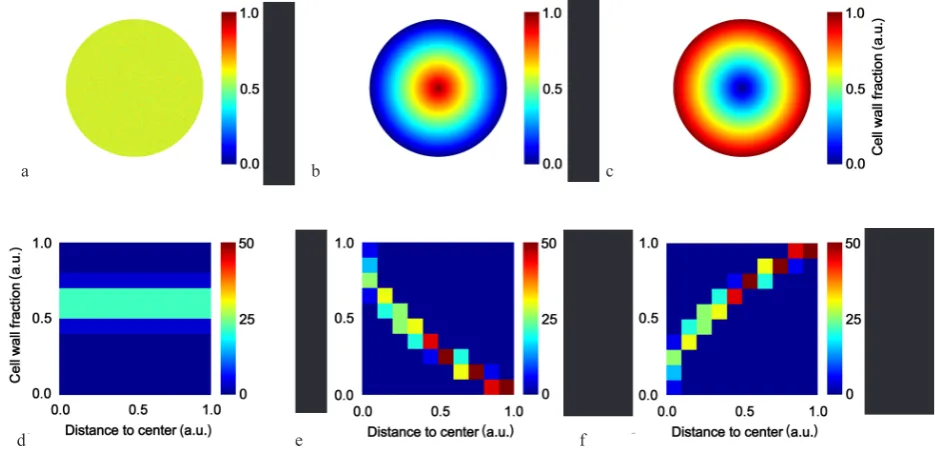
The spatial position of pixels expressed as the distance from the sample centre was calculated using the Euclidean distance transform of the binary silhouette image. Distance Fig. 2. Image processing steps for the evaluation of the spatial distribution of the cell wall fraction: a – binary image of cell walls, b – binary silhouette image, c – pixel distance map, divided into ten equally sized sections, d – absolute cell wall fraction map, e – global trend of the cell wall fraction, f – map of the cell wall fraction after subtraction of the global trend.
Fig. 3. The bivariate histogram patterns shown as an example of model data: a and d – an example of an artificial sample with Gaussian distribution of the cell wall fraction and corresponding bivariate histogram, b and e – an example of artificial sample with cell wall fraction gradually descending towards the edges of silhouette, c and f – an example of artificial sample with cell wall fraction gradually ascending towards the edges of silhouette.
a
a
b
b
c
c d
d
e
e
f
values were scaled to fit the 0-1 range (Fig. 2c) and divided
into ten intervals that occupied the same area of the distance
map. For each interval, a histogram of cell wall fraction values was calculated and used as columns of bivariate his-togram matrix.
In order to investigate the behaviour of bivariate histo-grams three artificial types of cell wall fraction distribution were generated (Fig. 3a, b, and c) and tested on the exam-ple of a circle shaped samexam-ple. Figure 3a depicts the case of uniform distribution of the cell wall fraction, which is shown in the corresponding bivariate histogram (Fig. 3d). In the case of other two examples spatial trends are
pre-sent ie the values are descending (Fig. 3b, e) and ascending (Fig. 3c, f) towards the edge of the sample. Bivariate his-tograms (Fig. 3d, e, and f) should be interpreted in the following way:
• in the case of uniformly distributed cell wall fraction over the whole area of sample the entries of the histogram matrix have similar values and are organised in horizon-tal direction (Fig. 3d);
• when the cell wall fraction changes with distance, the histogram data is organised in diagonal directions, with
slope depending on the rate and direction of the change
of cell wall fraction;
• when cell wall fraction values decrease towards the edge of the sample the slope has negative value (Fig. 3e); • for samples for which cell wall fraction increases along
with the distance from the sample centre the slope has positive value (Fig. 3f).
The statistical analysis of global descriptors was car-ried out using Statistica 10 software (StatSoft, Inc., Tulsa, USA). Differences between micromechanical features of samples subjected to different treatments were analyzed using a one-way ANOVA and post-hoc Tukey HSD test at p=0.05.
RESULTS AND DISCUSSION
At the present time image analysis is a well-developed method allowing relatively easy extraction of quantitative
data from microscopy images (Pieczywek and Zdunek,
2012). Therefore, within the framework of this study, a new method has been developed that allows maps of cell wall fraction to be drawn from microscopy images and moreo-ver it allows analysis of both global and local compaction or loosening of tissue. The method is validated with the images of apple tissue subjected to different pre-drying treatments, thus varying the extent of cellular structure modifications. The objects were preserved using standard fixation and preparation methods, and then observed with
an optical transmission microscope, so the procedure could
be easily adapted to any other experimental protocol.
The representative images of apple tissue structure,
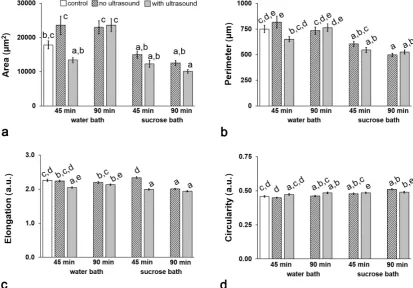
obtained after the applied treatments, are presented in Fig. 4. As it is visually apparent, exposure to both kinds of liquid media and US assistance, induced large modi-fications in size and shape parameters of the observed microscopic objects. The graphical representation of four geometrical descriptors of microstructure is shown in Fig. 5. Unfortunately, due to wide range of values and high skew-ness of data distribution, the one-way ANOVA analysis was unable to provide perfectly clear evidence for statisti-cal difference between each group of samples. To be able to analyse the extent of the observed structure changes more thoroughly, the detailed data on the geometric
para-meters of all the samples, including statistical information,
is summarised in Table 1.
In general, the process of apple cubes submersion in a water bath without ultrasound assistance led to an increa-se in object areas (Fig. 5a). The increaincrea-se in number of lar-ge size objects was indicated by higher maximum values and lower medians compared to control sample (Table 1).
Fig. 4. Microscopy images of apple parenchyma tissue after submersing in: a, b, c, d – 60° Brix sucrose; e, f, g, h – distilled water; with and without ultrasonic treatment.
a
e
b
f
c
g
d
h
W
ater bath
Also, slight decrease in mean, median and maximum area of objects was observed when the treatment duration was extended. However statistical analysis showed no signifi-cant difference between control sample and the samples treated for 45 and 90 min (Fig. 5a). Similar trends as for object areas were observed for perimeter values.
In the case, when the apple tissue was immersed in a water bath, but the treatment was combined with the application of the ultrasound, the opposite effect was observed. First, a sample immersed in distilled water for 45 min displayed slight decrease in object areas in com-parison to the control sample, however, when the treatment duration was extended to 90 min, large and statistically sig-nificant increase in mean, median and maximum of object areas was observed. As before, similar conclusions applied to the changes in perimeters of objects. To summarise, the immersion of apple cubes in distilled water carried out for 90 min, with and without the application of ultrasonic waves, caused expansion of tissue structure and increase in size parameters (area and perimeter).
In contrast to the immersion of the apple cubes in dis-tilled water, their osmotic treatment in sucrose solution (sucrose bath) led to the contraction of the structure, result-ing in decrease of both size parameters discussed above (Fig. 4a, b). Moreover, the longer the treatment in sucrose solution was, the greater contraction effect was observed.
The contraction of the tissue structure was intensified when the sample processing was enhanced by ultrasonic treat-ment. The phenomena of mass exchange intensification observed for US-treated fruit and vegetable tissue is attri-buted to changes in microstructure, especially to the
crea-tion of microscopic channels that favour easier moisture
removal (Garcıa-Perez et al., 2006). Statistically significant
decreases were reported, both for object area, as well as for the perimeter, (Fig. 5a, b).
Regarding the other shape parameters, submersion of apple cubes in a water bath resulted in a decrease of elonga-tion of objects (average, maximum and median) (Table 1, Fig. 5c). After 90 min in water bath, with and without ultrasonic treatment, the average elongation of objects was lower when compared to the control sample. With the US treatment the average elongation was slightly lower; however, the difference between both treatments was not statistically significant. With ultrasound- aided treatment, the decrease was statistically significant after just 45 min.
T a b l e 1. Mean values and standard deviations of the measured geometrical descriptors for all treatments
Parameter Medium Ultrasound treatment Duration (min) Mean Standard dev. Minimum Median Maximum
Area (µm2)
Water
No 45 23 580 91 257 1 163 5 151 1 770 832
90 22 954 66 580 1 163 4 616 1 156 554
Yes 45 13 420 26 666 1 163 4 634 379 355
90 23 610 65 536 1 163 5 994 965 109
Sucrose
No 45 14 964 35 141 1 163 4 686 527 834
90 12 558 25 560 1 163 4 052 624 441
Yes 45 12 269 33 820 1 163 4 000 808 909
90 10 112 19 719 1 163 4 000 354 134
Control No 0 17 814 40 364 1 163 5 744 715 582
Perimeter (µm)
Water
No 45 818 2 021 126 379 37 617
90 735 1 166 123 365 12 906
Yes 45 653 913 122 354 9 202
90 764 1 296 127 384 18 422
Sucrose
No 45 605 887 126 352 13221
90 498 570 126 330 14 086
Yes 45 546 880 127 339 17 224
90 527 673 126 329 9 337
Control No 0 750 1 269 124 402 22 532
Elongation (a.u.)
Water
No 45 2.24 0.97 1.03 2.01 8.85
90 2.19 1.00 1.03 1.95 9.11
Yes 45 2.05 0.81 1.03 1.82 7.15
90 2.13 0.85 1.04 1.88 7.12
Sucrose
No 45 2.34 1.06 1.01 2.07 8.88
90 2.00 0.75 1.01 1.83 6.45
Yes 45 1.99 0.75 1.02 1.81 6.14
90 1.94 0.68 1.02 1.77 5.55
Control No 0 2.26 1.05 1.01 1.97 9.45
Circularity (a.u.)
Water
No 45 0.45 0.19 0.01 0.44 0.97
90 0.46 0.19 0.03 0.47 0.99
Yes 45 0.47 0.22 0.03 0.46 0.99
90 0.49 0.19 0.03 0.49 0.99
Sucrose
No 45 0.48 0.18 0.04 0.47 0.98
90 0.51 0.17 0.04 0.50 0.99
Yes 45 0.48 0.18 0.02 0.48 0.96
90 0.49 0.21 0.05 0.49 0.99
Fig. 6. Maps showing distribution of relative cell wall fraction for tissue samples after submersing (45 or 90 min): a, b, c, d – in sucrose 60 °Brix; e, f, g, h – distilled water; with and or without ultrasound treatment. False colours indicate the range of the cell wall fraction from 0 to 0.2.
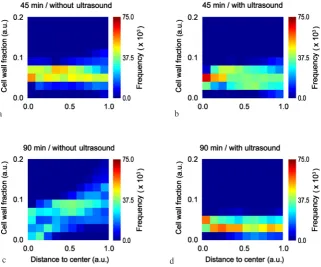
Fig. 7. Bivariate histograms showing the distribution of relative cell wall fraction with respect to spatial position for tissue samples dehydrated in sucrose, visualised in normalised false colours scale: a and b – 45 min treatment without and with US respectively, c and d – 90 min treatment without and with US respectively.
a
a e
b
b f
c
c
g
d
d
resulted in a further slight decrease in elongation, however no significant difference between samples treated for 45 and 90 min was observed.
Regarding object circularity, the same trend was observed – the treatment time elongation favoured an
increase in the average circularity value for all the treat -ments. After 90 min for almost all applied treatments the observed increase, even though relatively small, was statis-tically significant.
As already mentioned, despite distinct structural modi -fications, clearly noticeable in images presented in Fig. 4, the classical analysis of global descriptors (Fig. 5) did not allow a satisfactory quantification of the structural changes. This is indeed due to possibility of heterogeneous original structure and a possibility of inhomogeneous effect of the
treatment on the tissue (Legland et al., 2012). This would
be the case particularly for dehydrated fruit tissue that may not shrink in a uniform manner (Lewicki and Pawlak-Porzecka, 2005). Thus, the urgent reason for new analytical approach emerged.
The new method of image analysis allows capture and quantification of local variations in cell wall fraction for
each individual sample, furthermore, due to the proposed
approach, certain distribution patterns can be quantified by analysing the structure of the bivariate histograms. Since quantification of the spatial data is not a straightforward task at the present time, development of a new method of spatial image analysis to obtain a map of structure descrip-tors is indispensable for understanding the efficiency of any
technologically important treatments (Cantrea et al., 2014;
Nguyen et al., 2014; Brosnan and Sun, 2004). Quantified
maps of the structure are dependent on the technologi -cal parameters of the treatment and in this way they may provide a feedback for the optimization of the techno-logy. Based on a visual analysis of maps of cell wall frac-tion (Fig. 6) and the relevant bivariate histograms (Figs 7 and 8) it is possible to characterise the effects of different sample treatments.
In comparison to samples submersed in sucrose and water without ultrasonic treatment, the cell wall fraction of US-treated samples was lower on average and showed
less variation in global values. Also, the rate of change with respect to spatial coordinates was lower for these samples. This was indicated by alignment of the data along lines shifted towards lower values of relative cell wall fraction and by lower slopes and lower vertical spread of values of bivariate histograms for samples treated with ultrasounds (Fig. 7b, d and Fig. 8b, d). All samples dehydrated with sucrose showed some spatial dependency on cell wall
frac-tion values. In general, the cell wall fraction increased
with the distance from the sample centre. However, after the ultrasonic treatment the difference in values between points from the edge and the centre of the sample was lower (Fig. 7a, b). Samples treated with ultrasound also showed lower spread of values in vertical direction of the bivariate histogram. This property of histogram can be interpreted as an indicator of directional homogeneity of spatial trend. Values concentrated in narrow ranges shows that spatial
a b
c d
changes occur in all directions in a similar manner. In the case of a sucrose bath immersion without ultrasonic treat-ment spatial changes were much less homogenous, which was indicated by wider spread of histogram values (Fig. 7a, c). Moreover, for 90 min of sample treatment in a sucrose bath without ultrasound assistance it was also possible to quan-tify strong directional trend which is shown on the histo-gram as bimodal distribution, with entries concentrated around two separate average values (Figs 6c and 7c).
The samples submersed in water showed more uniform structure without direct spatial trends, this was indicated by horizontal alignment of histogram values (Fig. 8). Also, all these samples had lower absolute values of cell wall frac-tion than samples dehydrated in sucrose (data not shown) which is perfectly related to differences visible in object areas from microscopic analysis (Fig. 4).
CONCLUSIONS
1. The novel method of image analysis with respect to spatial distribution of measured parameters brought satisfactory quantification of distinct tissue structure modi-fications after various treatments were applied. Results showed that the cell wall fraction of samples exposed to ultrasonic waves was lower in average and showed less variation in global values. Also, the rate of change with respect to spatial coordinates was lower for US-treated sample. This leads to a conclusion that ultrasonic treatment
might have a positive effect on the mass and energy trans -fer, which resulted in more homogenous structure of tissue. 2. The data compaction and a convenient way of pre-senting of the data offer variety of possible applications of presented algorithm. It should be noted, that spatial posi-tion of the pixels expressed as the distance from the sample centre is best suited for characterisation of the samples with regular, convex boundaries (circular, rectangular or polygonal). This limitation does not apply to other spatial descriptors. Also, parameters, other than cell wall fraction can be quantified, depending on the type of sample. The bivariate histograms can be employed to describe the dis-tribution of cells shape parameters for instance.
3. Data representation in a form of normalised biva-riate histograms is suitable for classification and recogni-tion algorithms. Spatial patterns can be associated with desired structural composition and thus indicate the effi-ciency of processing applied to a sample. The method opens the possibility of designing of new structure descrip-tors for understanding the efficiency of any technologically important treatments.
REFERENCES
Barba F.J., Brianceau S., Turk M., Boussetta N., and Vorobiev E., 2015a. Effect of alternative physical treatments (ultra-sounds, pulsed electric fields, and high-voltage electrical discharges) on selective recovery of bio-compounds from fermented grape pomace. Food Bioprocess Technol., 8, 1139-1148.
Barba F.J., Galanakis C.M., Esteve M.J., Frigola A., and Vorobiev E., 2015b. Potential use of pulsed electric tech-nologies and ultrasounds to improve the recovery of high- added value compounds from blackberries. J. Food Eng., 167, 38-44.
Brosnan T. and Sun D.-W., 2004. Improving quality inspection of food products by computer vision – a review. J. Food Eng., 61, 3-16.
Cantrea D., Eastb A., Verboven P., Arayab X.T., Herremansa E., Nicolaïa B.M., Pranamornkithb T., Lohc M., Mowatd A., and Heyesb J., 2014. Microstructural characterisation of commercial kiwifruit cultivars using X-ray micro computed tomography. Postharvest Biol. Technol., 92, 79-86. Cárcel J.A., García-Pérez J.V., Benedito J., Mulet A., 2012.
Food process innovation through new technologies: Use of ultrasound. J. Food Eng., 110, 200-207.
Chiralt A. and Talens P., 2005. Physical and chemical changes induced by osmotic dehydration in plant tissues. J. Food Eng., 67, 167-177.
Garcıa-Perez J.V., Carcel J.A., de la Fuente-Blanco S., and
Riera-Franco de Sarabia E., 2006. Ultrasonic drying of foodstuff in a fluidized bed: Parametric study. Ultrasonics, 44, 539-543.
García-Pérez J.V., Cárcel J.A., Benedito J., and Mulet A., 2007. Power ultrasound mass transfer enhancement in food drying. Trans IChemE, Part C. Food Bioprod. Process, 85(C3), 247-254.
Gerlach D., 1972. Outline of botanical microtechnology (in Polish). PWRiL, Warsaw, Poland.
Harker F.R. and Suthrland P.W., 1993. Physiological changes associated with fruit ripening and the development of mealy texture during storage of nectarines. Postharvest Biol. Technol., 9(4), 269-277.
Ho Q.T., Verboven P., Mebatsion H.K., VerlindenB.E., Vandewalle S., and Nicolaï B.M., 2009. Microscale me- chanisms of gas exchange in fruit tissue. New Phytologist, 182, 163-174.
Ho Q.T., Verboven P., Verlinden B.E. , Herremans E.,Wevers M., Carmeliet J., and Nicolaï B.M., 2011. A three-dimen-sional multiscale model for gas exchange in fruit. Plant Physiol. 155, 1158-1168.
Ho Q.T., Verboven P., Verlinden B.E., and Nicolaï B.M., 2010. A model for gas transport in pear fruit at multiple scales. J. Experimental Bot., 61, 2071-2081.
Kentish S., Ashokkumar M., 2011. The physical and chemical effects of ultrasound. In: Ultrasound Technologies for Food and Bioprocessing (Eds H. G.V. Feng, Barbosa-Canovas, J. Weiss). Springer Press, New York, USA.
Koubaa M., Roselló-Soto E., Šic Žlabur J., Režek Jambrak A., Brnčić M., Grimi N., Boussetta N., and Barba F.J.,
2015. Current and new insights in the sustainable and green recovery of nutritionally valuable compounds from Stevia rebaudiana Bertoni. J. Agric. Food Chem., 63, 6835-6846. Legland D., Devaux M.F., Bouchet B., and Guillon F., 2012. Cartography of cell morphology in tomato pericarp at the fruit scale. J. Microsc., 247(1), 78-93.
Lewicki P.P. and Pawlak-Porzecka R., 2005. Effect of osmotic dewatering on apple tissue structure. J. Food Eng., 66, 43-50.
Mebatsion H.K., Verboven P., Ho Q.T., Verlinden B.E., and Nicolaï B.M., 2008. Modelling fruit (micro)structures why and how? Trends Food Sci. Technol., 19, 59-66.
Mebatsion H.K., Verboven P., Melese Endalew A., Billen J., Ho Q.T., and Nicolai B.M., 2009. A novel method for 3-D microstructure modeling of pome fruit tissue using syn-chrotron radiation tomography images. J. Food Eng., 93, 141-148.
Mendoza F., Pieter V., Mebatsion H.K., Kerckhofs G., Wevers M., and Nicolai B., 2007. Three-dimensional pore space quantification of apple tissue using X-ray computed microtomography. Planta, 226, 559-570.
Mothibe K.J., Zhang M., Nsor-atindana J., and Wang Y.C., 2011. Use of ultrasound pretreatment in drying of fruits: Drying rates, quality attributes, and shelf life extension. Drying Technol., 29, 1611-1621.
Nguyen N.D.T., Rizzolo A., Herremans E., Vanolib M., Cortel- lino G., Erkinbaev C., Tsuta M., Spinelli L., Contini D., Torricelli A., Verboven P., De Baerdemaeker J., Nicolaï B.M., and Saeys W., 2014. Optical properties-microstruc-ture-texture relationships of dried apple slices: Spatially resolved diffuse reflectance spectroscopy as a novel tech-nique for analysis and process control. Innov. Food Sci. Emerg. Technol., 21, 160-168.
Pieczywek P.M. and Zdunek A., 2012. Automatic classification of cells and intercellular spaces of apple tissue. Comput. Electron. Agric., 81, 72-78.
Roselló-Sotoa E., Galanakis C.M., Brnčićc M., Orliend V.,
Trujilloe F.J., Mawson R., Knoerzer K., Tiwarig B.K.,
and Barba F.J., 2015a. Clean recovery of antioxidant com-pounds from plant foods, by-products and algae assisted by ultrasounds processing. Modeling approaches to optimize processing conditions. Trends Food Sci. Technol., 42(2), 134-149.
Rosello-Soto E., Koubaa M., Moubarik A., Lopes R.P., Saraiva J.A., Boussetta N., Grimi N., and Barba F.J., 2015b. Emerging opportunities for the effective valorization of wastes and by-products generated during olive oil produc-tion process: Nonconvenproduc-tional methods for the recovery of high-added value compounds. Trends Food Sci. Technol., 45, 296-310.
Šic Žlabur J., Voća S., Dobričević N., Brnčić M., Dujmić F., and Rimac Brnčić S., 2015. Optimization of ultrasound assisted extraction of functional ingredients from Stevia rebaudiana Bertoni leaves. Int. Agrophys., 29, 231-237. Simal S., Benedito J., Sánchez E.S., and Roselló C., 1998. Use
of ultrasound to increase mass transport rate during osmotic dehydration. J. Food Eng., 36, 323-336.
Wan P.J., Muanda M.W., and Covey J.E., 1992. Ultrasonic vs. nonultrasonic hydrogenation in a batch reactor. J. Am. Oil Chem. Soc., 69, 876-879.
Zinoviadou K.G., Galanakis C.M., Brnčić M., Grimi N.,