THE APPLICATION OF FORMAL CONCEPT ANALYSIS AND THE IMPORTANCE
OF SCALE SELECTION IN THE EVALUATION OF PHYSICAL ACTIVITY DATA
IN RELATION TO THE BODY MASS INDEX
Erik Sigmund, Jiří Zacpal*, Dagmar Sigmundová
Faculty of Physical Culture, Palacký University, Olomouc, Czech Republic * Faculty of Science, Palacký University, Olomouc, Czech Republic
Submitted in May, 2009
BACKGROUND: Research confi rms that physical activity (PA) is irreplaceable in a healthy and physically active lifestyle. One of the key research questions is what the optimal level of everyday PA for health is and how it should be quantifi ed and interpreted. Formal concept analysis is one possible way of how to assess and describe the level of PA as related to personal data.
OBJECTIVE: The main goal of this study was to introduce the method of Formal Concept Analysis (FCA) using data from the ANEWS questionnaire and data from the objective monitoring of a number of steps using the YAMAX SW-701 pedometer. A further aim was to adopt the most appropriate method within the FCA.
METHODS: A random sample of 273 males aged 18–69 from selected regional centers participated in the study. RESULTS: The example of daily steps allows for the demonstration of how important it is to select a scale in FCA data analysis. It is better to use an ordinal scale for the daily number of steps (in our example); because, in so doing, we create the attributes that can be ordered (a lower number of steps is also insuffi cient).
CONCLUSIONS: A rough scale produces easier lattice with the general scope of the observed attributes. The smoothing of the scale produces more diffi cult lattice and makes for more diffi cult analyses, but gives more detailed results. FCA requires more expertise from a researcher than do “classical” testing statistics, but gives us deeper insight into the examination of the problem.
Keywords: Nominal and ordinal scale, fuzzy, aggregated object, lattice, steps, men. INTRODUCTION
Physical activity (hereafter PA) is of key importance to a healthy and physically active lifestyle in adults. Yet the optimal level of its daily amount and the method of its exact quantifi cation have not been clearly identifi ed. A daily number of steps appears to be a simple and comprehensible “quantifi er” (Tudor-Locke, Ainsworth, Thompson, & Matthews, 2002) and pedometers (espe-cially YAMAX brand) are reliable and exact enough to measure the steps (Crouter, Schneider, Karabulut, & Bassett, 2003; Le Masurier, Lee, & Tudor-Locke, 2004; Schneider, Crouter, & Bassett, 2004). The choice of appropriate and verifi ed techniques and variables is a necessary condition that needs to be met in order to describe various phenomenona properly. Moreover, an appropriate method of data processing and interpreta-tion are also important. When only either a quantitative or qualitative approach is used, that has its limits, which can be overcome to some extent by the combination of both quantitative and qualitative methods used, for ex-ample, in PA meta analysis (Sallis & Owen, 1999). The “adjustment” of data to the possibilities of statistical
methods can lead sometimes to a biased interpretation of the tested aspect. For example, the frequent use of regressive analysis in behavioral studies can also con-tribute to data misinterpretation. Therefore, the main aim of this study is to introduce the method of Formal Conceptual Analysis as applied to a data sample from the ANEWS questionnaire and the number of steps ob-tained from the YAMAX pedometer. A further goal of the study is to discuss the choice of an appropriate scale in Formal Conceptual Analysis.
METHODS
Participants
A random sample of 273 males aged 18–69 from selected regional centers participated in the study. The chosen men fully and correctly completed the ANEWS questionnaire and weekly physical activity monitoring using Yamax SW–700 pedometers in Spring and Au-tumn of 2007.
as follows: < 18.5 (underweight), 18.5–24.9 (normal weight), 25–29.9 (overweight) and ≥ 30 (obese) (World Health Organization, 1995).
ANEWS questionnaire
The ANEWS questionnaire, the Neighborhood En-vironment Walkability Scale – Abbreviated (www.ipen-project.org/surveyanews.htm) includes 54 questions on the environment of neighborhoods, which are divided into several categories: D) types of residences in your neighborhood, E) stores, facilities, and other things in your neighborhood, F) access to services, G) streets in my neighborhood, H) places for walking and cycling, I) neighborhood surroundings and J) neighborhood safety. The answers to individual questions in category D) are scored as: 1 – none, 2 – a few, 3 – some, 4 – most, 5 – all. All 23 questions in the E) category can be answered as: 1 – 1–5 min, 2 – 6–10 min, 3 – 11–20 min, 4 – 20–30 min, 5 – ≥ 30 min and the possibility, “I don’t know”. Categories F) to J) are scored as follows: 1 – strongly disagree, 2 – somewhat disagree, 3 – somewhat agree, 4 – strongly agree.
Pedometr Yamax SW-701
The Yamax Digiwalker SW–701 (Yamax Corpora-tion, Japan) is a light (20 g), small commercial elec-tronic pedometer that measures vertical oscillations (Schneider, Crouter, & Bassett, 2004). Yamax uses a spring suspended lever that moves in response to the hip’s vertical oscillations. The movement opens and closes an electrical circuit, and each vertical oscillation detected above a critical threshold (0.35 g) is registered as a step taken (Tudor-Locke et al., 2002). Total num-bers of counted steps are displayed on a small screen.
In general, pedometers are most accurate in count-ing steps, less accurate in calculatcount-ing distance, and least accurate at estimating energy expenditure (Crouter et al., 2003). Because steps are the most direct expression of what the pedometer actually measures, Tudor-Locke and Myers (2001) recommend reporting pedometer data as steps.
Formal Concept Analysis
In area data mining we often have the problem, that we obtain o lot of data and we are looking for a tool, which will allow us to make this data concrete or gener-alize it. Formal Concept Analysis (FCA) is a very good tool for this work (Ganter & Wille, 1999). FCA works with a formal context.
Formal contextis where X is a set of objects, Y is a set of attributes and I is a binary relation-ship between X and Y, xIy or meaning that the object x has the attribute y.
For each defined
(set of all attributes, which have
ob-jects from ). Similarly, for subset define: (set of all objects, which have attributes from B).
Formal concept from the context there is
a pair , where , , and
. Set we call extent,and set the intent of concept .
Therefore, models the natural subconcept–su-perconcept hierarchy. The set of all concepts form the context , which we denote as follows: . It is a concept lattice, the basic structure of which is described by the so called main theorem of concept lattices (Ganter & Wille, 1999).
The questionnaire consists of questions to be an-swered by respondents by selecting an answer from a list of possible answers. From the point of view of FCA, we can consider the set of respondents as the set of objects and the set of single questions as the set of attributes. The questions need not be yes/no questions. Rather, some questions like those concerning age and educa-tion are many valued. Correspondingly, a completed questionnaire can be represented by a many valued formal context. With this type of context FCA doesn’t work. Therefore we have to transform this many valued context to a bivalent context. This process we called concept scaling.
Concept scaling
Scaling is a transformation of a many-valued context to a bivalent context. The basic scales being used in FCA are described in Ganter and Wille’s (1999) book. Some important facts are presented below.
Nominal scales
Nominal scales are used to place attributes on a scale, the values of which mutually exclude each oth-er. One example from ANEWS could be information about our repondents’ way of life: alone, family with-out children or family with children. In this case we use a nominal scale and off er a choice of three attributes: alone, family without children, family with children (TA-BLE 1). If respondent XY fi lls in that he lives alone,
then in context it looks like this: ,
a
.
The dichotomic scale
looks like this: and .
TABLE 1
Example of the creation of a nominal scale in the ques-tion of the lifestyle of a participant (ANEWS quesques-tion- question-naire)
Questionnaire Context (lifestyle)
Participant Answer Alone
Family without children
Family with children
A 1 A 1 0 0
B 2 B 0 1 0
C 3 C 0 0 1
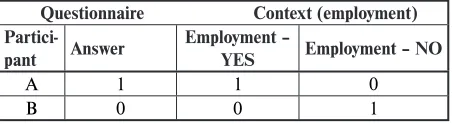
TABLE 2
Example of the creation of a dichotomic scale in the question of work for pay of a participant (ANEWS ques-tionnaire)
Questionnaire Context (employment)
Partici-pant Answer
Employment –
YES Employment – NO
A 1 1 0
B 0 0 1
Ordinal scales
Ordinal scales can be used to place many valued attributes on a scale, the values of which are ordered and where each value implies the weaker ones. We can use the ordinal scale for the number of steps counted by the pedometer. When we use an ordinal scale, we list fi ve possible attributes for steps: low active (sedentary), somewhat active, active, highly active and “extremely” active (TABLE 3).
Aggregated objects
Typically, such a formal context contains many ob-jects and a manageable number of attributes. The
cor-responding concept lattice is too large for an expert to comprehend. In addition, the expert might not be interested in the formal concepts from this concept lattice. Rather, the expert might want to consider ag-gregates of the individual respondents as objects in the formal context with the aggregates defi ned by having the same attributes. This is the main idea of so called “aggregated objects” (Bělohlávek, Sklenář, Zacpal, & Sigmund, 2007).
The basic idea is to choose a set S of attributes specifi ed by an expert, such as gender – male, gender – female, etc., with S being a subset of the set Y of all at-tributes. Attributes from S will be called “characteristic attributes”. By these attributes we aggregate respond-ents (objects). For example, we have the characteristic attributes of gender (gender – male, gender– female), a job (job – yes, job – no) and ownership of a car (car – yes, car – no), then the set of aggregated objects re-places the set of objects – respondents. Each aggregated object represents the group of respondents which has the same characteristic attributes. For example: “a man, who owns a car and has a job” (objects, which are relat-ed to the attributes gender – male, car – yes, job – yes). We replace the binary relation with a fuzzy relation-ship between aggregate objects and attributes, where the true degree expresses what percentage of respondents has this property (relative frequency between original objects and attributes). For example, if we have a true degree between an aggregated object with the charac-teristic attributes of gender – male, job – yes, car – no and attribute dog – yes 0.49, it expresses, that 49% of men, who have a job and don’t have a car, own a dog.
Using the above described transformation, we ob-tain a formal fuzzy context. Instead of the classical set we have fuzzy sets and use fuzzy logic instead of clas-sic logic (Bělohlávek, 2002). Now we have calculated a fuzzy concept lattice. The problem is that this concept lattice is usually very large and contains some concepts, which are not interesting for the expert. Because of that, we use the so called crisply generated fuzzy concept lattice (Bělohlávek, Sklenář, & Zacpal, 2005) for dis-playing the most important information contained in the questionnaire.
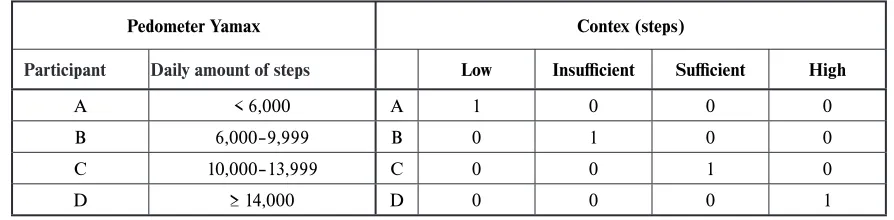
TABLE 3
Example of the creation of an ordinal scale of the variable daily number of steps (Pedometer Yamax)
Pedometer Yamax Context
Participant Daily amount of steps Low active Somewhat active Active Highly active Extremely active
A < 7,000 A 1 1 1 1 1
B 7,000–9,999 B 0 1 1 1 1
C 10,000–12,999 C 0 0 1 1 1
D 13,000–15,999 D 0 0 0 1 1
RESULTS AND DISCUSSION
The eff ect of the selected scale on the fi nal analysis What eff ect will the selected scale have on the fi nal lattice? We attempt to provide the answer to this using an example. We will consider the average number of steps per day. The literature has recommended the value of 10,000 steps per day as the health maintaining mini-mum (Hatano, 1993; Choi, B., Pak, Choi, J., & Choi, E., 2007; Welk et al., 2000; Yamanouchi, Shinozaki, & Chikada, 1995). If we include this recommendation as the basis for our analysis, we will use the nominal scale, which names two attributes: steps – insuffi cient and steps – suffi cient (TABLE 4). This scale can be also understood as a dichotomic scale in the case of an answer to the following question “Does the respondent perform more than 10,000 steps per day?” A dichotomic scale is a special type of nominal scale.
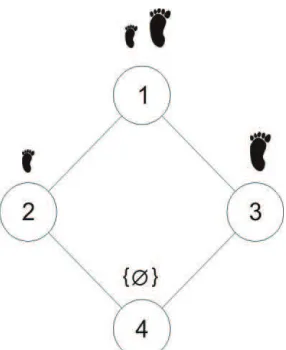
The limited lattice is created when selecting char-acteristic attributes such as gender – male, gender – female, steps – insuffi cient and steps-suffi cient. For the example, we will analyze only the lattice of men (Fig. 1).
For the analysis, it is important to compare the in-tents of the individual concepts. It has been proved that higher PA in adults represented by their daily number of steps is associated with a lower Body Mass Index (BMI) (Dwyer et al., 2006; Payn et al., 2008) and with the feeling of having better health (Payn et al., 2008). The following table shows only some attributes of the intents, including BMI (TABLE 5). In Czech adult men,
there is a lesser occurrence of obesity (4% : 10%). Obes-ity (41% : 45%) in individuals showing a higher number of steps per day (≥ 10,000) in comparison to individuals with a daily number of steps below 10,000 (TABLE 5) is apparent.
TABLE 4
Creation of two attributes for the variable daily number of steps (Pedometer Yamax) – nominal scale
Pedometer Yamax Context (steps)
Participant Daily amount of steps Insuffi ci-ent Suffi cient
A < 10,000 A 1 0
B ≥ 10,000 B 0 1
The division of steps into two parts only (< 10,000 and ≥ 10,000) is, however, from a mathematical and also a kinanthropological point of view very rough (Choi, B., Pak, Choi, J., & Choi, E., 2007; Tudor-Locke & My-ers, 2001). Tudor-Locke and Myers (2001) argue that meeting the requirement of 10,000 steps a day is, for many healthy people, not possible. A metaanalysis of the results of 32 studies using pedometers to monitor their daily PA shows that in 8–10 year old children the daily number of steps can be between 12,000–16,000 (less in girls than in boys), in young healthy adults it is 7,000–13,000 steps (less in women than in men). The daily number of steps in healthy older adults is 6,000– 8,500 and 3,500–5,500 in people with handicaps or the chronically ill. On the basis of the long-term monitoring of PA using pedometers in adults, Tudor-Locke, Hatano, Pangrazi and Kang (2008) have classifi ed lifestyle in adults according to the number of their steps as follows:
! < 5,000 steps/day = sedentary, ! 5,000–7,499 steps/day = low active, ! 7,500–9,999 steps/day = somewhat active, ! ≥ 10,000 steps/day = active,
! ≥ 12,500 steps/day = highly active.
On the basis of this information, we would like to “smoothen” the variable of the daily number of steps into four attributes using the nominal scale of steps – low, steps – insuffi cient, steps – suffi cient and steps – high (TABLE 6).
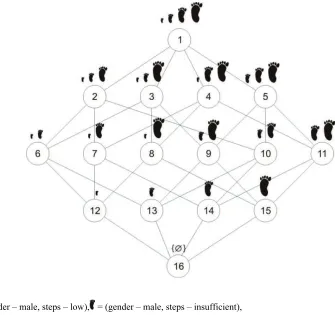
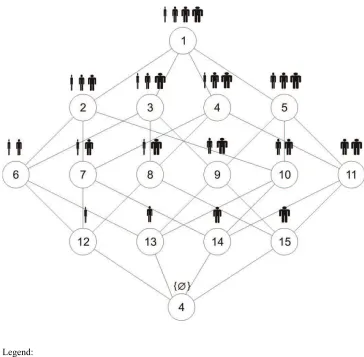
We will again examine a limited lattice which ap-pears when we choose the characteristic attributes of gender – male, gender – female, steps – low, steps – insuffi cient, steps – suffi cient and steps – high. We will consider only the sub cluster that concerns men (Fig. 2).
If we analyze the lattice using the two attributes of steps (steps – insuffi cient, steps – suffi cient), we will identify basic diff erences between these two groups. We
will do that by comparing the concepts { } and { }. Fig. 1
Sub lattice of males for two attributes to the variable daily number of steps (Pedometer Yamax)
Legend:
TABLE 5
Concepts with the attributes of age (years) and Body Mass Index (BMI – kg·m-2) for the variable daily number of steps – nominal two attributes scale
Concepts
Age (years) (classifi ed according to BMI)Level of body weight
15
–2
4 y
ea
rs
2–
34
y
ea
rs
35–44 y
ears
45
–5
4 y
ea
rs
55
–6
5 y
ea
rs
underweight (< 18.5)
normal weight
(18.5–24.9) overweight (25–29.9) obesity (≥ 30)
{ , } 0.18 0.34 0.22 0.17 0.07 0.03 0.42 0.41 0.04
{ } 0.18 0.40 0.22 0.17 0.13 0.04 0.42 0.45 0.10
{ } 0.25 0.34 0.15 0.18 0.07 0.03 0.52 0.41 0.04
TABLE 6
Creation of four attributes for the variable daily number of steps (Pedometer Yamax) – nominal scale
Pedometer Yamax Contex (steps)
Participant Daily amount of steps Low Insuffi cient Suffi cient High
A < 6,000 A 1 0 0 0
B 6,000–9,999 B 0 1 0 0
C 10,000–13,999 C 0 0 1 0
D ≥ 14,000 D 0 0 0 1
For example, in attributes that concern BMI, no sig-nifi cant diff erences are apparent. The same procedure can be applied to the lattice which we obtained by us-ing four attributes of steps (steps – low, steps – insuffi -cient, steps – suffi cient and steps – high). We will obtain similar results by comparing the concepts of { , ,} and
{ , }. If we examine the lattice and attempt a more de-tailed examination, we will identify more apparent diff er-ences between BMI in individual groups of respondents with diff erent attributes of steps by comparing the
con-cepts of { }, { }, { }, { }. The following table shows these concepts with selected attributes (TABLE 7).
Generally, we can argue that the rougher the scale is, the lesser the lattice we obtain, and thus the analysis will be simpler. On the other hand, by using a “smoother” scale, we will obtain a more detailed analysis, however we will work with a lattice which is more diffi cult. The most effi cient procedure seems to be the monitoring of changes in the selected attributes by the gradual smoothening of the original “rough” scale. The smoothening needs to stop when the aggregated
attributes consist of too few respondents (10–15). In a lower number of respondents, analysis is not effi cient.
The eff ect of the selected scale on the fi nal analysis In the case of variables where more scales can be applied, the choice of the appropriate scale needs to be considered. For example, we consider the number of steps per day in a respondent. We can choose either the nominal or the ordinal scale. We use the nominal scale from the previous chapter (TABLE 6). The ordinal scale is described in the following table (TABLE 8).
Note: The example does not show a typical ordinal scale, but a special type of such a scale called biordinal. This type of scale describes contradictory concepts. In this case they are insuffi cient and suffi cient daily amount of steps.
Legend:
= (gender – male, steps – low), = (gender – male, steps – insufficient),
= (gender – male, steps – sufficient), = (gender – male, steps – high) Fig. 2
Sublattice of males for four attributes to the variable daily number of steps (Pedometer Yamax)
The degrees of the truth level of attributes will be diff erent due to the diff erent scales applied. The com-parison of these attributes is shown in the following table (TABLE 9).
The comparison of the degrees of the truth level created using nominal and ordinal scales shows the dif-ferent values of attributes of steps – insuffi cient and steps – suffi cient. The diff erence is caused by the fact that in ordinal scales, the attribute of steps insuffi cient involves also the attribute of steps-low and on the other hand the attribute of steps – suffi cient involves also at-tribute steps – high. In an ordinal scale we thus obtain a total percentage of all respondents who show either a suffi cient or an insuffi cient number of steps. When analyzing the entire lattice, this seems to be more effi -cient since we obtain a comprehensive view of these two groups which we can further describe more in detail by assessing groups with a “more extreme” number of steps (steps – low, steps – high). We can therefore conclude that using the ordinal scale in such a case is more ef-fi cient. However, in some situations using the nominal scale is more effi cient, for example, in situations when we are interested in particular intervals.
CONCLUSIONS
We have shown some examples of using diff erent scales and their eff ects on the results while applying Formal Conceptual Analysis. We can conclude that only due to an appropriate choice of “smoothness” and the scale, can we obtain precise results. The expert’s experi-ence and expertise in the fi eld of physical activity plays an essential role. Yet, choosing the correct scale and the smoothness of the scale, especially in highly vari-able varivari-ables such as a daily number of steps is also important.
TABLE 7
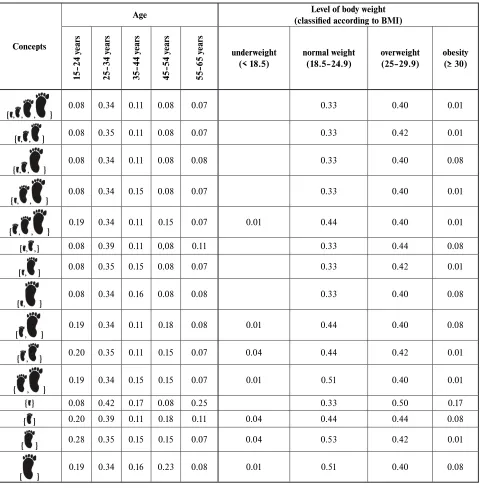
Concepts with the attributes of age (years) and Body Mass Index (BMI – kg·m–2) for the variable daily number of steps – nominal four attributes scale
Concepts
Age (classifi ed according to BMI)Level of body weight
15
–2
4 y
ea
rs
25
–3
4 y
ea
rs
35–44 y
ears
45
–5
4 y
ea
rs
55
–6
5 y
ea
rs
underweight (< 18.5)
normal weight (18.5–24.9)
overweight (25–29.9)
obesity (≥ 30)
{ , , , } 0.08 0.34 0.11 0.08 0.07 0.33 0.40 0.01
{ , , } 0.08 0.35 0.11 0.08 0.07 0.33 0.42 0.01
{ , , } 0.08 0.34 0.11 0.08 0.08 0.33 0.40 0.08
{ , , } 0.08 0.34 0.15 0.08 0.07 0.33 0.40 0.01
{ , , }
0.19 0.34 0.11 0.15 0.07 0.01 0.44 0.40 0.01
{ , ,} 0.08 0.39 0.11 0,08 0.11 0.33 0.44 0.08
{ , } 0.08 0.35 0.15 0.08 0.07 0.33 0.42 0.01
{ , } 0.08 0.34 0.16 0.08 0.08 0.33 0.40 0.08
{ , } 0.19 0.34 0.11 0.18 0.08 0.01 0.44 0.40 0.08
{ , } 0.20 0.35 0.11 0.15 0.07 0.04 0.44 0.42 0.01
{ , } 0.19 0.34 0.15 0.15 0.07 0.01 0.51 0.40 0.01
{ } 0.08 0.42 0.17 0.08 0.25 0.33 0.50 0.17
{ } 0.20 0.39 0.11 0.18 0.11 0.04 0.44 0.44 0.08
{ } 0.28 0.35 0.15 0.15 0.07 0.04 0.53 0.42 0.01
{ } 0.19 0.34 0.16 0.23 0.08 0.01 0.51 0.40 0.08
TABLE 8
Creation of four attributes for the variable daily number of steps (Pedometer Yamax) – ordinal scale
Pedometer Yamax Contex (steps)
Participant Daily amount of steps Low Insuffi cient Suffi cient High
A < 6,000 A 1 1 0 0
B 6,000–9,999 B 0 1 0 0
C 10,000–13,999 C 0 0 1 0
Legend:
= (gender – male, BMI – underweight), = (gende – male, BMI – normal weight),
= (gender – male, BMI – overweight), = (gender – male, BMI – obesity) Fig. 3
Sublattice of males for nominal and bi-ordinal scale
ACKNOWLEDGMENT
The study has been supported by the res e a rch grant from the Ministry of Education, Youth and Sports of the Czech Republic (No. MSM 6198959221) “Physical Activity and Inactivity of the Inhabitants of the Czech Republic in the Context of Behavioral Changes”.
REFERENCES
Bělohlávek, R. (2002). Fuzzy relationa l systems: Founda-tions and principles. New York: Kluwer Academic/ Plenum Publisher.
Bělohlávek, R., Sklenář, V., & Zacpal, J. (2005). Crisply generated fuzzy concepts. In B. Ganter & R. Godin (Eds.), ICFCA 2005 (pp. 268–283). Berlín: Springer-Verlag.
Bělohlávek, R., Sklenář, V., Zacpal, J., & Sigmund, E. (2007). Evaluation of questionnaires supported by formal concept analysis. In P. W. Eklund, J. Diatta, & M. Liquiere (Eds)., CLA 2007 Fifth International Conference on Concept Lattices and Their Applications (pp. 96–107). France: Montpellier.
Crouter, S. E., Schneider, P. L., Karabulut, M., & Bas-sett, D. R. Jr. (2003). Validity of 10 electronic pedo-meters for measuring steps, distance, and energy cost. Med. Sci. Sports. Exerc.,35, 1455–1460. Dwyer, T., Hosmer, D., Hosmer, T., Venn, A. J.,
Bliz-zard, C. L., Granger, R. H., Cochrane, J. A., Blair, S. N., Shaw, J. E., Zimmet, P. Z., & Dunstan, D. (2006). The inverse relationship between number of steps per day and obesity in a population based sam-ple – the AusDiab study. In. J. Obes.,31, 797–804. Ganter, B., & Wille, R. (1999). Formal concept analysis.
Hatano, Y. (1993). Use of the pedometer for promoting daily walking exercise. Int. Counc. Healt. Phys. Educ. Rec., 29, 4–28.
Choi, B. C. K., Pak, A. W. P., Choi, J. C. L., & Choi, E. C. L. (2007). Daily step goal of 10,000 steps: A literature review. Clin. Invest. Med.,30, 146–151. Le Masurier, G. C., Lee, S. M., & Tudor-Locke, C.
(2004). Motion sensor accuracy under controlled and free living conditions. Med. Sci. Sports. Exerc., 36, 905–910.
Payn, T., Pfeiff er, K. A., Hutto, B., Vena, J. E., Lamonte, M. J., Blair, S. N., & Hooker, S. P. (2008). Daily steps in midlife and older adults: Relationship with demographic, self rated health, and self reported physical activity. Res. Q. Exerc. Sport., 79, 128–132.
Radvanský, M., & Sklenář, V. (2007). Lattice naviga-tor – program pro analýzu dat pomocí formální kon-ceptuální analýzy [Computer software]. Olomouc: Přírodovědecká fakulta, Katedra informatiky. Sallis, J. F., & Owen, N. (1999). Physical activity &
be-havioral medicine. Thousand Oaks: Sage.
Schneider, P. L., Crouter, S. E., & Bassett, D. R. Jr. (2004). Pedometer measures of free living physical activity: Comparison of 13 models. Med. Sci. Sports. Exerc.,36, 331–335.
Tudor-Locke, C. E., Ainsworth, B. E., Thompson, R. W., & Matthews, C. E. (2002). Comparison of pedo meter and accelerometer measures of free liv-ing physical activity. Med. Sci. Sports. Exerc., 34, 2045–2051.
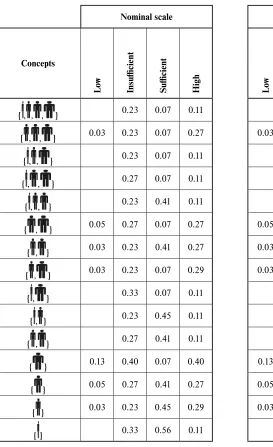
TABLE 9
Comparison of the degrees of the truth level of attributes created using nominal and ordinal scales
Nominal scale Ordinal scale
Concepts
Lo
w
Insuffi
c
ie
nt
Suffi
c
ie
nt
High Lo
w
Insuffi
c
ie
nt
Suffi
c
ie
nt
High
{ , , , } 0.23 0.07 0.11 0.26 0.47 0.11
{ , , } 0.03 0.23 0.07 0.27 0.03 0.26 0.47 0.27
{ , , } 0.23 0.07 0.11 0.26 0.47 0.11
{ , , } 0.27 0.07 0.11 0.32 0.47 0.11
{ , , } 0.23 0.41 0.11 0.26 0.67 0.11
{ , } 0.05 0.27 0.07 0.27 0.05 0.32 0.47 0.27
{ , } 0.03 0.23 0.41 0.27 0.03 0.26 0.68 0.27
{ , } 0.03 0.23 0.07 0.29 0.03 0.26 0.68 0.27
{ , } 0.33 0.07 0.11 0.33 0.47 0.11
{ , } 0.23 0.45 0.11 0.26 0.67 0.11
{ , } 0.27 0.41 0.11 0.32 0.67 0.11
{ } 0.13 0.40 0.07 0.40 0.13 0.53 0.47 0.40
{ } 0.05 0.27 0.41 0.27 0.05 0.32 0.68 0.27
{ } 0.03 0.23 0.45 0.29 0.03 0.26 0.74 0.29
Tudor-Locke, C., Hatano, Y., Pangrazi, R. P., & Kang, M. (2008). Revisiting “How many steps are enough?”. Med. Sci. Sports. Exerc.,40(7, Suppl.), 537–543. Tudor-Locke, C., & Myers, A. M. (2001).
Methodologi-cal considerations for researchers and practitioners using pedometers to measure physical (ambulatory) activity. Res. Q. Exerc. Sport., 72, 1–12.
Welk, G., Diff erding, J., Thompson, R., Blair, S., Dziura, J., & Hart, P. (2000). The utility of the Digi-Walker step counter to assess daily physical activity patterns. Med. Sci. Sports. Exerc.,32(9, Suppl.), 481–488. World Health Organization. (1995). Physical status: The
use and interpretation of anthropometry – WHO Tech-nical Report Series. Geneva: Switzerland.
Yamanouchi, K., Shinozaki, K., & Chikada, K. (1995). Daily walking combined with diet therapy is a useful means for obese NIDDM patients not only to reduce body weight but also to improve insulin sensitivity. Diab. Care,18, 775–778.
www.ipenproject.org/surveyanews.htm – International Physical Activity & the Environment Network web-site
APLIKACE FORMÁLNÍ KONCEPTUÁLNÍ ANALÝZY A DŮLEŽITOST VÝBĚRU ŠKÁLY PŘI HODNOCENÍ DAT O POHYBOVÉ AKTIVITĚ
VE VZTAHU K BODY MASS INDEXU (Souhrn anglického textu)
VÝCHODISKA: Nenahraditelnost pohybové aktivity (PA) ke zdravému a pohybově aktivnímu životnímu stylu je široce akceptována a zdůrazňována. Stále se však hle-dá zdravotně optimální míra její každodenní realizace a způsob její přesné kvantifi kace a srozumitelné pretace. Možným prostředkem k vyhodnocování a inter-pretaci úrovně prováděné PA a jejího vztahu k osobním datům je Formální konceptuální analýza (FCA).
CÍLE: Hlavním cílem této studie je představit meto-du Formální konceptuální analýzy na vyhodnocení kon-krétního příkladu dat z ANEWS dotazníku a denního počtu kroků z pedometru Yamax. Dílčím cílem je pak poukázat na správný výběr škály při jejím používání.
METODIKA: Metoda FCA je představena na datech z ANEWS dotazníku a denního počtu kroků z pedomet-ru Yamax SW-701 u randomizovaného soubopedomet-ru 18–69le-tých mužů (n = 273) z České republiky.
VÝSLEDKY: Při použití různých druhů škály (no-minální nebo ordinální) zjišťujeme odlišné skupinové výsledky. V případě denního počtu kroků je vhodnější zvolit ordinální škálu, neboť vytváříme atributy, které lze seřazovat (např. nižší počet kroků je současně počet nedostatečný).
ZÁVĚRY: Volba hrubší škály vede k jednoduššímu svazu s možností komplexnějšího pohledu na sledované
atributy. Naproti tomu postupné zjemňování škály vede ke složitějším svazům a tedy náročnější analýze, získá-váme však podrobnější výsledky. Formální konceptuální analýza klade vyšší nároky na odbornost uživatele (vý-zkumníka) než „klasická“ testovací statistika, umožňuje však plastičtější vhled do zkoumané problematiky.
Klíčová slova: nominální a ordinální škála, fuzzy, agrego-vaný objekt, svaz, kroky, muži.
Mgr. Erik Sigmund, Ph.D.
Palacký University Faculty of Physical Culture tř. Míru 115
771 11 Olomouc Czech Republic
Education and previous work experience
Erik Sigmund is a research worker of Center for Ki-nanthropology Research at Faculty of Physical Culture in Palacký University, Olomouc.
He graduated in Mathematics and Physical Educa-tion high school teacher from Palacký University (Czech Republic) and obtained his Mgr. in 1997. In the fi eld of Kianthropology he obtained Ph.D. in Department of Kinanthropology from Palacký University (Czech Republic).
E. Sigmund’s scientifi c interests are in the fi elds of human movement, environment for physical activity, physical activity programmes for children, data anal-ysis and formal concept analanal-ysis. Dr. Sigmund was a main investigator and coinvestigator of university and state grants in these fi elds. He published 1 monographs (“Physical activity of children and their integration us-ing sixty movement games”, Hanex) and over 90 pa-pers in conference proceedings and journals including Medicine and Science in Sports and Exercise, European Journal of Public Health, Journal of Human Kinetics, Exercise of Society Journal of Sport Science, Human Kinetics, Kinesiologia Slovenica, Svensk Indrottsforskn-ing. Erik Sigmund is a member of ACSM and EUPHA.
First-line publications
Sigmund, E., Croix, D. S. M., Miklánková, L., & Frömel, K. (2007). Physical activity patterns of kindergar-ten children in comparison to teenagers and young adults. European Journal of Public Health, 17(6), 646–651.
and boys aged 10–14 from Moravia region. Human Kinetics, 13(1), 95–105.
Sigmund, E., Frömel, K., Klimtová, H., & Tomik, R. (2000). Structure and level of physical in children aged 11–12 divided according to the body weight. Acta Universitatis Palackianae Olomucensis. Gymnica, 30(1), 25–31.
Sigmund, E., Frömel, K., & Neuls, F. (2005). Physical activity of children and youth: Evaluation guidelines from the viewpoint of health support. Acta Universita-tis Palackianae Olomucensis. Gymnica, 35(2), 59–68. Sigmund, E., Frömel, K., Neuls, F., Skalik, K., & Grof-fi k, D. (2002). Inactivity in life style of adolescent girls classifi ed according to the level of their body weight. Acta Universitatis Palackianae Olomucensis. Gymnica, 32(1), 17–25.
Sigmund, E., Frömel, K., & Sallis, J. F. (2007). The re-liability of the long and short IPAQ forms in Czech youth aged 15–24y [Abstract]. Medicine and Science in Sports and Exercise, 39(Suppl. 5), 191.
Sigmund, E., Frömel, K., Sigmundová, D., & Sallis, J. F. (2006). Age and gender patterns of physical ac-tivity: The contributions of physical education and organized physical activity. Kinesiologia Slovenica, 12(1), 63–74.
Sigmund, E., Másilka, D., Sigmundová, D., Frömel, K., & Novák, M. (2005). The eff ect of interventional physical activity of residential camps in nature on the habitual physical activity of females and males. Acta Universitatis Palackianae Olomucensis. Gymnica, 35(1), 43–51.
Sigmund, E., Mitáš, J., Sigmundová, D., Frömel, K., Ho-rák, S., Zacpal, J., Nykodým, J., Šebrle, Z., Řepka, P., Feltlová, D., Suchomel, A., Mičan, O., Klobouk, T., Lukavská, M., & Bláha, L. (2008). The use of formal concept analysis in evaluation of the relationship be-tween the environment and physical activity of the residents in Czech regional cities. Acta Universitatis Palackianae Olomucensis. Gymnica, 38(2), 65–74. Sigmund, E., Sigmundová, D., & El Ansari, W. (2009).
Changes in physical activity in preschoolers and fi rst grade children: Longitudinal study in the Czech Re-public. Child: Care, Health & Development, 35(3), 376–382.
Sigmund, E., Vašendová, J., Neuls, F., Frömel, K., & Skalik, K. (2000). Correlates of physical activity in 11–12 years old children. Acta Universitatis Palacki-anae Olomucensis. Gymnica, 30(2), 51–58.
Sigmund, E., Zacpal, J., Sigmundová, D., Mitáš, J., Sklenář, V., Bělohlávek, R., & Frömel, K. (2007). Vyhodnocení IPAQ dotazníků pomocí Formální konceptuální analýzy. Studia Kinanthropologica, 8(1), 7–16.