
R E S E A R C H
Open Access
DNA methylation in a Scottish family
multiply affected by bipolar disorder and
major depressive disorder
Rosie May Walker
1, Andrea Nikie Christoforou
1, Daniel L. McCartney
1, Stewart W. Morris
1, Nicholas A. Kennedy
1,
Peter Morten
1, Susan Maguire Anderson
1, Helen Scott Torrance
1, Alix Macdonald
2, Jessika Elizabeth Sussmann
2,
Heather Clare Whalley
2, Douglas H. R. Blackwood
2, Andrew Mark McIntosh
2,3, David John Porteous
1,3and Kathryn Louise Evans
1,3*Abstract
Background:Bipolar disorder (BD) is a severe, familial psychiatric condition. Progress in understanding the aetiology of BD has been hampered by substantial phenotypic and genetic heterogeneity. We sought to mitigate these confounders by studying a multi-generational family multiply affected by BD and major depressive disorder (MDD), who carry an illness-linked haplotype on chromosome 4p. Within a family, aetiological heterogeneity is likely to be reduced, thus conferring greater power to detect illness-related changes. As accumulating evidence suggests that altered DNA methylation confers risk for BD and MDD, we compared genome-wide methylation between (i) affected carriers of the linked haplotype (ALH) and married-in controls (MIs), (ii) well unaffected haplotype carriers (ULH) and MI, (iii) ALH and ULH and (iv) all haplotype carriers (LH) and MI.
Results:Nominally significant differences in DNA methylation were observed in all comparisons, with differences withstanding correction for multiple testing when the ALH or LH group was compared to the MIs. In both comparisons, we observed increased methylation at a locus inFANCI, which was accompanied by increased FANCI expression in the ALH group.FANCIis part of the Fanconi anaemia complementation (FANC) gene family, which are mutated in Fanconi anaemia and participate in DNA repair. Interestingly, severalFANCgenes have been implicated in psychiatric disorders. Regional analyses of methylation differences identified loci implicated in psychiatric illness by genome-wide association studies, includingCACNB2and the major histocompatibility complex. Gene ontology analysis revealed enrichment for methylation differences in neurologically relevant genes.
Conclusions:Our results highlight altered DNA methylation as a potential mechanism by which the linked haplotype might confer risk for mood disorders. Differences in the phenotypic outcome of haplotype carriers might, in part, arise from additional changes in DNA methylation that converge on neurologically important pathways. Further work is required to investigate the underlying mechanisms and functional consequences of the observed differences in methylation.
Keywords:Bipolar disorder, Major depressive disorder, DNA methylation, 450K array, FANCI, Gene ontology analysis, Family study
* Correspondence:[email protected]
1Medical Genetics Section, Centre for Genomic and Experimental Medicine,
Institute of Genetics and Molecular Medicine, The University of Edinburgh, Western General Hospital, Crewe Road, Edinburgh EH4 2XU, UK
3Centre for Cognitive Ageing and Cognitive Epidemiology, The University of
Edinburgh, 7 George Square, Edinburgh EH8 9JZ, UK
Full list of author information is available at the end of the article
Background
Bipolar disorder (BD) is severe psychiatric condition characterised by recurrent episodes of depression and mania. BD is highly heritable (h2= 0.85 [1]), and in re-cent years, progress has been made in identifying risk-associated variants through genome-wide association studies (GWASs) (reviewed in [2]). These risk variants are, however, of small effect and together only partially explain BD’s heritability [3, 4].
Many of the associated variants for BD fall within non-coding regions of the genome [5], implicating per-turbed regulatory processes in the pathogenesis of this condition. Consistent with this observation, gene expres-sion studies have identified several changes in individ-uals with BD [6, 7].
Some of these expression changes might be attribut-able to altered DNA methylation, which has been ob-served in individuals with BD, for example [8–12]. DNA methylation levels at many sites are, at least in part, under genetic control [13], indicating one potential mechanism by which regulatory variants might confer risk for BD. In addition, comparison of monozygotic twins who are discordant for BD, or the related psy-chiatric illness schizophrenia, has revealed several loci showing significant differences in DNA methylation [14]. These differences might reflect the actions of environ-mental risk factors, which are believed to contribute to the imperfect concordance for BD observed in monozy-gotic twins.
To date, case-control studies of DNA methylation in BD have been limited either by a restricted focus on can-didate genes [8–10, 12] or the study of a small group of unrelated individuals [15, 16]. Here, we capitalise on the increase in homogeneity conferred by the study of re-lated individuals by assessing blood-based DNA methy-lation in a large Scottish family multiply affected by BD and major depressive disorder (MDD). Increased aetio-logical homogeneity within this family may confer greater statistical power to detect phenotypically relevant differences in DNA methylation. Previous analyses of this family have identified a ~20 Mb haplotype on chromosome 4p15-16, which shows linkage to BD and MDD (henceforth referred to as the linked haplotype (LH)) [17, 18] (maximum LOD score = 4.41). Ongoing analysis of the family, which now includes additional individuals, suggests that the LH acts in conjunction with genome-wide polygenic risk to confer risk for BD (Clarke et al., manuscript in preparation).
Here, we assessed the hypothesis that the LH confers risk via an effect on DNA methylation and identified four loci showing differences in methylation in carriers of the LH that withstood correction for multiple testing. Furthermore, as some carriers of the LH do not develop BD or MDD, we attempted to identify differences in
DNA methylation that represent additional risk and/or protective loci that act in concert with the linked haplo-type to determine an individual’s phenotype. In this comparison, no individual locus remained significant after correction for multiple testing; however, collect-ively, the most differentially methylated loci were found to map to genes involved in neurologically relevant func-tions. Together, these analyses aimed to assess the contribution of genetically and environmentally driven changes in DNA methylation to the development of BD and MDD.
Results
Overview of research strategy
Genome-wide DNA methylation was measured in mem-bers of a large family multiply affected by BD and MDD, using the Infinium HumanMethylation450 BeadChip. Three groups of individuals were considered: affected (diagnosed with either BD or MDD) carriers of the linked haplotype (ALH; n= 10; (BD n= 5; MDDn= 5)); unaffected carriers of the linked haplotype (ULH;n= 10) and unaffected, non-haplotype-carrying married-in con-trols (MIs; n= 9). A series of comparisons was per-formed: ALH vs. MI, ULH vs. MI, ALH vs. ULH and LH (combined ALH and ULH) vs. MI. These comparisons permitted us to assess our hypotheses that (i) the linked haplotype confers an increase in risk for major affective disorders via an effect on DNA methylation and (ii) DNA methylation at certain loci correlates with the presence/absence of illness in haplotype carriers, reflect-ing the involvement of additional risk/protective loci. To gain an insight into the potential consequences of differ-ential methylation, gene ontology analysis was carried out to identify biological processes and functions over-represented amongst the most significantly differentially methylated loci.
Quality control and data filtering
of >0.05. At the end of this filtering process, the dataset comprised 435,889 probes measured in nine ALHs (BD
n= 5; MDDn= 4), ten ULHs and eight MIs (Additional file 1: Table S1).
Selection of normalisation method
Twelve normalisation methods available in the R pack-age wateRmelon [20] were ranked according to their ability to reduce noise attributable to technical error (Additional file 1: Table S2). Daten 2 was identified as the optimum normalisation method.
Assessment of between-group differences in cell composition
Due to the presence of cell type-specific DNA methyla-tion patterns, individual differences in blood cellular composition can confound the assessment of methyla-tion. As such, between-group differences in estimated cellular proportions were assessed. No significant differ-ences were observed (p≥0.276).
Surrogate variable analysis
To reduce the potentially confounding effects of unmeas-ured and/or unmodelled variables, surrogate variables (SVs) were estimated [21]. This resulted in the identifica-tion of six significant SVs, which were fitted as covariates in the differentially methylated position (DMP) analysis.
Identification of DMPs
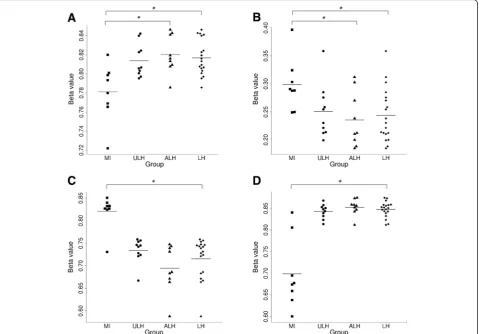
Linear regression analysis was performed to assess DNA methylation at the 435,889 probes retained after data filtering. This analysis revealed four loci to be signifi-cantly differentially methylated following multiple testing correction (false discovery rate (FDR)-adjusted p≤0.1) when comparing the LH group with the MI group (Table 1; Additional file 1: Table S3; Fig. 1). These loci map to the following: an intron inFANCI, 147 bp down-stream of NBEAL2, the shared promoter region of
GCOM1 and MYZAP and an intronic region of AHRR. Two of these loci,FANCIandNBEAL2, were also found to be significantly differentially methylated when com-paring the ALH group with the MI group (Table 2; Additional file 1: Table S4; Fig. 1). Comparison of (i) the
ULH group with the MI group and (ii) the ALH group with the ULH group did not yield any significant results following multiple testing correction (Additional file 1: Tables S5 and S6).
Assessment of FANCI expression
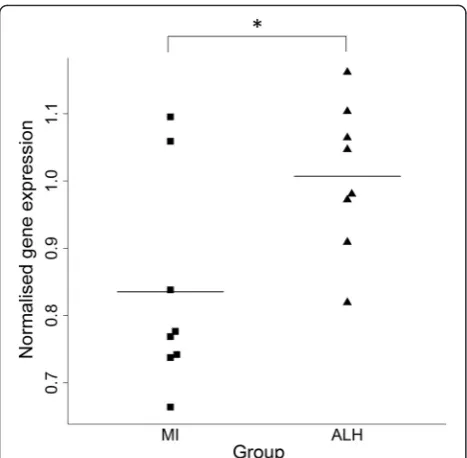
As a preliminary step in investigating the consequences of the increase in methylation at a site withinFANCI ob-served in the LH and ALH groups (when compared with the MI group), we assessed FANCI expression. Expres-sion was measured in lymphoblastoid cell lines (LCLs) obtained from the same individuals who were assessed for DNA methylation. Three individuals (two ALH and one MI) were excluded as they were deemed to be out-lier samples.FANCIexpression was, therefore, compared between eight ALH, ten ULH and eight MIC individuals (Additional file 1: Table S1). A significant increase in
FANCIexpression was observed in the ALH group when compared to the MI group using a linear regression model that covaried for gender (p= 0.0423, fold change = 1.21; Fig. 2). A non-significant increase in expression was ob-served when comparing the LH and MI groups (p= 0.206, fold change =1.13).
Identification of DMRs
Correlation between DNA methylation at neighbouring probes on the 450 K array permits methylation changes to be considered at a regional level [22]. This approach reduces the impact of any individual poor-performing probes, rendering the results more robust. For each comparison (ALH vs. MI, ULH vs. MI, ALH vs. ULH and LH vs. MI), nominally significant probes (p≤0.05) from the DMP analyses were assessed for differentially methylated regions (DMRs). Details of the number of probes entered into the analyses and the number of DMRs identified for each comparison are presented in Table 3. The results from these analyses are presented in their entirety in Additional file 1: Tables S7–S10.
DMRs were compared with regions previously impli-cated in the pathogenesis of BD, MDD or schizophrenia through GWAS. A literature search identified five studies reporting genome-wide significant associations for BD [3, 23–26] and one study reporting genome-wide
Table 1Differentially methylated positions identified when comparing the LH group with the MI group
Probe ID Chr. Coordinatea Gene βdifferenceb pvalue Adjustedpvaluec
cg12858231 15 89846095 FANCI 0.0356 2.54 × 10⁻⁷ 0.0560
cg09354556 3 47051341 NBEAL2d
−0.0551 2.99 × 10⁻⁷ 0.0560
cg22708112 15 57883393 GCOM1/MYZAP −0.105 3.85 × 10⁻⁷ 0.0560
cg12251573 5 421644 AHRR 0.149 6.58 × 10⁻⁷ 0.0717
a
hg19/GRCh37
b
LHβmean-MIβmean
c
Benjamini-Hochberg false discovery rate-adjustedpvalue
d
significant associations for MDD [27]. Genome-wide sig-nificant associations for schizophrenia were identified from three studies [28–30]. Four DMRs overlapping with regions previously implicated in schizophrenia were identified [28–30]. These regions map to CACNB2(LH vs. MI p= 1.84 × 10⁻⁴), the extended MHC (ULH vs. MI
p= 1.37 × 10⁻⁴),C11orf87(ALH vs. ULHp= 5.32 × 10⁻⁵) and an intergenic region between CYP2D7 and TCF20 (LH vs. MIp= 1.49 × 10⁻⁵; ULH vs. MIp= 1.85 × 10⁻⁵). These regions of overlap are detailed in Table 4.
Three DMRs are particularly notable for their signifi-cance and the involvement of a large number of probes.
These are a 829-bp hypomethylated region (spanning 29 probes) located at the developmentally important
HOXA5 locus, observed in the ALH, ULH and LH groups when compared with the MI group (ALH vs. MI p= 3.65 × 10−62; ULH vs. MI p= 5.85 × 10−61; LH vs. MIp= 1.62 × 10−77); a 847-bp hypermethylated region (spanning either 22 (LH) or 24 (ALH) probes) located to-wards the 5′end ofRNF39, observed in the ALH and LH groups when compared with the MI group (ALH vs. MI p= 3.45 × 10⁻³²; LH vs. MI p= 2.11 × 10⁻²⁹) and a 1461-bp hypomethylated region (spanning 22 probes) encompassing the promoter regions and the first exons of
Fig. 1Bee swarm plots showing DNA methylation levels (βvalues) for the four loci identified as being differentially methylated in the LH vs. MI comparison (aFANCI,bNBEAL2,cGCOM1/MYZAP,dAHRR). Methylation values are shown for the married-in control (MI), affected carriers of the linked haplotype (ALH), unaffected carriers of the linked haplotype (ULH) and all linked haplotype carriers (LH) groups. *FDR-adjustedp≤0.1
Table 2Differentially methylated positions identified when comparing the ALH group with the MI group
Probe ID Chr. Coordinatea Gene βdifferenceb pvalue Adjustedpvaluec
cg09354556 3 47051341 NBEAL2d
−0.0633 1.93 × 10⁻⁷ 0.0711
cg12858231 15 89846095 FANCI 0.0390 3.26 × 10⁻⁷ 0.0711
a
hg19
b
ALHβmean-MIβmean
c
Benjamini-Hochberg false discovery rate-adjustedpvalue
d
AGPAT1 and RNF5, observed in the ALH group com-pared to the ULH group (p= 1.19 × 10⁻²⁰).
Gene ontology analysis
In order to ascertain whether genes involved in particu-lar biological processes, molecuparticu-lar functions or celluparticu-lar components were overrepresented amongst the most differentially methylated loci; gene ontology (GO) ana-lysis was performed for each of the four comparisons, ALH vs. MI, ULH vs. MI, ALH vs. ULH and LH vs. MI. This resulted in the identification of several GO cate-gories showing FDR-significant enrichment (q≤0.1; Additional file 1: Table S11–S21). Considering those GO categories that are classified as pertaining to “biological processes”, a theme common to all four comparisons was development. Within this broad theme, GO cate-gories relating to the development of the nervous system
(e.g. “regulation of nervous system development” (ALH vs. MI q= 1.99 × 10⁻⁴; LH vs. MI q= 5.36 × 10⁻²),
“neuron projection guidance”(ULH vs. MIq= 1.17 × 10⁻²; ALH vs. ULHq= 1.40 × 10⁻³) and“nervous system devel-opment”(ALH vs. ULHq= 3.30 × 10⁻⁴)) ranked highly for all four comparisons. Continuing the theme of enrichment for neurologically relevant GO categories, both the ALH vs. MI and LH vs. MI comparisons revealed a significant enrichment for genes belonging to the “molecular func-tion” GO category “voltage-gated ion channel activity” (ALH vs. MIq= 1.19 × 10⁻²; LH vs. MICq= 6.00 × 10⁻²). Of those GO categories considered to relate to “cellular components”, the LH vs. MI comparison yielded several results relating to neurons and synapses, with the category
“neuron part” attaining a q value of 7.72 × 10⁻². Interest-ingly, in light of the important role believed to be played by calcium signalling in psychiatric illness [31], a significant enrichment for “calcium ion binding” was found when comparing the ALH and ULH groups (q= 1.23 × 10⁻⁴).
Discussion
Several members of a large Scottish family carry a 20 Mb haplotype on chromosome 4p that confers risk for BD and MDD [17, 18]. Here, we sought to further our understanding of the mechanisms mediating the adverse effects of the LH by studying DNA methylation, an epi-genetic mark found to be altered in individuals with psy-chiatric disorders (e.g. [14, 32–34]). Moreover, as some carriers of the linked haplotype remain well, we aimed to identify changes in DNA methylation that might reflect the involvement of additional risk/protective loci. To the best of our knowledge, this represents the first family-based genome-wide study of DNA methylation in the major affective disorders, BD and MDD. By studying re-lated individuals who share a known genetic susceptibility locus, our study took advantage of the increase in statistical power conferred by the reduced genetic and aetiological heterogeneity expected in a single family com-pared with larger case-control studies.
Analysis of carriers of the LH resulted in the identifi-cation of four significantly differentially methylated loci, when compared with a group of MI. These loci map to an intron inFANCI, theGCOM1andMYZAPpromoter region, an intron in AHRR, and 147 bp 3′ of NBEAL2. The methylation differences at two of these loci,FANCI and NBEAL2, were also significant when considering only those carriers of the LH who had been diagnosed with either MDD or BD. Although none of these loci showed significant differential methylation when com-paring the ALH and ULH groups, it is interesting to note that the mean level of methylation in the ULH group falls between those of the ALH and MI groups for all four loci. This might suggest that possession of the linked haplotype results in a change in methylation that
Fig. 2Bee swarm plot showing normalised gene expression values forFANCIin the married-in control (MI) and affected carriers of the linked haplotype (ALH) groups.FANCIexpression was measured in lymphoblastoid cell lines using qRT-PCR and was normalised to the geometric mean ofATP5B,RPLP0andUBC. *p≤0.05
Table 3Summary of differentially methylated region (DMR) analyses
Comparison No. of probes included
in DMR analysisa No. of DMRsdetected
ALH vs. MI 23,205 150
ULH vs. MI 20,599 120
ALH vs. ULH 16,755 49
LH vs. MI 23,433 156
a
is further modified by additional susceptibility/protective factors.
Increased whole bloodFANCImethylation was accom-panied by increased expression in LCLs from affected carriers of the linked haplotype, further supporting the notion that altered FANCIfunction might contribute to the pathogenic effects of the LH. It is important to note that we were unable to measure methylation and ex-pression in the same tissue. This is a limitation of the present study that precludes us from drawing any defini-tive conclusions regarding the relationship between al-tered methylation and expression. Future studies should aim to characterise the relationship betweenFANCI ex-pression and methylation in this family.
FANCI is a member of the Fanconi anaemia comple-mentation (FANC) gene family. Mutations in these genes can cause Fanconi anaemia, a rare genome instability syndrome. Members of the FANC family act together in the Fanconi anaemia pathway to repair DNA damage. Phosphorylation of FANCI has been shown to act as a trigger for this process [35], and siRNA-induced deple-tion of FANCI has been shown to induce a higher base-line rate of DNA damage and reduced capacity to mend double strand breaks [36].
Genetic variation in members of the Fanconi anaemia pathway has been implicated in neurodevelopmental phenotypes and psychiatric illness. FANCD2/FANCI-as-sociated nuclease 1 (FAN1) is a repair nuclease that is recruited to sites of interstrand crosslinks by interacting with a FANCD2-FANCI complex. The FAN1 gene is located at 15q13.3, a region affected by multiple micro-deletions that predispose to a number of clinical pheno-types, including schizophrenia [37, 38], autism spectrum disorder (ASD), attention deficit hyperactivity disorder, epilepsy and intellectual disability [39]. An exome sequencing study identified a cluster of rare non-synonymous variants located within a 20-kb window that spans several functional domains of FAN1, which were associated with schizophrenia with depressive features, schizoaffective disorder and ASD [40]. More recently, a large-scale GWAS found a genome-wide significant asso-ciation between theFANCLlocus and schizophrenia [28].
GCOM1 forms part of the GRINL1A complex scription unit, which comprises three groups of tran-scripts [41]. GCOM1, which is a read-through transcript ofMYZAPandPOLR2M, shows similarity in amino acid sequence to the NR1 N-methyl-D-aspartate (NMDA) subunit-interactor Yotiao [42] and the amino termini of the NR2 and NR3 NMDA subunits [41]. Evidence for an interaction between GCOM1 and NR1 has been identi-fied in the rat brain, where GCOM1 facilitates NMDA receptor activity [43]. The known roles of NMDA recep-tors in neurodevelopment, neuroplasticity and excitotoxi-city [44], together with the evidence implicating altered NMDA function in psychiatric illness [45, 46] render GCOM1 a strong functional candidate. Interestingly, a three nucleotide deletion within GRINL1A has been de-tected in an exome sequencing study of sporadic ASD [47]. We detect decreased methylation at a site that falls within a DNase hypersensitive site (DHS) in theGCOM1/
MYZAPpromoter region [48]. DHSs are indicative of an open chromatin structure, which makes DNA accessible to binding by transcription factors. Characterisation of the genomic locations of GWAS-significant variants has revealed that 76.6 % of associated non-coding SNPs are located within DHSs or are in complete linkage disequilib-rium with a SNP located in a DHS [5]. This suggests that the observed change in methylation might confer an effect on GCOM1 and MYZAP expression; however, further work is required to assess this possibility and to assess any effects on NMDA receptor activity.
Consideration of our data at a regional level revealed a hypermethylated region located within an intronic re-gion of multiple CACNB2isoforms and overlapping the promoter region of a singleCACNB2isoform in the LH group. Variation at the CACNB2 locus has been found to increase risk for schizophrenia [28] and for the five psychiatric disorders, schizophrenia, BD, MDD, ASD and attention deficit hyperactivity disorder, included in a recent cross-disorder GWAS [49]. The hypermethylated region overlaps with a DHS and several chromatin im-munoprecipitation (ChIP)-identified transcription factor binding sites [48]. Taken together, it is possible that the observed increase in methylation might exert an effect
Table 4Overlap between DMRs and regions implicated in schizophrenia by a recent large-scale GWAS [28]
PGC SCZ regiona DMR coordinatesa DMR gene(s) DMR comparison DMRpvalue DMR directionb Chr10:18681005-18770105 Chr10:18688985-18689948 CACNB2 LH vs. MI 1.84 × 10⁻⁴ Up
Chr22: 42548710-42548874 Chr22: 42548710-42548874 – LH vs. MI 1.49 × 10⁻⁵ Up ULH vs. MI 1.85 × 10⁻⁵ Up Chr11: 109285471-109610071 Chr11: 109294141-109294239 C11orf87 ALH vs. ULH 5.32 × 10⁻⁵ Up Chr6: 28303247-28712247 Chr6: 28555640-28559522 Extended MHC ULH vs. MI 1.37 × 10⁻⁴ Down
a
hg19/GRCh37
b
on the expression of the short CACNB2 isoform; how-ever, this would need to be assessed experimentally.
Comparison of the affected and unaffected carriers of the linked haplotype identified a region of hypomethyla-tion upstream ofHTR2A. This gene encodes the 5-HT2A receptor, a target of both atypical antipsychotics [50] and selective serotonin reuptake inhibitors [51]. Moreover, variation in HTR2A has been associated with risk for MDD by candidate gene studies (reviewed in [52]) and a meta-analysis [53]. Another DMR of interest falls within an intronic region of the mitotic spindle-assembly check-point gene MAD1L1, adjacent to a region previously associated with risk for schizophrenia and BD [28, 54].
MAD1L1 has been shown to be a target of another schizophrenia-susceptibility gene, miR-137 [55]. A DMR identified in the comparison of these two groups worth noting for its potential functional relevance affectsNPAS4. We observed reduced methylation in the ALH group in a region spanning the final exon ofNPAS4. NPAS4encodes a brain-specific transcription factor, which is involved in regulating the formation of inhibitory synapses [56]. Stress, a well-established risk factor for psychiatric illness [57], has been shown to modulateNPAS4methylation in mice [58].
In order to investigate the biological systems poten-tially impacted by the observed methylation changes, GO analysis was performed. It is interesting to note the presence of enrichment for GO categories pertaining to neurodevelopment and neuronal function in all four comparisons. This finding is particularly pertinent in light of the fact that it was necessary to assess DNA methylation differences relevant to the pathogenesis of BD and MDD in a non-neuronal tissue. Our findings in-dicate that it may be possible to detect methylation dif-ferences relevant to nervous system function in the blood, despite the existence of between-tissue differences in DNA methylation [59, 60].
When performing GO analysis of methylation array data, a singlepvalue must be selected to represent each gene. We decided to select the most significantpvalue for any locus within a gene as a methylation change at an in-dividual locus has the potential to confer an effect on gene function. As such, genes that contain more CpG sites are more likely to have their function altered by a change in methylation and are, therefore, more likely to obtain a more significantp value. A confounding factor, however, is that genes that are targeted by more probes also have a greater likelihood of obtaining a more significant pvalue by chance due to multiple testing. The conflation of these two factors presents an analytical challenge as correcting for multiple testing risks reducing true biological signal. This is a limitation of currently available methods for GO analysis of methylation data, which must be considered when interpreting our findings.
As each blood cell type has a distinct methylation pro-file, it was important to assess the existence of system-atic between-group variation in cell type distribution, which could confound the detection of methylation dif-ferences [61, 62]. We did not observe any between-group differences in estimated cell type proportions, suggesting that variation in cell type distribution would be unlikely to exert a large effect on the differences ob-served in our sample. Moreover, by performing surro-gate variables analysis (SVA), we were able to fit a set of SVs in our analyses that controlled for all unmodelled sources of variation, including cell type distribution [21]. Together, the set of SVs produced by SVA efficiently represent the effects of all unmeasured or unmodelled confounding variables on DNA methylation whilst pro-tecting the primary variable of interest. As such, SVA minimises the number of covariates that must be in-cluded, thus helping to avoid model overfitting prob-lems. With regards to modelling the effects of cell type distribution, SVA confers the advantage of negating the need to decide which cell types to include.
Another factor that should be considered when inter-preting our findings is that affected carriers of the linked haplotype were ill and taking medication prior to their blood sample being obtained for methylation analysis. As drug treatments for MDD and/or BD have previously been shown to alter DNA methylation [63–67], it is pos-sible that DNA methylation in this group was affected by medication. To the best of our knowledge, however, methylation at the sites found to be differentially expressed in the current study has not been shown to be affected by relevant drug treatments [63, 66, 67]. More-over, the fact that the mean methylation level in the ULH group falls between the means of the MI and ALH groups for the four significant LH vs. MI loci argues against medication being a primary driver of our results.
Conclusions
We have found evidence for altered blood DNA methy-lation in carriers of a haplotype linked to BD and MDD. Many affected genes have neuronal roles, participating in neurodevelopment and ion channel activity. Our observation that significant single locus methylation differences are found in haplotype carriers regardless of affectation status is consistent with our previous finding of reduced cognitive function in haplotype carriers but no difference in cognitive function between affected and unaffected carriers of the haplotype [68]. Nevertheless, through gene ontology analysis, we did find evidence that differences in DNA methylation between affected and unaffected haplotype carriers converge on neuro-logically relevant functions. Taken together, our findings suggest a scenario whereby the presence of the linked haplotype confers multiple effects on DNA methylation, which are in turn modified by additional genetic and/or environmental influences that fine-tune an individual’s risk of developing a mood disorder.
Methods
This study was approved by the Multicentre Research Ethics Committee for Scotland, and appropriate in-formed consent was obtained from the human subjects.
Sample
The individuals included in this study were selected from a previously described large Scottish family multi-ply affected by BD or MDD [17, 18]. A ~20 Mb haplo-type located on chromosome 4p has previously been found to segregate with illness in this family with a max-imum LOD score of 4.41 [18]. Carriers of the haplotype were grouped according to illness-status, resulting in two groups: affected (either BD or MDD) carrier of the disease-linked haplotype (ALH) and unaffected carrier of the disease-linked haplotype (ULH). An additional group of well married-in controls (MI) who do not carry the disease-linked haplotype was included for comparison. In total, ten ALH, ten ULH and nine MI individuals were assessed.
Extraction of blood DNA
Blood (9 ml) was collected in an EDTA tube. DNA was extracted at the Wellcome Trust Clinical Research Facility at the University of Edinburgh, using the Nucleon BACC2 Genomic DNA Extraction Kit (Thermo Fisher Scientific, Loughborough, UK), following the manufac-turer’s instructions.
Genome-wide methylation profiling
Whole blood genomic DNA (500 ng) was treated with sodium bisulphite using the EZ-96 DNA Methylation Kit (Zymo Research, Irvine, California), following the
manufacturer’s instructions. DNA methylation was assessed using the Infinium HumanMethylation450 BeadChip (Illumina Inc, San Diego, California), according to the manufacturer’s protocol. Samples were assigned to chips such that, as far as possible, group (ALH, ULH or MI) and gender were counter-balanced across chips.
The resultant raw intensity (.idat) files were read into R using theminfipackage [69], which was used to perform initial quality control assessments. Subsequently, filtering of poor-performing samples and sites was performed. Samples were removed from the dataset if: (i) they failed any of the quality control assessments carried out inminfi or (ii)≥1 % sites had a detectionpvalue of >0.05. Probes were removed from the dataset if: (i) they were located within two base pairs of SNP with a minor allele frequency of ≥5 %; (ii) they were predicted to cross-hybridise [19] and (iii) they had more than five samples with a bead count of less than three or (iv)≥1 % samples had a detec-tionpvalue of >0.05.
The data was normalised using the Daten 2 method, selected using the R packagewateRmelon[20]. Daten 2 in-volves adjusting the background difference between type I and type II assays (by adding the offset between type I and II probe intensities to type I intensities). A linear model is incorporated at this stage to eliminate positional effects. Between-array quantile normalisation is then performed for the methylated and unmethylated signal intensities separately (type I and type II assays normalised together).
Prior to downstream analyses, M-values, defined as M-value = log2((M+ 100)/(U+ 100)), where M repre-sents the methylated signal intensity andUrepresents the unmethylated signal intensity, were calculated for the nor-malised data. For ease of interpretation, the data were converted to β-values (β-value = 2M/(2M+ 1)) prior to presentation.
Assessment of between-group differences in the whole blood cellular composition
In order to assess between-group differences in the cel-lular composition of whole blood samples, estimated cell counts for B-lymphocytes, granulocytes, monocytes, natural killer cells, CD4+ T-lymphocytes and CD8+ T-lymphocytes were generated using the estimate CellCounts function in minfi. This function imple-ments Jaffe and Irizarry’s [62] modified version of Houseman’s [61] algorithm. Between-group differences in cell composition were assessed using Student’s t tests. A p value of ≤0.05 was deemed to represent a significant between-group difference.
Identification of significant surrogate variables
A complicating factor is that many sources of variation are unknown or unmeasured. Moreover, even when po-tential sources of variation are measured, it can be un-clear how best to model these potential confounding variables [21]. Surrogate variable analysis (SVA) identi-fies a set of significant SVs that together represent vari-ation in DNA methylvari-ation that is not attributable to the primary variable of interest. These SVs are then fitted as covariates in the linear models implemented to identify DMPs. Covarying for the identified SVs controls for sources of unmeasured/unmodelled variation (e.g. age, genetic relatedness, smoking status, cell composition), which might otherwise confound the relationship be-tween DNA methylation and the independent variable of interest [21, 70]. A key advantage of SVA is that it per-mits complex relationships between confounders and DNA methylation, for example, interactions between multiple confounding variables. SVA was carried out using the“be”method with the R package SVA [71].
Identification of differentially methylated positions
DMPs were then identified using the R package limma [72] by fitting linear models with the outcome variable
“M-value” and the predictor variables “group” (ALH, ULH or MI) and“gender”, together with the significant SVs identified by SVA. The following comparisons were carried out as follows: (i) ALH and MI, (ii) ULH and MI, (iii) ALH and ULH and (iv) a combined linked haplotype carrier group (ALH and ULH; henceforth referred to as LH) and MI. Correction for multiple testing was imple-mented using the Benjamini-Hochberg false discovery rate (FDR), with adjustedpvalues of≤0.1 deemed to be significant.
Identification of differentially methylated regions
Differentially methylated regions (DMRs) were identified using a modified version of the champ.lasso function im-plemented in the R package ChAMP [73]. DMRs were defined as regions containing three or more adjacent probes within a defined lasso region showing unidirec-tional changes in methylation that attained nominal sig-nificance (unadjustedp≤0.05) in the DMP analysis. The lasso region was set to 2 kb and was scaled according to the local genomic/epigenomic landscape in order to ac-count for uneven probe spacing across the genome [73]. DMRs were merged with neighbouring DMRs where they were separated by less than 1 kb, using the
“minDmrSep” parameter in the champ.lasso function.
P values were estimated for each DMR as described by Butcher et al. [73]. Briefly, Stouffer’s method was used to combine individual probep values, which were weighted by the underlying correlation structure of the M-values. P values from correlated probes were down-weighted whilst p values from uncorrelated probes were
up-weighted. DMRs with p values meeting a Benjamini-Hochberg FDR-corrected threshold of ≤0.05 were in-cluded in the final DMR lists.
Comparison of DMRs with GWAS results
DMRs were assessed for overlap with regions previously im-plicated in BD, MDD and the related condition, schizophre-nia, by GWAS. A literature search was carried out using PubMed (on 7 October 2015) to identify case-control GWAS studies and GWAS meta-analyses involving individ-uals with either BD, MDD or schizophrenia. Only GWAS results attaining genome-wide significance (p≤5 × 10⁻⁸) were considered. Significantly associated genes/regions from the GWAS studies were defined as per the original study. Overlap was defined as either complete or partial overlap between the DMR and a GWAS associated gene/region.
Lymphoblastoid cell line culture and extraction of RNA
Human Epstein-Barr virus (EBV)-transformed LCLs were derived from blood lymphocytes obtained from family members at the European Collection of Cell Cultures (http://www.phe-culturecollections.org.uk/col-lections/ecacc.aspx). LCLs were maintained in Roswell Park Memorial Institute medium with 10 % foetal bovine serum at 37 °C and 5 % CO2.
Total RNA was extracted using the RNeasy Mini Kit (Qiagen, Manchester, UK), according to the manufac-turer’s instructions. An on-column DNase digest step was performed using the RNase-Free DNase Set (Qiagen, Manchester, UK), according to the manufacturer’s instruc-tions. RNA quantity and quality were assessed using the Agilent Bioanalyzer at the WTCRF. The Agilent Bioanalyzer reports RNA integrity numbers (RINs), which indicate how intact an RNA sample is (1 = completely degraded, 10 = completely intact). Sample RINs ranged from 8.6 to 10, indicating that the RNA was suitable for use in qRT-PCR [74].
qRT-PCR assessment of Fanconi anaemia, complementation group I (FANCI) expression
RNA (1μg) was reverse transcribed using the Transcriptor First Strand cDNA Synthesis Kit (Roche) using random hexamer primers, according to the manufacturer’s instructions.
cDNA samples were diluted by a factor of 1/100.
95 °C, followed by 1 min at 60 °C for 40 cycles.FANCI expression was normalised to the geometric mean of the expression levels of three reference genes, ATP5B,
RPLP0andUBC, which were selected from an initial set of seven using geNorm [75]. Assay details are described in Additional file 1: Table S22. Each sample was measured in technical triplicates and the mean of this trip-licate used in downstream analyses. Outlier samples, defined as data points falling outside of the range defined by median ± 1.5 × inter-quartile range were excluded.
Differences inFANCIexpression were assessed by lin-ear regression, covarying for gender. Ap value of≤0.05 was deemed to be significant.
Gene ontology analysis
Gene symbols representing all genes targeted by reliably detected probes (n= 17,686 genes) were ranked accord-ing to the probe p value calculated when identifying DMPs (where an individual gene was targeted by mul-tiple probes, the best p value was retained for GO analysis) and ranked-list GO analysis performed using GOrilla [76, 77]. GOrilla performs a hypergeometric test to assign apvalue to each GO category and then calculates the Benjamini-Hochberg FDR to reflect the number of GO categories assessed. GO categories with aqvalue≤0.1 were considered statistically significant.
Additional file
Additional file 1:Table S1.Sample demographic information for the individuals included in this study.Table S2. Comparison of 12 normalisation methods.Table S3. Probes attaining an uncorrectedp-value of≤0.05 in the comparison of individuals carrying the linked haplotype (LH) and married in controls (MI), ranked byp-value.Table S4. Probes attaining an uncorrectedp-value of≤0.05 in the comparison of affected individuals carrying the linked haplotype (ALH) and married in controls (MI), ranked byp-value.Table S5. Probes attaining an uncorrectedp-value of ≤0.05 in the comparison of unaffected individuals carrying the linked haplotype (ULH) and married in controls (MI), ranked byp-value.Table S6. Probes attaining an uncorrectedp-value of≤0.05 in the comparison of affected individuals carrying the linked haplotype (ALH) and unaffected carriers of the linked haplotype (ULH), ranked byp-value.Table S7. Differentially methylated regions (DMRs) identified in affected carriers of the linked haplotye(ALH) compared to married in controls (MI), ranked by
p-value.Table S8. Differentially methylated regions (DMRs) identified in carriers of the linked haplotye (LH) compared to married in controls (MI), ranked byp-value.Table S9. Differentially methylated regions (DMRs) identified in unaffected carriers of the linked haplotye (ULH) compared to married in controls (MI), ranked byp-value.Table S10. Differentially methylated regions (DMRs) identified in affected carriers of the linked haplotye (ALH) compared to unaffected carriers of the linked haplotype (ULH), ranked byp-value.Table S11. Significantly enriched molecular process gene ontology (GO) categories identified in the ALH vs. MI comparison.Table S12. Significantly enriched biological function gene ontology (GO) categories identified in the ALH vs. MI comparison.Table S13. Significantly enriched cellular component gene ontology (GO) categories identified in the ALH vs. MI comparison.Table S14. Significantly enriched molecular process gene ontology (GO) categories identified in the ULH vs. MI comparison.Table S15. Significantly enriched biological function gene ontology (GO) categories identified in the ULH vs. MI comparison.
Table S16. Significantly enriched cellular component gene ontology (GO)
categories identified in the ULH vs. MI comparison.Table S17. Significantly enriched molecular process gene ontology (GO) categories identified in the ALH vs. ULH comparison.Table S18. Significantly enriched biological function gene ontology (GO) categories identified in the ALH vs. ULH comparison.Table S19. Significantly enriched molecular process gene ontology (GO) categories identified in the LH vs. MI comparison.Table S20. Significantly enriched biological function gene ontology (GO) categories identified in the LH vs. MI comparison.Table S21. Significantly enriched cellular component gene ontology (GO) categories identified in the LH vs. MI comparison.Table S22. Details of the qRT-PCR assays used to measure the seven reference genes assessed for the stability of their expression using geNorm [75]. XLSX 8646 kb)
Abbreviations
ALH:affected carrier of the linked haplotype; ASD: autism spectrum disorder; BD: bipolar disorder; DHS: DNase hypersensitive site; DMP: differentially methylated position; DMR: differentially methylated region; FDR: false discovery rate; GO: gene ontology; GWAS: genome-wide association study; LCL: lymphoblastoid cell line; LH: all carriers of the linked haplotype; MDD: major depressive disorder; MI: married in control; NMDA: N-methyl-D-aspartate; qPCR: quantitative polymerase chain reaction; RIN: RNA integrity number; SV: surrogate variable; SVA: surrogate variables analysis; ULH: unaffected carrier of the linked haplotype.
Competing interests
AMM and HCW have received research funding from Pfizer. AMM, KLE and DJP have received research funding from Lilly and Janssen. AMM has additionally received funding from SACCADE Diagnostics. None of this funding contributed to work carried out in the present study. No other authors report any potential conflicts of interest.
Authors’contributions
RMW carried out the quality control and analysis of the data, interpreted the results and drafted the manuscript; ANC participated in the methylation array data analysis; DLMcC participated in the assessment ofFANCIexpression; SWM participated in the methylation array data analysis; NAK participated in the methylation array data analysis; PM participated in the assessment ofFANCI expression; SMA participated in the assessment ofFANCIexpression; HST participated in the assessment ofFANCIexpression; AM participated in the recruitment and diagnostic assessment of participants; JES participated in the recruitment and diagnostic assessment of participants; HCW participated in the recruitment and diagnostic assessment of participants; DHRB participated in the recruitment and diagnostic assessment of participants; AMM participated in the recruitment and diagnostic assessment of participants; DJP designed the study; KLE designed the study and participated in the interpretation of the results and drafting of the manuscript; all authors contributed to the writing of the manuscript and read and approved the final version.
Acknowledgements
KLE acknowledges the support of the Brain & Behavior Research Foundation through a NARSAD Independent Investigator Award. AMM acknowledges the support of the Health Foundation through a Clinician Scientist Fellowship, a NARSAD Independent Investigator Award from the Brain & Behavior Research Foundation and Wellcome Trust Strategic Support (104036/Z/14/Z). AMM and KLE would also like to acknowledge the support of funding from the NC3Rs, which has permitted re-contact of the family. This study was funded, in part, by an NIH R01 MH102068-1 award (to DJP, KLE and AMM) and a Mental Health Research UK studentship to DLMcC. The research leading to these results has received funding from the European Community’s Seventh Framework Programme (FP7/2007-2013) under Grant No. 602450 through the Imaging Genetics for Mental Disorders (IMAGEMEND). JES was supported by a Clinical Research Fellowship from the Wellcome Trust (087727/Z/08/Z). HCW would like to acknowledge the support of a Royal Society Dorothy Hodgkin Fellowship (DH080018) and a JMAS SIM Fellowship from the Royal College of Physicians of Edinburgh. NAK was funded by a Wellcome Trust Research Training Fellowship (Grant No. 097943).
Author details
1Medical Genetics Section, Centre for Genomic and Experimental Medicine,
Institute of Genetics and Molecular Medicine, The University of Edinburgh, Western General Hospital, Crewe Road, Edinburgh EH4 2XU, UK.2Division of Psychiatry, The University of Edinburgh, Royal Edinburgh Hospital, Edinburgh, UK.3Centre for Cognitive Ageing and Cognitive Epidemiology, The University
of Edinburgh, 7 George Square, Edinburgh EH8 9JZ, UK.
Received: 29 October 2015 Accepted: 11 January 2016
References
1. McGuffin P, Rijsdijk F, Andrew M, Sham P, Katz R, Cardno A. The heritability of bipolar affective disorder and the genetic relationship to unipolar depression. Arch Gen Psychiatry. 2003;60(5):497–502. doi:10.1001/archpsyc.60.5.497. 2. Shinozaki G, Potash JB. New developments in the genetics of bipolar disorder.
Curr Psychiatry Rep. 2014;16(11):493. doi:10.1007/s11920-014-0493-5. 3. Muhleisen TW, Leber M, Schulze TG, Strohmaier J, Degenhardt F, Treutlein J,
et al. Genome-wide association study reveals two new risk loci for bipolar disorder. Nat Commun. 2014;5:3339. doi:10.1038/ncomms4339. 4. Visscher PM, Goddard ME, Derks EM, Wray NR. Evidence-based psychiatric
genetics, AKA the false dichotomy between common and rare variant hypotheses. Mol Psychiatry. 2012;17(5):474–85. doi:10.1038/mp.2011.65. 5. Maurano MT, Humbert R, Rynes E, Thurman RE, Haugen E, Wang H, et al.
Systematic localization of common disease-associated variation in regulatory DNA. Science. 2012;337(6099):1190–5. doi:10.1126/science.1222794. 6. Seifuddin F, Pirooznia M, Judy JT, Goes FS, Potash JB, Zandi PP. Systematic
review of genome-wide gene expression studies of bipolar disorder. BMC Psychiatry. 2013;13:213. doi:10.1186/1471-244X-13-213. 7. Beech RD, Lowthert L, Leffert JJ, Mason PN, Taylor MM, Umlauf S, et al.
Increased peripheral blood expression of electron transport chain genes in bipolar depression. Bipolar Disord. 2010;12(8):813–24. doi:10.1111/ j.1399-5618.2010.00882.x.
8. Kaminsky Z, Jones I, Verma R, Saleh L, Trivedi H, Guintivano J, et al. DNA methylation and expression of KCNQ3 in bipolar disorder. Bipolar Disord. 2014. doi:10.1111/bdi.12230.
9. Strauss JS, Khare T, De Luca V, Jeremian R, Kennedy JL, Vincent JB, et al. Quantitative leukocyte BDNF promoter methylation analysis in bipolar disorder. Int J Bipolar Disord. 2013;1:28. doi:10.1186/2194-7511-1-28. 10. Ruzicka WB, Subburaju S, Benes FM. Circuit- and diagnosis-specific DNA
methylation changes at gamma-aminobutyric acid-related genes in postmortem human hippocampus in schizophrenia and bipolar disorder. JAMA psychiatry. 2015;72(6):541–51. doi:10.1001/jamapsychiatry.2015.49. 11. Rao JS, Keleshian VL, Klein S, Rapoport SI. Epigenetic modifications in frontal
cortex from Alzheimer’s disease and bipolar disorder patients. Translational psychiatry. 2012;2:e132. doi:10.1038/tp.2012.55.
12. Kaminsky Z, Tochigi M, Jia P, Pal M, Mill J, Kwan A, et al. A multi-tissue analysis identifies HLA complex group 9 gene methylation differences in bipolar disorder. Mol Psychiatry. 2012;17(7):728–40. doi:10.1038/mp.2011.64. 13. Lemire M, Zaidi SH, Ban M, Ge B, Aissi D, Germain M, et al. Long-range
epigenetic regulation is conferred by genetic variation located at thousands of independent loci. Nat Commun. 2015;6:6326. doi:10.1038/ncomms7326. 14. Dempster EL, Pidsley R, Schalkwyk LC, Owens S, Georgiades A, Kane F, et al.
Disease-associated epigenetic changes in monozygotic twins discordant for schizophrenia and bipolar disorder. Hum Mol Genet. 2011;20(24):4786–96. doi:10.1093/hmg/ddr416.
15. Li Y, Camarillo C, Xu J, Arana TB, Xiao Y, Zhao Z, et al. Genome-wide methylome analyses reveal novel epigenetic regulation patterns in schizophrenia and bipolar disorder. BioMed research international. 2015;2015:201587. doi:10.1155/2015/201587.
16. Xiao Y, Camarillo C, Ping Y, Arana TB, Zhao H, Thompson PM, et al. The DNA methylome and transcriptome of different brain regions in schizophrenia and bipolar disorder. PLoS One. 2014;9(4):e95875. doi:10.1371/journal.pone.0095875.
17. Blackwood DH, He L, Morris SW, McLean A, Whitton C, Thomson M, et al. A locus for bipolar affective disorder on chromosome 4p. Nat Genet. 1996;12(4):427–30. doi:10.1038/ng0496-427.
18. Le Hellard S, Lee AJ, Underwood S, Thomson PA, Morris SW, Torrance HS, et al. Haplotype analysis and a novel allele-sharing method refines a chromosome 4p locus linked to bipolar affective disorder. Biol Psychiatry. 2007;61(6):797–805. doi:10.1016/j.biopsych.2006.06.029.
19. Chen YA, Lemire M, Choufani S, Butcher DT, Grafodatskaya D, Zanke BW, et al. Discovery of cross-reactive probes and polymorphic CpGs in the Illumina Infinium HumanMethylation450 microarray. Epigenetics. 2013;8(2):203–9. doi:10.4161/epi.23470.
20. Pidsley R, Y Wong CC, Volta M, Lunnon K, Mill J, Schalkwyk LC. A data-driven approach to preprocessing Illumina 450K methylation array data. BMC Genomics. 2013;14:293. doi:10.1186/1471-2164-14-293.
21. Leek JT, Storey JD. Capturing heterogeneity in gene expression studies by surrogate variable analysis. PLoS Genet. 2007;3(9):1724–35. doi:10.1371/ journal.pgen.0030161.
22. Ong ML, Holbrook JD. Novel region discovery method for Infinium 450K DNA methylation data reveals changes associated with aging in muscle and neuronal pathways. Aging Cell. 2014;13(1):142–55. doi:10.1111/acel.12159. 23. Baum AE, Akula N, Cabanero M, Cardona I, Corona W, Klemens B, et al. A genome-wide association study implicates diacylglycerol kinase eta (DGKH) and several other genes in the etiology of bipolar disorder. Mol Psychiatry. 2008;13(2):197–207. doi:10.1038/sj.mp.4002012.
24. Cichon S, Muhleisen TW, Degenhardt FA, Mattheisen M, Miro X, Strohmaier J, et al. Genome-wide association study identifies genetic variation in neurocan as a susceptibility factor for bipolar disorder. Am J Hum Genet. 2011;88(3):372–81. doi:10.1016/j.ajhg.2011.01.017.
25. Ferreira MA, O’Donovan MC, Meng YA, Jones IR, Ruderfer DM, Jones L, et al. Collaborative genome-wide association analysis supports a role for ANK3 and CACNA1C in bipolar disorder. Nat Genet. 2008;40(9):1056–8. doi:10.1038/ng.209. 26. Psychiatric GCBDWG. Large-scale genome-wide association analysis of
bipolar disorder identifies a new susceptibility locus near ODZ4. Nat Genet. 2011;43(10):977–83. doi:10.1038/ng.943.
27. Consortium C. Sparse whole-genome sequencing identifies two loci for major depressive disorder. Nature. 2015;523(7562):588–91. doi:10.1038/nature14659. 28. Consortium SWGotPG. Biological insights from 108 schizophrenia-associated
genetic loci. Nature. 2014;511(7510):421–7. doi:10.1038/nature13595. 29. Ripke S, O’Dushlaine C, Chambert K, Moran JL, Kahler AK, Akterin S, et al.
Genome-wide association analysis identifies 13 new risk loci for schizophrenia. Nat Genet. 2013;45(10):1150–9. doi:10.1038/ng.2742. 30. Shi Y, Li Z, Xu Q, Wang T, Li T, Shen J, et al. Common variants on 8p12
and 1q24.2 confer risk of schizophrenia. Nat Genet. 2011;43(12):1224–7. doi:10.1038/ng.980.
31. Berridge MJ. Calcium signalling and psychiatric disease: bipolar disorder and schizophrenia. Cell Tissue Res. 2014;357(2):477–92. doi:10.1007/ s00441-014-1806-z.
32. Dempster EL, Wong CC, Lester KJ, Burrage J, Gregory AM, Mill J, et al. Genome-wide methylomic analysis of monozygotic twins discordant for adolescent depression. Biol Psychiatry. 2014;76(12):977–83. doi:10.1016/ j.biopsych.2014.04.013.
33. Mill J, Tang T, Kaminsky Z, Khare T, Yazdanpanah S, Bouchard L, et al. Epigenomic profiling reveals DNA-methylation changes associated with major psychosis. Am J Hum Genet. 2008;82(3):696–711. doi:10.1016/j.ajhg.2008.01.008. 34. Cordova-Palomera A, Fatjo-Vilas M, Gasto C, Navarro V, Krebs MO, Fananas L.
Genome-wide methylation study on depression: differential methylation and variable methylation in monozygotic twins. Translational psychiatry. 2015;5:e557. doi:10.1038/tp.2015.49.
35. Ishiai M, Kitao H, Smogorzewska A, Tomida J, Kinomura A, Uchida E, et al. FANCI phosphorylation functions as a molecular switch to turn on the Fanconi anemia pathway. Nat Struct Mol Biol. 2008;15(11):1138–46. doi:10.1038/nsmb.1504.
36. Smogorzewska A, Matsuoka S, Vinciguerra P, McDonald 3rd ER, Hurov KE, Luo J, et al. Identification of the FANCI protein, a monoubiquitinated FANCD2 paralog required for DNA repair. Cell. 2007;129(2):289–301. doi:10.1016/j.cell.2007.03.009.
37. International Schizophrenia C. Rare chromosomal deletions and duplications increase risk of schizophrenia. Nature. 2008;455(7210):237–41. doi:10.1038/nature07239.
38. Stefansson H, Rujescu D, Cichon S, Pietilainen OP, Ingason A, Steinberg S, et al. Large recurrent microdeletions associated with schizophrenia. Nature. 2008;455(7210):232–6. doi:10.1038/nature07229.
39. Malhotra D, Sebat J. CNVs: harbingers of a rare variant revolution in psychiatric genetics. Cell. 2012;148(6):1223–41. doi:10.1016/j.cell.2012.02.039. 40. Ionita-Laza I, Xu B, Makarov V, Buxbaum JD, Roos JL, Gogos JA, et al. Scan
41. Roginski RS, Mohan Raj BK, Birditt B, Rowen L. The human GRINL1A gene defines a complex transcription unit, an unusual form of gene organization in eukaryotes. Genomics. 2004;84(2):265–76. doi:10.1016/j.ygeno.2004.04.004. 42. Lin JW, Wyszynski M, Madhavan R, Sealock R, Kim JU, Sheng M. Yotiao, a
novel protein of neuromuscular junction and brain that interacts with specific splice variants of NMDA receptor subunit NR1. J Neurosci. 1998;18(6):2017–27.
43. Roginski RS, Goubaeva F, Mikami M, Fried-Cassorla E, Nair MR, Yang J. GRINL1A colocalizes with N-methyl D-aspartate receptor NR1 subunit and reduces N-methyl D-aspartate toxicity. Neuroreport. 2008;19(17):1721–6. doi:10.1097/WNR.0b013e328317f05f.
44. Vyklicky V, Korinek M, Smejkalova T, Balik A, Krausova B, Kaniakova M, et al. Structure, function, and pharmacology of NMDA receptor channels. Physiological research / Academia Scientiarum Bohemoslovaca. 2014;63 Suppl 1:S191–203.
45. Harrison PJ. Recent genetic findings in schizophrenia and their therapeutic relevance. J Psychopharmacol. 2015;29(2):85–96. doi:10.1177/0269881114553647. 46. Ghasemi M, Phillips C, Trillo L, De Miguel Z, Das D, Salehi A. The role of
NMDA receptors in the pathophysiology and treatment of mood disorders. Neurosci Biobehav Rev. 2014;47:336–58. doi:10.1016/j.neubiorev.2014.08.017. 47. O’Roak BJ, Vives L, Girirajan S, Karakoc E, Krumm N, Coe BP, et al. Sporadic
autism exomes reveal a highly interconnected protein network of de novo mutations. Nature. 2012;485(7397):246–50. doi:10.1038/nature10989. 48. Rosenbloom KR, Sloan CA, Malladi VS, Dreszer TR, Learned K, Kirkup VM,
et al. ENCODE data in the UCSC Genome Browser: year 5 update. Nucleic Acids Res. 2013;41(Database issue):D56–63. doi:10.1093/nar/gks1172. 49. Cross-Disorder Group of the Psychiatric Genomics C. Identification of risk
loci with shared effects on five major psychiatric disorders: a genome-wide analysis. Lancet. 2013;381(9875):1371–9. doi:10.1016/S0140-6736(12)62129-1. 50. Amato D. Serotonin in antipsychotic drugs action. Behav Brain Res.
2015;277:125–35. doi:10.1016/j.bbr.2014.07.025.
51. Celada P, Puig M, Amargos-Bosch M, Adell A, Artigas F. The therapeutic role of 5-HT1A and 5-HT2A receptors in depression. J Psychiatry Neurosci. 2004;29(4):252–65.
52. Lacerda-Pinheiro SF, Pinheiro Junior RF, Pereira de Lima MA, Lima da Silva CG, Vieira dos Santos Mdo S, Teixeira Junior AG, et al. Are there depression and anxiety genetic markers and mutations? A systematic review. Journal of affective disorders. 2014;168:387–98. doi:10.1016/j.jad.2014.07.016. 53. Zhao X, Sun L, Sun YH, Ren C, Chen J, Wu ZQ, et al. Association of HTR2A
T102C and A-1438G polymorphisms with susceptibility to major depressive disorder: a meta-analysis. Neurol Sci. 2014;35(12):1857–66. doi:10.1007/ s10072-014-1970-7.
54. Ruderfer DM, Fanous AH, Ripke S, McQuillin A, Amdur RL, Schizophrenia Working Group of Psychiatric Genomics, et al. Polygenic dissection of diagnosis and clinical dimensions of bipolar disorder and schizophrenia. Mol Psychiatry. 2014;19(9):1017–24. doi:10.1038/mp.2013.138. 55. Hill MJ, Donocik JG, Nuamah RA, Mein CA, Sainz-Fuertes R, Bray NJ.
Transcriptional consequences of schizophrenia candidate miR-137 manipulation in human neural progenitor cells. Schizophr Res. 2014;153(1-3): 225–30. doi:10.1016/j.schres.2014.01.034.
56. Lin Y, Bloodgood BL, Hauser JL, Lapan AD, Koon AC, Kim TK, et al. Activity-dependent regulation of inhibitory synapse development by Npas4. Nature. 2008;455(7217):1198–204. doi:10.1038/nature07319.
57. de Kloet ER, Joels M, Holsboer F. Stress and the brain: from adaptation to disease. Nat Rev Neurosci. 2005;6(6):463–75. doi:10.1038/nrn1683. 58. Furukawa-Hibi Y, Nagai T, Yun J, Yamada K. Stress increases DNA
methylation of the neuronal PAS domain 4 (Npas4) gene. Neuroreport. 2015;26(14):827–32. doi:10.1097/WNR.0000000000000430.
59. Davies MN, Volta M, Pidsley R, Lunnon K, Dixit A, Lovestone S, et al. Functional annotation of the human brain methylome identifies tissue-specific epigenetic variation across brain and blood. Genome Biol. 2012; 13(6):R43. doi:10.1186/gb-2012-13-6-r43.
60. Lokk K, Modhukur V, Rajashekar B, Martens K, Magi R, Kolde R, et al. DNA methylome profiling of human tissues identifies global and tissue-specific methylation patterns. Genome Biol. 2014;15(4):r54. doi:10.1186/gb-2014-15-4-r54. 61. Houseman EA, Accomando WP, Koestler DC, Christensen BC, Marsit CJ, Nelson
HH, et al. DNA methylation arrays as surrogate measures of cell mixture distribution. BMC Bioinformatics. 2012;13:86. doi:10.1186/1471-2105-13-86. 62. Jaffe AE, Irizarry RA. Accounting for cellular heterogeneity is critical in
epigenome-wide association studies. Genome Biol. 2014;15(2):R31. doi:10.1186/gb-2014-15-2-r31.
63. Asai T, Bundo M, Sugawara H, Sunaga F, Ueda J, Tanaka G, et al. Effect of mood stabilizers on DNA methylation in human neuroblastoma cells. The international journal of neuropsychopharmacology/official scientific journal of the Collegium Internationale Neuropsychopharmacologicum. 2013;16(10):2285–94. doi:10.1017/S1461145713000710.
64. Carlberg L, Scheibelreiter J, Hassler MR, Schloegelhofer M, Schmoeger M, Ludwig B, et al. Brain-derived neurotrophic factor (BDNF)-epigenetic regulation in unipolar and bipolar affective disorder. J Affect Disord. 2014;168:399–406. doi:10.1016/j.jad.2014.07.022.
65. Menke A, Binder EB. Epigenetic alterations in depression and antidepressant treatment. Dialogues Clin Neurosci. 2014;16(3):395–404.
66. Sugawara H, Bundo M, Asai T, Sunaga F, Ueda J, Ishigooka J, et al. Effects of quetiapine on DNA methylation in neuroblastoma cells. Prog Neuropsychopharmacol Biol Psychiatry. 2015;56:117–21. doi:10.1016/j.pnpbp.2014.08.010.
67. Lee RS, Pirooznia M, Guintivano J, Ly M, Ewald ER, Tamashiro KL, et al. Search for common targets of lithium and valproic acid identifies novel epigenetic effects of lithium on the rat leptin receptor gene. Translational psychiatry. 2015;5, e600. doi:10.1038/tp.2015.90.
68. Drysdale E, Knight HM, McIntosh AM, Blackwood DH. Cognitive endophenotypes in a family with bipolar disorder with a risk locus on chromosome 4. Bipolar Disord. 2013;15(2):215–22. doi:10.1111/bdi.12040. 69. Aryee MJ, Jaffe AE, Corrada-Bravo H, Ladd-Acosta C, Feinberg AP, Hansen
KD, et al. Minfi: a flexible and comprehensive Bioconductor package for the analysis of Infinium DNA methylation microarrays. Bioinformatics. 2014;30(10):1363–9. doi:10.1093/bioinformatics/btu049.
70. Gibson G. The environmental contribution to gene expression profiles. Nat Rev Genet. 2008;9(8):575–81. doi:10.1038/nrg2383.
71. Leek JT, Johnson WE, Parker HS, Jaffe AE, Storey JD. The SVA package for removing batch effects and other unwanted variation in high-throughput experiments. Bioinformatics. 2012;28(6):882–3. doi:10.1093/bioinformatics/bts034. 72. Ritchie ME, Phipson B, Wu D, Hu Y, Law CW, Shi W, et al. limma powers
differential expression analyses for RNA-sequencing and microarray studies. Nucleic Acids Res. 2015;43(7):e47. doi:10.1093/nar/gkv007.
73. Butcher LM, Beck S. Probe Lasso: a novel method to rope in differentially methylated regions with 450K DNA methylation data. Methods. 2014. doi:10.1016/j.ymeth.2014.10.036.
74. Fleige S, Pfaffl MW. RNA integrity and the effect on the real-time qRT-PCR performance. Mol Aspects Med. 2006;27(2-3):126–39. doi:10.1016/ j.mam.2005.12.003.
75. Vandesompele J, De Preter K, Pattyn F, Poppe B, Van Roy N, De Paepe A, et al. Accurate normalization of real-time quantitative RT-PCR data by geometric averaging of multiple internal control genes. Genome Biol. 2002; 3(7):RESEARCH0034.
76. Eden E, Lipson D, Yogev S, Yakhini Z. Discovering motifs in ranked lists of DNA sequences. PLoS Comput Biol. 2007;3(3):e39. doi:10.1371/journal.pcbi.0030039.
77. Eden E, Navon R, Steinfeld I, Lipson D, Yakhini Z. GOrilla: a tool for discovery and visualization of enriched GO terms in ranked gene lists. BMC Bioinformatics. 2009;10:48. doi:10.1186/1471-2105-10-48.
• We accept pre-submission inquiries
• Our selector tool helps you to find the most relevant journal • We provide round the clock customer support
• Convenient online submission • Thorough peer review
• Inclusion in PubMed and all major indexing services • Maximum visibility for your research
Submit your manuscript at www.biomedcentral.com/submit

![Table 4 Overlap between DMRs and regions implicated in schizophrenia by a recent large-scale GWAS [28]](https://thumb-us.123doks.com/thumbv2/123dok_us/8989669.1891955/6.595.58.539.99.183/table-overlap-dmrs-regions-implicated-schizophrenia-recent-large.webp)
