www.earth-syst-sci-data.net/7/29/2015/ doi:10.5194/essd-7-29-2015
© Author(s) 2015. CC Attribution 3.0 License.
Mapping hydrological environments in central Amazonia:
ground validation and surface model based on SRTM
DEM data corrected for deforestation
G. M. Moulatlet1,3, C. D. Rennó2, F. R. C. Costa3, T. Emilio3, and J. Schietti3
1Department of Biology, University of Turku, Turku, Finland
2Instituto Nacional de Pesquisas Espaciais, Avenida dos Astronautas, 1758, CEP 12227-010,
São José dos Campos, Brazil
3Instituto Nacional de Pesquisas da Amazônia, Avenida André Araújo, 2936, CP 478, CEP 69011-970,
Manaus, Brazil
Correspondence to: G. M. Moulatlet ([email protected])
Received: 23 June 2014 – Published in Earth Syst. Sci. Data Discuss.: 25 July 2014 Revised: 23 February 2015 – Accepted: 24 February 2015 – Published: 12 March 2015
30 G. M. Moulatlet et al.: Mapping hydrological environments in central Amazonia
1 Introduction
Environmental mapping in the 6 000 000 km2 of the Ama-zon basin remains one of the major challenges in tropical re-search. Remote forests lack reliable environmental data sets at scales that allow detailed studies due to difficulties in ac-cess, monitoring and collecting information. The apparent homogeneity of the forest canopy as seen from above com-prises a mosaic of different environments, which can be de-tected by the ongoing use of remote sensing data and ge-ographic information system (GIS) metrics as descriptors of environmental variation in those remote areas. Among the descriptors, digital elevation models (DEMs) have been shown to be a reliable data source for terrain description in Amazonia because terrain features derived from DEMs can be strongly correlated with soil properties and hydrol-ogy (Rennó et al., 2008; Nobre et al., 2011). Global ele-vation data at high spatial resolution (approximately 90 m) became easily available after the Shuttle Radar Topographic Mission (SRTM) in 2000. Since then, the SRTM DEM has been widely used to map and classify environments in Ama-zonia (Salovaara et al., 2005; Valeriano et al., 2006; Bispo et al., 2009; Valeriano and Rossetti, 2010).
In dense tropical forests, the topographic detail provided by SRTM should be interpreted carefully because the C-band radar used to obtain the DEM interacts in a complex way with the dense forest canopy (Kellndorfer et al., 2004). Over Amazonian forests, the SRTM DEM should therefore be considered as a digital surface model, rather than an ele-vation model, resulting in a reduced detectability of impor-tant terrain features hidden by the dense canopy (Valeriano and Rossetti, 2012). An innovative method to extract hydro-logical features under the dense forest canopy was proposed by Rennó et al. (2008). The authors developed the Height Above the Nearest Drainage (HAND) algorithm, which cal-culates a terrain descriptor that represents the vertical dis-tance of each point of the terrain to the nearest drainage net-work. This terrain descriptor can be interpreted as the local drainage potential (Rennó et al., 2008). The algorithm pro-duces a new DEM where the values represent altitudes rela-tive to the local drainage instead of the sea level. However, the applicability of the HAND approach for a large extent of Amazonia is hampered by the presence of deforested ar-eas, where the original vegetation cover was either degraded or replaced by pasture and abandoned afterwards, converted into a mosaic of secondary forests with different regenera-tion ages. In practice, these areas are interpreted by HAND as depressions, generating false drainage channels and result-ing in misestimation of HAND values in areas around these channels.
In our data set we provide a new SRTM DEM on which deforestation features were corrected based on PRODES (Amazonian Deforestation Monitoring Project; INPE, 2002) accumulated deforestation database. PRODES information was used to identify deforested areas on the original SRTM
that could act as depressions to the HAND algorithm. We also present HAND grids using 18 different drainage net-works automatically extracted from the corrected DEM. The HAND algorithm was initially tested in topographically dis-sected areas in central Amazonia (Nobre et al., 2011), but it also proved to be efficient in large flat areas (Moulatlet et al., 2014). The data set presented in this paper mitigates the lack of reliable data to be used as base for hydrological modelling for the interfluve of the Purus and Madeira rivers, two impor-tant contributors to the Amazon River. This data set can also be broadly used for ecological modelling and is an important contribution for mapping Amazonian lowland forests.
2 Data
2.1 Study site
The data set covers a large area of dense tropical forests in Central Amazonia, delimited by the Purus river in the west, Madeira river in the east and Solimões river in the north (Fig. 1). The interfluve has flat terrains, with relatively low altitudes (27 to 80 m a.s.l on the corrected polygon – SRTM) and has seasonally imperfectly drained soils (Som-broek, 2000). Three geomorphologies are found: alluvial ter-races, mega-slopes and mega-plateaus (Brasil, 1978), each with particular hydrological dynamics related to the soil type and proximity of the large rivers. Mega-plateaus and riverine terraces are subject to flooding, caused by overflow of major tributaries of the Amazon River and by saturation of soil at the end of the rainy season (December–July). Mega-slopes present higher altitudes and well-drained terrains. The main soil types are Plinthosols on mega-plateaus and mega-slopes and Fluvisols on alluvial terraces (Quesada et al., 2011).
2.2 Reducing deforestation features on the SRTM DEM
Figure 1.Study area. The grey scale represents the elevation values in metres from the SRTM-DEM data. The inner box shows the compar-ison between the original SRTM-DEM and the new SRTM-DEM with deforestation features corrected. Both topographic profiles are shown in the graphs. Red polygons indicate the areas where the deforestation correction was done.
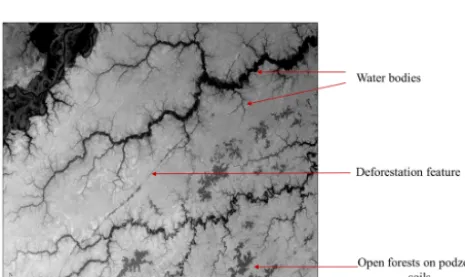
Figure 2.Arrows indicate three important terrain features for inter-pretation of the SRTM. The image shows that deforestation has the same grey colour pattern as rivers and open forests.
PRODES data is acquired from Landsat/CBERS imagery with a spatial resolution of 30 m.
The deforestation correction was done using the program DEM_CORR (Rennó, 2009) implemented in IDL/ENVI, which provides tools to add or subtract elevation values of each pixel of the SRTM DEM. The criterion for adding back values to the pixels is based on the canopy height of the pri-mary forests. Elevation profiles from the pripri-mary forest to the deforested features are used to evaluate the recovery of the canopy height (pixel corrections ranged from 1 to 38 m). As a result, each pixel in deforested areas is assigned a new elevation, recovering the supposed original forest coverage. The original coverage of the patches of vegetation in
vari-able regeneration stages was much more challenging to re-store by our correction method than areas where forest was cut at ground level, since the variation of the pixels’ values on these large regenerating patches is higher. We decided not to correct open areas of savannas because they have irregular borders and large dimensions, which would make the correc-tion process long, and the results could not be satisfactory by the use of our methodology.
The deforestation-corrected SRTM DEM product has a spatial resolution of 3 arcseconds (approximately 90 m close to Ecuador), measuring 7200 columns by 6000 rows, and is available in geoTIFF format. The polygon including cor-rected areas (61◦710W, 05◦090S) is available in shapefile for-mat. Areas outside the limits of the polygon were not cor-rected.
2.3 Drainage network extraction and hydrological modelling
computa-32 G. M. Moulatlet et al.: Mapping hydrological environments in central Amazonia
tional procedures. Extractions made here followed the pro-tocol described in Rennó et al. (2008). The following step is the definition of the contributing area threshold, which in-dicates the number of contributing pixels necessary to initi-ate one drainage channel. The higher the threshold value, the lower is the density of the drainage network. We selected 18 thresholds (10, 20, 30, 40, 50, 100, 150, 200, 250, 300, 350, 400, 500, 600, 700, 800, 900 and 1000) that provided differ-ent densities of drainage networks. Then for each of the 18 drainage networks we calculated the vertical distance to the nearest drainage by the HAND algorithm, which resulted in 18 HAND grids for the study area.
HAND normalizes pixel altitudinal values by changing their reference from sea level to the nearest drainage. This is the hydrologically connected nearest drainage, not neces-sarily the one with the lowest Euclidian distance. As a result, local drainage will have an elevation of zero metres, inde-pendent of their elevation above sea level. The pixels in the neighbourhood will be assigned new values according to the nearest drainage. HAND values close to zero indicate areas where the water table is close to the surface (saturated areas), whereas high values indicate a deep water table (well-drained areas). HAND is a stationary measure and does not vary ac-cording to seasonal variation. It represents the local draining potential of the terrain independent of the season and rainfall variations. The HAND normalization reveals heterogeneous landscapes hidden in the SRTM DEM based on the draining potential of each pixel (Fig. 3). HAND has been used as drological descriptor because of its capability to describe hy-drological environments based on the distance of each pixel of a DEM to the water table (Nobre et al., 2011; Gharari et al., 2011; Schietti et al., 2013).
The 18 selected thresholds allowed the extraction of 18 HAND grids. The use of different thresholds is an attempt to encompass the variety of terrain types found in the Purus– Madeira interfluve, because different geomorphologies may be sensitive for specific drainage thresholds. Therefore, the set of thresholds allows the choice of the most suitable data for different types of studies and environments.
2.4 Ground truth data
We also provided field data obtained along more than 110 km of walking trails inside the forest that contain a qualitative de-scription of the environments along the trails (Table 1). We described environments categorizing the soil drainage con-ditions approximately every 90 m and recorded the presence of all small streams, which are usually undetectable in the SRTM DEM. These environments were identified between August 2010 and February 2011 and include eight classes of hydrological environments, from well-drained to inundated areas. For each description point we recorded the geograph-ical coordinates in order to provide information to validate the choice of drainage thresholds.
Table 1.Structure of the table describing the geographical coordi-nates of the main hydrological features along 110 km of walking trails in the research plots of the Brazilian Program of Biodiver-sity (PPBio) and adjacent trails placed along the interfluve Purus– Madeira. The field name columns contain the information taken along the trails. The original table is available in a shapefile format at http://ppbio.inpa.gov.br/knb/metacat/naman.541.2/ppbio.
Field name Description
Site Site name of plots along the interfluve Purus–Madeira
Latitude Latitudinal coordinate format in decimal degrees
Longitude Longitudinal coordinate format in deci-mal degrees
Plot Plot identification along the interfluve Purus-Madeira
Main_Hydro Main hydrological feature name. Hydro-logical unit represented either by one wa-ter body, such as streams, flooding areas, or by a soil drainage condition.
3 Limitations of data use
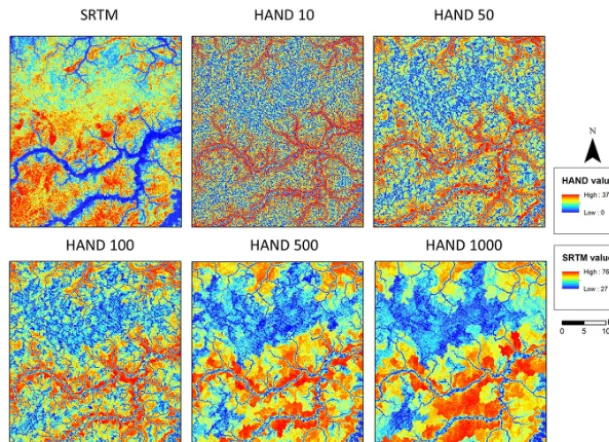
Figure 3.Comparisons among SRTM DEM and HAND DEM at five of the 18 drainage thresholds available. HAND values are indicators of the vertical distance of the terrain to the water table level and provide hydrological environments mapping, useful for ecological modelling over large extent areas. Threshold values (on the top of each HAND figure) were defined during the application of the HAND method and indicate the density of the drainage network based on the number of pixels contributing to the drainage channel initiation (the higher the threshold, the lower is the drainage density).
4 Data set location and format
All the data and metadata presented here are available at the permanent repository of data maintained by the Brazilian Na-tional Program of Research in Biodiversity (PPBio) (Pezzini et al., 2012) hosted at the National Institute for Amazonian Research (INPA) in Manaus, Brazil (http://ppbio.inpa.gov.br/ repositorio/dados). The new SRTM DEM and the set of 18 HAND images are available in geoTIFF format. The field de-scription data, the polygon of corrected areas on the SRTM-DEM and the polygon that limits areas without corrections or drainage validation are available as a shapefile.
5 Data use and reuse
We presented here the products of deforestation corrections on the SRTM DEM using PRODES data sets and a set of 18 hydrological-topographic descriptors (HAND) based on the corrected SRTM DEM. The effects of deforestation were minimized and allowed the application of a more re-liable DEM for terrain modelling. The data set explicitly expresses the role of hydrology on the surface of the land-scape. The deforestation-corrected SRTM DEM was already used in Martins et al. (2014) as a framework for extraction of topographic indexes. Cintra et al. (2013) and Moulatlet et al. (2014) extracted point values from the HAND with threshold of 50 as proxies for local hydrological conditions to describe woody biomass production and herbs species dis-tribution, respectively. The applicability of the
deforestation-corrected SRTM DEM and the HAND data set is not re-stricted to ecological studies: they can be used in any envi-ronmental modelling. The envienvi-ronmental description of the hydrological conditions contains useful information to plan ecological studies on central Amazonia and is especially im-portant for validation of remote sensing products. The data help to fill the gaps in environmental data for Amazonia low-land forests. An extension of this methodology for other ar-eas in Amazonia in the future would be an important step in the mapping of Amazonian forests.
Author contributions. G. M. Moulatlet prepared the manuscript with contribution of all co-authors; G. M. Moulatlet, T. Emilio and J. Schietti collected the data; C. D. Rennó developed the algo-rithm code and ran the analyses; G. M. Moulatlet, C. D. Rennó, F. R. C. Costa, T. Emilio, J. Schietti evaluated and validated the models.
Acknowledgements. We thank the
FAPESP/FAPEAM/HIDROVEG (project no.006/2009, led by F.R.C.C.) and the PRONEX/FAPEAM/CNPq (project no. 16/2006, led by W. E. Magnusson, INPA) for financial support; G. M. Moulatlet had a master’s scholarship provided by CNPq; we thank Livia Naman and Lilian Fernandes for the support from the PPBio data repository; and Jasper Van doninck and two anonymous referees for valuable comments on the manuscript.
34 G. M. Moulatlet et al.: Mapping hydrological environments in central Amazonia
References
Bispo, P. C., Valeriano, M. M., and Kuplich, T. M.: Relation of local geomorphometric variables with the vegetation of the Madeira-Purus interfluve (AM/RO), Acta Amazonica 39, 81–90, doi:10.1590/S0044-59672009000100008, 2009.
Brasil: Projeto Radambrasil. Folha SB.20 Purus; geologia, geomor-fologia, pedologia, vegetação e uso potencial da terra, Mineral, D.N.P., Vol. 17, 566 pp., 1978.
Cintra, B. B. L., Schietti, J., Emillio, T., Martins, D., Moulatlet, G., Souza, P., Levis, C., Quesada, C. A., and Schöngart, J.: Soil physical restrictions and hydrology regulate stand age and wood biomass turnover rates of Purus–Madeira interfluvial wetlands in Amazonia, Biogeosciences, 10, 7759–7774, doi:10.5194/bg-10-7759-2013, 2013.
Gharari, S., Hrachowitz, M., Fenicia, F., and Savenije, H. H. G.: Hydrological landscape classification: investigating the perfor-mance of HAND based landscape classifications in a central European meso-scale catchment, Hydrol. Earth Syst. Sci., 15, 3275–3291, doi:10.5194/hess-15-3275-2011, 2011.
INPE (Instituto Nacional de Pesquisas Espaciais): Deforestation es-timates in the Brazilian Amazon INPE, São José dos Campos, 2002, available at: http://www.obt.inpe.br/prodes/ (last access: 15 November 2013), 2002.
Kellndorfer, J., Walker, W., Pierce, L., Dobson, C., Fites, J. A., Hunsaker, C., Vona, J., and Clutter, M.: Vegetation height estimation from Shuttle Radar Topography Mission and Na-tional Elevation Datasets, Remote Sens. Environ., 93, 339–358, doi:10.1016/j.rse.2004.07.017, 2004.
Martins, D. L., Schietti, J., Feldpausch, T. R., Luizão, F. L., Phillips, O. L., Andrade, A., Castilho, C. V., Laurance, S. G., Oliveira, A., Amaral, I. L., Toledo, J. J., Lugli, L. F., Pinto, J. L. P. V., Mendoza, E. M. O., and Quesada, C. A.: Soil-induced impacts on forest structure drive coarse woody debris stocks across central Amazonia, Plant Ecology & Diversity, 8, 229–241, doi:10.1080/17550874.2013.879942, 2014.
Moulatlet, G. M., Costa, F. R. C., Rennó, C. D., Emilio, T., and Schietti, J.: Local Hydrological Conditions Explain Floristic Composition in Lowland Amazonian Forests, Biotropica, 46, 395–403, doi:10.1111/btp.12117, 2014.
Nobre, A. D., Cuartas, L. A., Hodnett, M., Rennó, C. D., Rodrigues, G., Silveira, A., Waterloo, M., and Saleska, S.: Height Above the Nearest Drainage – a hydrologically relevant new terrain model, J. Hydrol., 404, 13–29, doi:10.1016/j.jhydrol.2011.03.051, 2011. Pezzini, F. F., Melo, P. H .A., Oliveira, D. M. S., Amorim, R. X., Figueiredo, F. O. G., Drucker, D. P., Rodrigues, F. R. O., Zuquim, G., Emilio, T., Costa, F. R. C., Magnusson, W. E., Sampaio, A. F., Lima, A. P., Garcia, A. R. M., Manzatto, A. G., Nogueira, A., Costa, C. P., Barbosa, C. E. D. A., Castilho, C. B. C. V., Cunha, C. N., Freitas, C. G., Cavalcante, C. O., Brandão, D. O., Ro-drigues, D. J., Santos, E. C. P. R., Baccaro, F. B., Ishida, F. Y., Carvalho, F. A., Moulatlet, G. M., Guillaumet, J. L. B., Pinto, J. L. P. V., Schietti, J., Vale, J. D., Belger, L., Verdade, L. M., Pansonato, M. P., Nascimento, M. T., Santos, M. C. V., Cunha, M. S., Arruda, R., Barbosa, R. I., Romero, R. L., Pansini, S., and Pimentel, T. P.: The Brazilian Program for Biodiversity Re-search (PPBio) Information System, Biodiversity & Ecology, 4, 265–274, doi:10.7809/b-e.00083, 2012.
Quesada, C. A., Lloyd, J., Anderson, L. O., Fyllas, N. M., Schwarz, M., and Czimczik, C. I.: Soils of Amazonia with particular ref-erence to the RAINFOR sites, Biogeosciences, 8, 1415–1440, doi:10.5194/bg-8-1415-2011, 2011.
Rennó, C. D.: Redução dos efeitos do desmatamento sobre modelo digital de elevação do SRTM usando imagem TM/LANDSAT, in: Simpósio brasileiro de sensoriamento remoto, 14. (SBSR), Natal. Anais. São José dos Campos: INPE, 2009, 7095–7102, DVD, ISBN 978-85-17-00044-7, available at: http://urlib.net/dpi.inpe. br/sbsr@80/2008/11.15.22.13, 2009.
Rennó, C. D., Nobre, A. D., Cuartas, L. A., Soares, J. V., Hodnett, M. G., Tomasella, J., and Waterloo, M.: HAND, a new terrain de-scriptor using SRTM-DEM; mapping terra-firme rainforest envi-ronments in Amazonia, Remote Sens. Environ., 112, 3469–3481, doi:10.1016/j.rse.2008.03.018, 2008.
Salovaara, K., Thessler, S., Malik, R. N., and Tuomisto, H.: Classi-fication of Amazonian primary rain forest vegetation using Land-sat ETM+satellite imagery, Remote Sens. Environ., 97, 39–51, doi:10.1016/j.rse.2005.04.013, 2005.
Schietti, J., Emilio, T., Rennó, C. D., Drucker, D. P., Costa, F. R. C., Nogueira, A., Baccaro, F. B., Figueiredo, F. B., Castilho, C., Kinupp, V., Guillaumet, J. L., Garcia, A. D., Lima, A., and Mag-nusson, W. E.: Vertical distance from drainage drives floristic composition changes in an Amazonian rainforest, Plant Ecology & Diversity, 7, 241–253, doi:10.1080/17550874.2013.783642, 2013.
Sombroek, W.: Amazon landforms and soil in relation to biological diversity, Acta Amazonica, 30, 81–100, 2000.
Valeriano, M. M. and Rossetti, D. F.: Topographic modeling of Marajó Island with SRTM data, Revista Brasileira de Geomor-fologia, 9, 53–63, 2010.
Valeriano, M. M. and Rossetti, D. F.: Topodata: Brazilian full cov-erage refinement of SRTM data, Appl. Geogr., 32, 300–309, doi:10.1016/j.apgeog.2011.05.004, 2012.