R E S E A R C H
Open Access
Commensal microbiota modulate gene
expression in the skin
Jacquelyn S. Meisel
1, Georgia Sfyroera
1, Casey Bartow-McKenney
1, Ciara Gimblet
1, Julia Bugayev
1,
Joseph Horwinski
1, Brian Kim
2, Jonathan R. Brestoff
3, Amanda S. Tyldsley
1, Qi Zheng
1, Brendan P. Hodkinson
1,
David Artis
4and Elizabeth A. Grice
1*Abstract
Background:The skin harbors complex communities of resident microorganisms, yet little is known of their physiological roles and the molecular mechanisms that mediate cutaneous host-microbe interactions. Here, we profiled skin transcriptomes of mice reared in the presence and absence of microbiota to elucidate the range of pathways and functions modulated in the skin by the microbiota.
Results:A total of 2820 genes were differentially regulated in response to microbial colonization and were enriched in gene ontology (GO) terms related to the host-immune response and epidermal differentiation. Innate immune response genes and genes involved in cytokine activity were generally upregulated in response to microbiota and included genes encoding toll-like receptors, antimicrobial peptides, the complement cascade, and genes involved in IL-1 family cytokine signaling and homing of T cells. Our results also reveal a role for the microbiota in modulating epidermal differentiation and development, with differential expression of genes in the epidermal differentiation complex (EDC). Genes with correlated co-expression patterns were enriched in binding sites for the transcription factors Klf4, AP-1, and SP-1, all implicated as regulators of epidermal differentiation. Finally, we identified transcriptional signatures of microbial regulation common to both the skin and the gastrointestinal tract.
Conclusions:With this foundational approach, we establish a critical resource for understanding the genome-wide implications of microbially mediated gene expression in the skin and emphasize prospective ways in which the microbiome contributes to skin health and disease.
Keywords:RNA sequencing, Cutaneous transcriptome, Germ-free mice, Host-microbe interactions, Skin microbiome
Background
As a barrier to the external environment, the skin har-bors microbial communities that are both topographic-ally diverse and temportopographic-ally complex [1–4]. These microbes are postulated to have important functions in skin health [2], including colonization resistance to block invasion of pathogenic bacteria and regulation of the cu-taneous inflammatory and immune response [5–7]. The skin must sense, interpret, and respond to microbial signals from the environment, orchestrating responses appropriate for the stimuli while maintaining barrier function and protecting itself from pathogenic infection.
Abnormal host-microbe interactions are associated with cutaneous disorders like atopic dermatitis, acne, and psoriasis [8–14], but the exact mechanisms under-lying the microbial contributions to disease development and progression are currently unknown. Identifying the complete range of host functions and pathways evoked by the skin microbiota will improve our understanding of disease pathogenesis and reveal new preventative and therapeutic targets.
The full extent of cutaneous functions regulated by the skin microbiota remains unknown and previous work has focused heavily on characterizing the response of specific pathways to microbial colonization. Recent work in mouse models demonstrates that the commensal microbiota, along with hair follicle morphogenesis, is responsible for recruitment of regulatory T cells during neonatal life [15]. * Correspondence:[email protected]
1Department of Dermatology, University of Pennsylvania Perelman School of
Medicine, 421 Curie Blvd, 1015 BRB II/III, Philadelphia, PA 19104, USA Full list of author information is available at the end of the article
Regulatory T cells additionally establish and mediate im-mune tolerance to skin commensal bacteria during a defined window of development [16]. Skin commensal bacteria also promote interleukin 1 (IL-1) signaling and ef-fector T cell functions, suggesting a role for the microbiota in driving and/or mediating inflammatory skin disorders [6]. Other work has highlighted the contributions of spe-cific types of bacteria in inducing T cell responses via in-teractions with skin-resident dendritic cell subsets [17]. Complement, an ancient and evolutionarily conserved arm of the innate immune system, may also be regulated in the skin by colonization with the commensal micro-biota [18]. While these studies and others have established roles for the microbiota in shaping cutaneous immunity, the broad spectrum of host functions that are elicited and/or mediated by the microbiota, as well as their under-lying molecular mechanisms, remains uncharacterized.
Here, we aimed to identify the molecular signals that mediate the cutaneous host response to the resident skin microbiota on a genome-wide scale, thereby elucidating the full range of cutaneous responses evoked by the microbiome. We used sterile, germ-free mice that have never been exposed to microbiota and compared their cutaneous transcriptome to that of mice conventionally raised in the presence of microbiota. We reasoned that, similar to previous work performed in the gastrointes-tinal tract [19–25], this experimental design would allow us to identify genes and pathways in the skin under tran-scriptional modulation by the microbiome.
Differentially expressed genes were enriched for those related to immunity and epidermal differentiation and de-velopment. Further analysis revealed an enrichment of microbially regulated genes in the epidermal differenti-ation complex, a syntenic cluster of genes regulated in a tissue-specific manner with critical roles in epidermal bar-rier formation [26]. Analysis of coordinately regulated genes suggests that genes under the transcriptional con-trol of Klf-4, AP-1, and SP-1 are microbially regulated. Finally, we identify genes that are similarly regulated by the microbiota in both the skin and gastrointestinal tract, highlighting commonalities in the molecular signals that govern host-microbe interactions at both barrier sites. Collectively, this work provides a critical foundation and resource for understanding cutaneous gene regulation by the microbiota, while establishing the molecular signals governing host responses to microbial colonization.
Results
Commensal microbiota modulate the cutaneous transcriptome
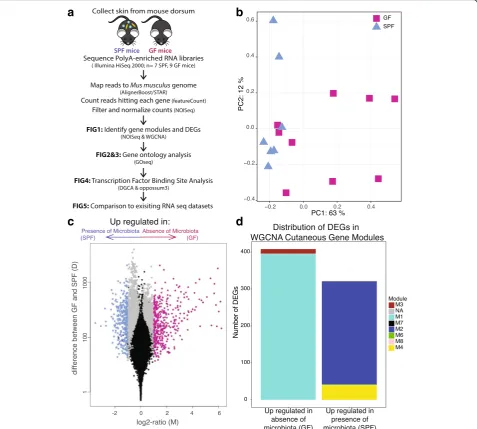
To measure the genome-wide impact of microbial colonization on cutaneous gene transcription, we se-quenced and compared the mRNA transcriptome of skin from mice raised in the absence of microbiota to conven-tionally raised mice (Fig. 1a). Poly-A enriched RNA
isolated from murine germ free (GF; n = 9) and specific pathogen free, conventionally raised (SPF;n= 7) skin was sequenced on the Illumina HiSeq 2000 to obtain over 1.2 billion paired-end reads (median of 60 million reads per sample, see Additional file1: Table S1 for sample summar-ies) of good quality (Additional file2: Figure S1A). Reads were mapped to the mouse reference genome using the STAR aligner [27], in conjunction with AlignerBoost [28]. Of reads that aligned to the mouse reference genome, an average of 88% of reads per sample were assigned to a fea-ture (Additional file 2: Figure S1B), and the majority mapped to protein coding RNA (Additional file2: Figure S1C) with sufficient coverage (Additional file 2: Figure S1D). Gene counts were filtered and normalized in NOISeq [29, 30], yielding a total of 15,448 features for analysis (Additional file 3: Dataset S1). ARSyNseq [31] was used to control for batch effects associated with dif-ferent sequencing runs (Additional file4: Figure S2).
Biological replicates of GF and SPF skin cluster together as demonstrated by non-metric multidimensional scaling (Fig.1b). A total of 2820 genes were differentially expressed between GF and SPF skin (FDR-corrected p value < 0.1, Fig. 1c, Additional file 3: Dataset S1). Of these, 730 genes were differentially expressed by a twofold difference or greater between GF and SPF skin: 408 up-regulated and 322 downup-regulated in the absence of microbiota.
Weighted gene correlation network analysis (WGCNA) [32], an unsupervised method for correlating patterns of gene expression, created a scale-free network with 13 cu-taneous gene modules (Fig. 1d, Additional files 5 and 6: Figure S3A-C, Dataset S2). Ninety percent of all genes were assigned to modules, with the majority belonging to modules M1 and M2 (5613 and 5259 genes, respectively). Genes in each module were significantly enriched in dif-ferent biological processes, including RNA processing and metabolic processes (M1), the immune response (M2), transport (M3), and inflammatory response and keratino-cyte differentiation (M4) (Additional file 7: Table S2). While colonization status clustered closely to and was cor-related with the M4 module (ρ= 0.45,p= 0.08), only the M1 (ρ=−0.58,p= 0.02) and M2 (ρ= 0.6,p= 0.01) mod-ules were significantly correlated with the presence of microbiota (Additional file5: Figure S3D). The majority of differentially expressed genes (DEG) downregulated in SPF skin were assigned to the M1 and M3 modules, while those upregulated in SPF skin were predominantly found in the M2 and M4 modules (Fig.1d).
Cutaneous immune response genes are differentially regulated by resident microbiota
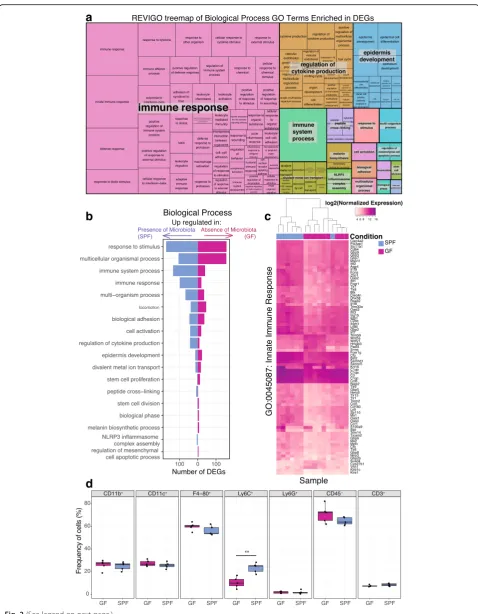
modulated by the commensal microbiota (Additional file 8: Dataset S3), including “immune re-sponse”(FDR-correctedpvalue 3 × 10⁻²⁴, Fig.2a). DEGs contained within GO terms related to the immune re-sponse were generally upregulated in SPF skin (Fig. 2b). For instance, of the 428 genes in our dataset that were characterized by the GO term “innate immune re-sponse,” 82 are differentially expressed (Fig. 2c). Seventy-two of these “innate immune response” DEGs are upregulated in SPF skin and include genes encoding
pattern recognition receptors (Tlr1, Tlr7, Tlr8, Tlr9 Tlr13), interferon regulatory factors (Irf7), and the com-plement cascade (C3, C1qa, C1qb, C1qc, Cfp, Cfb, C3ar1). DEGs encoding antimicrobial proteins were also upregulated in SPF skin, includingSlpiandCcl6.
Molecular function GO terms enriched in the DEGs contained terms related to host-microbe interactions and the immune system, such as“cytokine activity” (GO 0005125), “cytokine receptor binding” (GO 0005126), “toll-like receptor binding” (GO 0035325), and
a
b
c
d
Fig. 1Gene expression profiles differ between SPF and GF skin.aDorsal skin collected from GF and SPF mice was subject to polyA-enriched RNA sequencing to identify transcriptional modulation by skin microbial communities.bNMDS plot based on filtered, normalized, batch effect-corrected read counts from each sample, showing that samples cluster together by condition. Blue triangles indicate SPF samples, and magenta squares indicate GF samples.cVolcano plot highlighting differentially expressed genes. Each dot represents a gene. Gray dots indicate DEGs. Magenta dots indicate DEGs with at least twofold enrichment in GF mice, while blue dots indicate DEGs with at least twofold enrichment in SPF mice. Thex-axis is the log fold change in normalized gene expression and they-axis depicts the log10absolute value of the difference in expression between the two conditions.
a
b
d
c
“interleukin-1 receptor binding” (GO 0005149) (FDR-corrected p values all < 0.05). Analysis of DEGs within the GO term “cytokine activity” revealed differential expression of cytokines/chemokines involved with hom-ing of T cells to the skin, includhom-ing Tslp, Cxcl9, and Ccl28, all upregulated in SPF skin. Interleukin-1 family cytokine genes were also upregulated in SPF skin com-pared to GF, includingIL-1β,Il-33, Il1f8(also known as Il-36β),Il1f9(also known asIl-36γ). In particular, IL-36γ has been implicated in plaque psoriasis [33], and Cathepsin S (Cpss), recently shown to activate IL-36γ [34], was also upregulated in SPF compared to GF skin. Genes encoding pro-inflammatory cytokines, such as Il-33, were upregulated by the microbiota, as were anti-inflammatory cytokines such asIl-10.
KEGG (Kyoto Encyclopedia of Genes and Genomes) pathway analysis corroborated enriched GO terms and identified significant enrichment of the pathways“ comple-ment and coagulation cascades”(ko04610),“Staphylococcus aureus infection” (ko05150), “cytokine-cytokine receptor interaction” (ko04060), and “toll-like receptor signaling pathway”(ko04620) (FDR-correctedpvalue < 0.05).
Analysis of skin immune cell populations supports gene expression findings
Because the skin is composed of heterogeneous cell pop-ulations, and differential infiltration by immune cell subtypes may account for some differences in observed gene expression, we compared GF and SPF skin cellular populations. Toluidine blue staining for mast cells did not reveal significant differences in counts between SPF and GF skin (Additional file9: Figure S4A), nor did im-munofluorescence staining of CD3, a pan T cell marker (Additional file9: Figure S4B).
Flow cytometry was used to further quantify a variety of different cell populations in the skin of SPF and GF mice. No significant differences were observed between GF and SPF skin in frequency of myeloid (CD11b+) cells, dendritic (CD11c+) cells, neutrophils (Ly6G+), non-hematopoietic (CD45−) cells, or T cells (CD3+) (Fig. 2d). In SPF skin, however, Ly6C+ monocytes were signifi-cantly increased in frequency (Fig. 2d). We also saw increased IL-1α production in myeloid, dendritic, macrophage, and non-hematopoietic cell populations in SPF compared to GF skin (Additional file9: Figure S4C),
similar to previous reports of the cutaneous immune microenvironment [6]. Although the frequency of F4/80+ macrophages did not differ (Fig. 2d), an increased frequency of IL-1β producing F4/80+ macrophages was observed in SPF skin, in line with our RNA sequencing data that identified IL-1β as differentially expressed (Additional file 9: Figure S4C, D). Overall, these results support our transcriptome findings of differential gene expression related to cytokine activity and the immune response and confirm previous reports of the cutaneous immune microenvironment.
Epidermal differentiation is regulated by the commensal microbiota
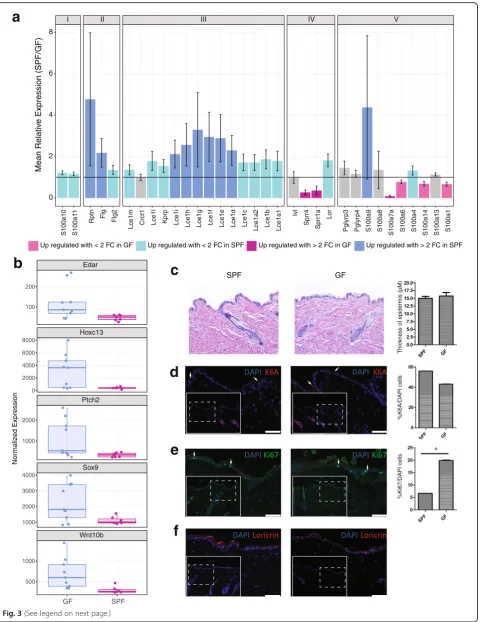
The GO term“keratinocyte differentiation”was significantly enriched in DEGs (FDR corrected p value 2.2 × 10⁻⁵). Of the 101 genes in our dataset that fall under this category, eight were significantly downregulated and 12 were signifi-cantly upregulated in response to microbial colonization. Notably, nine of these genes are found in the epidermal differentiation complex (EDC), a cluster of genes found on murine chromosome 3 encoding proteins involved in terminal differentiation and cornification of keratino-cytes and implicated in cutaneous diseases such as psoriasis and atopic dermatitis [35]. There are 61 total genes in the murine EDC; 33 were retained in our fil-tered, normalized dataset, 27 were significantly differ-entially expressed between GF and SPF mice, and 12 of these DEGs had at least a twofold change in expression (Fig. 3a). This includes late cornified envelope genes (Lce1d, Lce1e, Lce1f, Lce1g, Lce1h, Lce1i, Lce1j, Lce1k) and small proline rich region genes (Sprr1a, Sprr2a3, Sprr4), which encode cornified envelope precursors with protein cross-linking function, all upregulated in SPF compared to GF skin. Other DEGs localizing to the EDC included those encoding the S100 small calcium binding proteins. These include S100a7a (psoriasin) and S100a9, both encoding antimicrobial and/or chemo-tactic proteins which are expressed under a variety of epi-dermal insults including psoriasis and wound healing [36]. Previous studies have demonstrated that Escherichia coli, a Gram-negative bacterium rarely found on human or murine skin, induces expression of S100A7 and S100A15 when heat killed cultures or conditioned media are incubated with keratinocytes in vitro [37, 38].
(See figure on previous page.)
Fig. 2Gene ontology analysis identifies immune response terms enriched in DEGs.aREVIGO treemap showing cluster representatives of Biological Process GO terms that are significantly enriched in the DEGs (FDR-correctedpvalue < 0.05). Larger boxes indicate greater significance, as the box sizes are determined by the absolute value of the log10pvalue.bBarplot depicting the number of DEGs in each of the high-level significant Biological Process GO
a
c
b
d
e
f
Additionally,Flgand Rptnare DEGs encoding the struc-tural proteins filaggrin and repetin, respectively, and were upregulated in SPF mice.
DEGs outside of the EDC but also involved in kera-tinocyte differentiation included the cell adhesion protein cadherin-3 (Cdh3); hornerin (Hrnr), a filaggrin-like S100 protein; and keratin 16 (Krt16), a structural protein recently shown to regulate innate immunity in response to epidermal barrier stress [39]. Genes upregu-lated in GF mice included those encoding the transcrip-tion factors Msx2 and Foxn1. Notably, Foxn1 knockout results in the nude phenotype, characterized by skin defects including impaired keratinization and hair for-mation [40], and genetically interacts with Msx2 up-stream of the Notch signaling pathway [41].
The enrichment of DEGs annotated with the “keratinocyte differentiation” GO term prompted us to further examine other gene subsets that are involved in the development and differentiation of the epidermis. This revealed a variety of transcription factors and regu-lators critical to skin developmental processes including Ptch2, Sox9, Edar, Wnt10b, and Hoxc13, all of which were upregulated in GF compared to SPF skin (Fig.3b).
To further investigate these findings and the potential structural consequences to the skin barrier, we assessed gross morphology of SPF and GF skin by performing hematoxylin and eosin staining of histological sections. As shown in Fig. 3c, no differences in the thickness of epidermis or other structural alterations were observed. Immunofluorescence was also used to visualize markers for differentiation, proliferation, and injury. Staining for cytokeratin 6a (K6A) did not differ between SPF and GF mice and was localized to the hair follicle (Fig. 3d), the site of constitutive expression. Since K6A expression in the interfollicular epidermis is a hallmark response to wound healing [42], we conclude that the barrier integ-rity is similar in SPF and GF mice. Supporting this, the gene encoding K6a (Krt6a) was not differentially expressed. Ki-67, a marker of cellular proliferation [43], was significantly increased in GF skin (Fig.3e), corrobor-ating the finding that the gene encoding Ki-67 (Mki67) was also significantly upregulated in GF skin. Loricrin, a major component of the cornified envelope and a marker of keratinocyte terminal differentiation [44],
appeared qualitatively to be increased in SPF skin by im-munofluorescence (Fig. 3f), suggesting increased terminal differentiation in SPF compared to GF skin. Expression ofKrt1, another marker of terminal differen-tiation, was also significantly increased in expression in SPF mice (Additional file 9: Figure S4E); however, there was no significant difference in expression of Krt14, expressed primarily by proliferating basal keratinocytes [45]. Together, our transcriptional and histological find-ings suggest that the balance between epidermal prolifer-ation and differentiprolifer-ation is altered in response to microbial colonization.
Colonization state shifts gene expression networks for epidermal differentiation and development processes
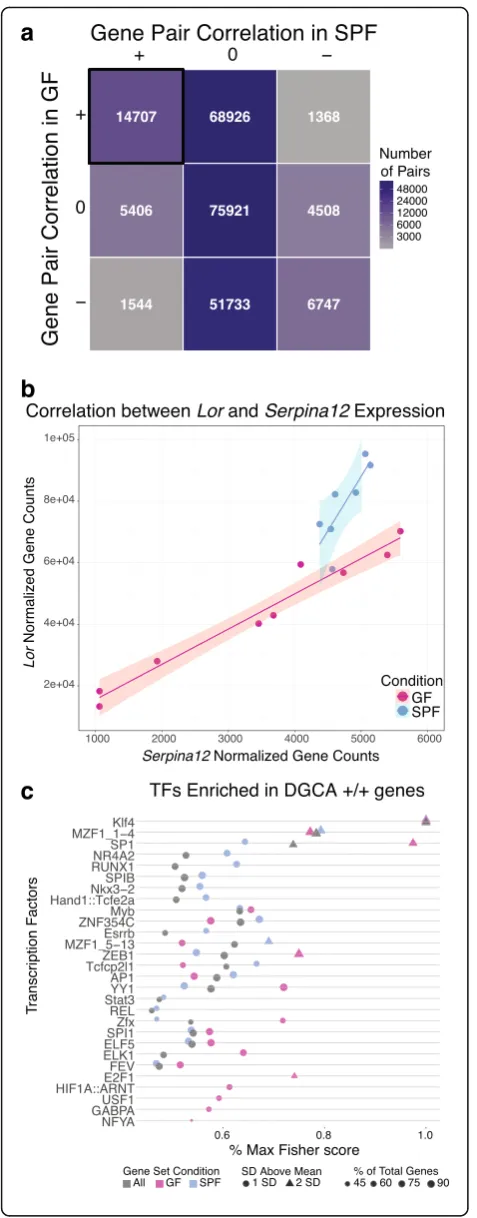
To investigate gene-gene regulatory relationships, we identified gene pairs with similar expression patterns in GF and SPF states using differential gene correlation analysis (DGCA) [46]. We focused on a subset of all DEGs with high relative expression, moderate to high dispersion, and significant co-expression patterns across both colonization conditions. Post-filtering, 661 genes were positively correlated with at least one other gene and 14,707 of 230,860 possible gene pairs were signifi-cantly positively correlated in both SPF and GF skin (Fig. 4a). Additionally, 605 of these 14,707 positively cor-related gene pairs exhibited a significant change in correl-ation between the two colonizcorrel-ation states, indicating an underlying change in modular connectivity profiles. Notably, Loricrin, which encodes a major component of the cornified envelope, and Serpina12, a serine protease inhibitor that has been implicated in the keratinocyte des-quamation process [47,48], are both significantly upregu-lated in the presence of commensal microbiota and are also significantly positively correlated in GF and SPF con-ditions (Fig. 4b). However, a significant decrease in the correlation coefficient between the two genes is observed in SPF compared to GF skin (Fig.4b, q, < 0.05), suggesting an alteration in the gene networks controlling epidermal development in response to microbial colonization.
Genes with positive correlations in both colonization states (n= 661) were further scrutinized for shared tran-scription factor binding sites in oPOSSUM3 [49]. For improved resolution, these genes were also stratified by
(See figure on previous page.)
Fig. 3Genes in the epidermal differentiation complex (EDC) are under microbial regulation.aThe mean relative expression of genes found in the EDC in SPF compared to GF mice. A value of 1 indicates equal expression in the two groups. Colors of the bars indicate DEGs, and error bars represent propagated SE of the ratio SPF/GF. EDC genes are grouped as previously described [35].bBoxplot of normalized gene expression of differentially expressed transcription factors and regulators critical to skin developmental processes.c–fHistology and immunofluorescence staining of SPF and GF skin sections. Dotted line inset boxes indicate the area that is magnified in the figure to orient the reader. White arrowheads are examples of positive cells. Significance testing was performed on an aggregate of three experiments with 3 GF and 3 SPF mice each. A * indicates apvalue < 0.05 by
whether they were upregulated in GF (n = 196) or SPF (n = 465) skin. Twenty-eight total transcription factors (TF) were enriched in our positively correlated gene list (Fig. 4c, Additional file 10: Figure S5). Strikingly, Klf4, an important regulator of epidermal differentiation and barrier formation [50, 51], was the most significant TF across all three gene groupings, validating the relevance of our selected gene set.
Other significantly enriched TFs, such as SP-1 and AP-1, were more discriminatory of colonization status than Klf4. In our analysis, SP-1 was more significant in predicted regulation of GF compared to SPF genes, while AP-1 was predicted to be more significant in regulating SPF genes when considering the Fisher score metric (Fig. 4c). SP-1 has been implicated in regulating epider-mal barrier function and, in conjunction with AP-1, reg-ulates keratinocyte-specific gene expression in vitro [52]. Klf4 and SP-1 have predicted binding sites in both Lori-crinand Serpina12, while AP-1 is predicted to only tar-get Loricrin. Together, these findings suggest that the commensal microbiota differentially regulates underlying gene networks under the control of these TFs in the skin.
DEGs under microbial regulation are common to the skin and gastrointestinal tract
Modulation of gene expression by the gut microbiota has been extensively studied in gastrointestinal tissues [19–24]. To determine if genes and pathways are simi-larly regulated by microbial colonization in both the skin
a
b
c
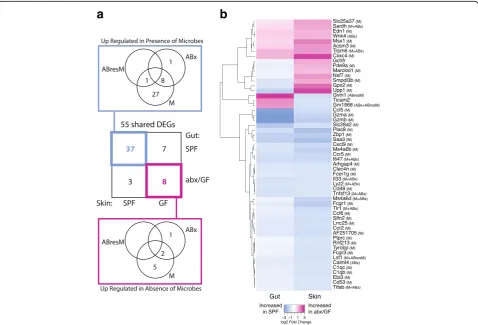
and gastrointestinal tract, we compared our dataset to a 2015 study that examined gene expression profiles of control (conventionally raised SPF) mice to GF mice and mice treated with antibiotics to deplete microbiota [23]. Our data shared 995 of these DEGs; 55 of which were significant with at least a twofold change in expression in both datasets (Fig. 5a, genes listed in Fig. 5b). For each gene, Morgun et al. attributed the observed differ-ential expression in the gut tissue to direct effects of an-tibiotics on host tissue (ABx), depletion of normal microbiota in the gut (M), and/or growth of antibiotic resistant bacteria (ABresM). Compellingly, genes under microbial regulation in both the skin and GI tract were mainly attributed to the depletion of the normal micro-biota rather than to side effects of antibiotic usage (Fig.5a).
The 37 DEGs shared in the gut and skin that are upregulated during microbial colonization include genes
related to the immune response, such as the comple-ment cascade (C1qc, C1qb), cytokines and chemokines (Il-33,Ccr2,Ccr5,Ccl5,Ccl6, Cxcl8,Cxcl9), and toll-like receptors (Tlr1) (Fig. 5b). In particular, IL-33 has been implicated in multiple inflammatory disorders of both the skin and gut. Transgenic expression of IL-33 in mur-ine skin causes spontaneous dermatitis to develop [53] and, in humans, may modulate filaggrin expression and thus skin barrier function [54]. IL-33 is also implicated in colitis in humans and in mouse models [55, 56], suggesting a general role for IL-33 signaling in the medi-ation of host-microbe interactions at epithelial barrier surfaces. Ebi3 is a subunit of the heterodimeric cytokine IL-27, which plays an essential role in regulating cellular proliferation during skin wound repair [57] but similarly mediates intestinal epithelial cell proliferation [58].
Eight genes were downregulated by the microbiota in both the skin and gut. Interestingly, three of these
a
b
genes encode mitochondrial proteins involved in solute transport (Slc25a37), oxidative demethylation (Sardh), and acyl-CoA metabolism (Acsm3), suggesting con-served roles for the microbiota at both tissue types in cellular metabolism. Edn3, or endothelin 3, is the ligand for endothelial receptor type B (Ednrb), which is expressed by neural crest-derived lineages during devel-opment, namely melanocytes (in the skin) and enteric neurons (in the gut) [59]. Trpm6 and Wnk4 are both involved in ion transport in the colon [60], but their role in skin is unclear.
Ten genes were differentially expressed in opposite di-rections in the gut and skin in response to microbial colonization. Genes upregulated by microbiota in the skin but downregulated by microbiota in the gut, include very large interferon-inducible-GTPase (Gvin1), toll-like receptor adaptor molecule 2 (Ticam2), and a predicted gene (Gm1966). Conversely, genes upregulated by microbiota in the gut but downregulated by microbiota in the skin, include GTP cyclohydrolase I feedback regulator (Gchfr), phosphodiesterase 9A (Pde9a), MARCKS-like 1 (Marcksl1), nuclear RNA export factor 7 (Nxf7), sphingomyelin phosphodiesterase, acid-like 3B (Smpdl3b), glutathione peroxidase 2 (Gpx2), and uridine phosphorylase 1 (Upp1). The discordant expression of these genes suggests distinct roles and/or require-ments for tissue homeostasis and tolerance in the gut and skin.
Discussion
As a barrier to the external environment, the skin must effectively orchestrate gene expression programs to establish host-microbe commensalism and maintain cutaneous barrier function. Here, by integrating microbiome research with transcriptional genomics, we investigated cutaneous gene expression profiles from GF and SPF mice to determine how the skin interprets exposure to the commensal microbiota on a genome-wide scale. We identified a previously sup-ported role for the microbiota in regulating immune response pathways in the skin and more surprisingly revealed that the microbiota influences epidermal de-velopment and differentiation pathways. We also identified commonalities in the genes and pathways regulated by the microbiota in the gut and skin. Together, these findings provide novel insight for understanding the fundamental and diverse cutaneous functions imparted by the commensal microbiota and establish a critical resource for further exploration.
Previous work has established cell-type-, organism- and pathway-specific roles for the skin micro-biota in cutaneous immunity. For example, different skin resident microbes can control expression of
antimicrobial peptides [61]. Cutaneous IL-1 signaling has also been shown to be augmented by the commensal microbiota, subsequently promoting effector T cell func-tions [6]. Commensal microbes are also responsible for ac-cumulation of regulatory T cells via a Ccl20-Ccr6 axis in neonatal skin [15]. The work herein collectively confirms these findings at the transcriptome level, while revealing additional immune pathways and responses elicited by the skin microbiota.
Our high-throughput approaches revealed significant transcriptional differences in response to microbial colonization. Network analyses identified co-expressed gene modules in the cutaneous transcriptome. Particu-larly, two gene expression modules including a signifi-cant proportion of genes under microbial regulation contribute to the host-immune response. Upregulation of innate immunity genes in the presence of microbes could be associated with the higher levels of IL-1α observed in SPF compared to GF skin. It is important to note that these expression differences are not accompan-ied by an increase in overall inflammation, supporting the role of the microbiome in priming the cutaneous immune response.
Our data suggest an increase in the proliferative cap-acity of GF skin and the microbial regulation of genes in the EDC. The enrichment of DEGs in this syntenic and relatively gene-dense region may suggest some inter-action between the microbiome, the epigenome, and other regulatory mechanisms. While previous work has shown that genes in the EDC are coordinately regulated [35], it is intriguing to hypothesize that this regulation may in part be modulated by the microbiota. We identi-fied putative transcription factors associated with differ-entially expressed, differentially correlated genes. Although further investigation is required to elucidate the exact mechanisms, our data suggest that genes regu-lated by transcription factors such as Klf4, AP-1, and SP-1 may be regulated in a colonization-dependent manner. A similar phenomenon described in the gastro-intestinal tract demonstrates that hundreds of genes under negative regulation by the transcription factor Hnf4 in zebrafish are microbially regulated, many of which were homologs of genes associated with human inflammatory bowel diseases [62].
absorption of microbiota-derived metabolites into the bloodstream or through effects on immune cell stimula-tion and/or programming [63]. Similarly, the skin micro-biota may have physiological implications at distal sites, which were not investigated here. Additionally, although we used sex- and age-matched mice in this study and confirmed synchronized hair cycles by histology, en-dogenous host factors, such as sex, age, and hair cycle, should be further investigated for their potential to mod-ify cutaneous host-microbe interactions. Finally, our study does not differentiate the effects of different spe-cies/strains of microbiota on transcriptional responses in the skin.
Our foundational approach focused on transcriptional responses to the whole microbial community colonizing conventionally raised SPF mice in comparison to GF mice. Our work provides a framework for further inves-tigation into how specific microbial lineages, host-genetic variation, disease states, and environmental challenges influence microbially mediated gene expression in the skin.
Conclusions
Our results suggest that the skin microbiome mediates two fundamental processes at the transcriptional level in the skin: the immune response and epidermal develop-ment and differentiation. The epidermal differentiation complex was enriched in differentially expressed genes, and differential gene correlation analysis suggests that genetic networks underlying epidermal barrier formation and differentiation are altered by the microbiota and regulated by transcription factors such as Klf4, AP-1, and SP-1.
Methods
Gene expression analysis
Library preparation
All mouse experiments were conducted under proto-cols approved by the University of Pennsylvania Institu-tional Animal Care and Use Committee. Mice were born as GF or SPF at the University of Pennsylvania and housed as such, 3-5 mice per cage, until they were euthanized for tissue harvest. The skin was collected from the dorsum of 8–10-week-old male C57BL/6 mice and stored in RNAlater. Mice were confirmed to have similar (telogen) hair cycle by histological analysis. Poly-A enriched RNA was isolated from harvested GF (n = 9) and SPF (n = 7) skin, and RNA-seq libraries were constructed using the unstranded TruSeq RNA Sample Prep Kit (Illumina). Consistent with ENCODE recommendations, libraries were sequenced on the Illumina HiSeq 2000 to obtain 100 bp paired-end reads per skin sample.
Alignment, filtering, and counting
Transcripts were aligned to the mouse reference genome GRCm38.p4 v9 [64], using STAR [27] in conjunction with AlignerBoost [28], and specifying a seed length of 25, 4% seed mismatch, 0% seed indels, 8% all mismatch, and 3% all indels. Reads mapping to numbered and sex chromosomes were retained. Read counts were gener-ated using featureCount in the subread package [65] and counts to ribosomal RNA were removed. Reads were filtered in NOISeq [29, 30] using method 1, which removes features with a sum of expression values less than 1 count per million multiplied by the number of samples in the condition. Post filtering, TMM normalization was applied and technical batch effects as-sociated with sequencing run were removed using ARSyNseq [31].
Weighted gene correlation network analysis
Filtered, normalized, and batch effect-corrected gene counts were input into the WGCNA R package [32]. A signed-hybrid network was constructed specifying the following parameters (power = 17, pamRespectsDendro = FALSE, minModuleSize = 30, reassignThreshold = 0, mergeCutHeight = 0.25). Gene ontology analysis of mod-ules was performed by converting Ensembl gene IDs to Entrez gene IDs with biomaRt [66] and using the func-tion “GOenrichmentAnalysis” (parameters: organism =“mouse,”nBestP = 5, ontologies = c(“BP”)).
Differential gene expression and gene ontology analysis Differential gene expression was determined using NOISeqBIO (q= 0.9, equivalent to FDR adjusted pvalue of 0.1). Gene ontology (GO) [67] and KEGG pathway [68] analysis were performed using the R package GOSeq [69], and visualization was generated with REVIGO [70], allow-ing medium similarity, usallow-ing the “Mus musculus” data-base, and the SimRel similarity measure.
Differential gene correlation and TFBS analysis
with correlation values of permuted expression data; 10 permutations were performed. Only genes with positive correlations in both colonization states were further considered. Prediction of overrepresented transcription factor binding sites in the positive/positive correlated genes was performed using a single site analysis with default parameters in oPOSSUM3 [49]. Significance was assessed using Fisher scores (significant when > 1 standard deviation above the mean) and Z scores (significant when > 2 standard deviations above the mean). Differences in the relative significance levels between the two scoring methods result from the different parameters and sample distributions used to calculate each score. Additionally, Z scores consider the total number of TFBS in a gene set, while Fisher scores only consider the number of genes in a set containing at least one TFBS.
Comparisons to previously published datasets
Significantly differentially expressed genes with at least a twofold change in expression from a gut microbiome dataset [23] were downloaded from published supple-mentary data and imported into R.
Cellular characterization
Histology and immunofluorescence
Skin biopsies were collected from the dorsal side of SPF and GF mice, fixed in 10% (w/v) formalin, embedded in paraffin, and sectioned at 6 μm. Tissue sections were stained with hematoxylin and eosin to characterize epidermal thickness or with toluidine blue to identify mast cells. For immunofluorescence, sections were deparaffinized with xylene and rehydrated in down-graded alcohol. Heat-inactivated antigen retrieval was performed by incubating the tissue sections in 10-mM sodium citrate buffer, pH 6.0, and subsequently washing the sections with a PBS/0.2% Triton solution. Tissue sections were blocked with 10% (v/v) normal goat serum for 2 h at room temperature. After blocking, sections were incubated with a primary antibody. The antibodies that were used include anti-mouse Keratin 6A (Biolegend), anti-mouse Loricrin (Biolegend), anti-mouse CD3 (Abcam), and anti-anti-mouse Ki67 (Abcam). Following multiple washes, secondary antibodies, goat anti-rabbit IgG-Alexa, and goat anti-mouse-Alexa 555 were applied for 1 h at room temperature and then washed. Slides were mounted with prolong DAPI (Molecular Probes) and examined under a fluorescent microscope (Leica DM550B). Positive-stained cells were counted in five fields per tissue section at × 400 magnifi-cation, three tissue sections per mouse, and three mice per group.
Tissue processing and flow cytometry
Skin biopsies were collected from the dorsal side of 5 SPF and 5 GF mice. A section of skin was harvested from the dorsum of the mice following hair removal with an electric trimmer equipped with a two-hole preci-sion blade (Wahl) and treatment with a hair removal lotion (Nair). Skin sections were then minced with a sterile scalpel blade into ~ 2-mm sections and incubated in 5 mL of RPMI containing 12.5 mg/mL of Liberase TL (Roche) and 100μg/mL of DNAse I (Sigma-Aldrich) for 120 min with vortexing every 30 min. The resulting sin-gle cell solution was passed through a 40-μm cell strainer and resuspended in cRPMI. For analysis of sur-face markers and intracellular cytokines, cells were incu-bated for 4 h with 10μg/mL of brefeldin A, 50 ng/mL of PMA, and 500 ng/mL ionomycin (Sigma-Aldrich). Before staining, cells were incubated with anti-mouse CD16/CD32 mouse Fc block (eBioscience) and 10% rat-IgG in PBS containing 0.1% BSA. Cells were stained for dead cells with LIVE/DEAD Fixable Aqua Dead Cell Stain Kit (Molecular Probes) and surface markers (CD4 [eBioscience, clone RM4-5], CD8β [BioLegend, clone YTS156.7.7], CD45 [eBioscience, clone 30-F11], TCRγδ [BD Biosciences, clone GL3], Ly6G [eBioscience, clone 1A8-Ly6g], Ly6C [BD Biosciences, clone AL-21], CD11b [eBioscience, clone M1/70], CD11c [eBiosciences, clone N418], F4/80 [eBioscience, clone BM8]) followed by fix-ation with 2% of formaldehyde and permeablizfix-ation with 0.2% saponin/PBS. Intracellular cytokine staining was performed for pro-IL-1β (eBioscience, clone NJTEN3), IL-17 (eBioscience, clone eBio17B7). The data were col-lected using LSRII flow cytometer (BD) and analyzed using FlowJo software (Tree Star).
Additional files
Additional file 1: Table S1.Sample summary statistics. Rows contain the 16 samples analyzed; with columns containing associated sequencing statistics and metadata. (XLSX 56 kb)
Additional file 2: Figure S1.Quality control of RNA-sequencing data. (A) Mean quality score per base for each of the 16 samples. (B) Number of reads mapping to the mouse reference genome for each sample. (C) Relative abundance of reads mapping to each biotype. (D) Percentage of the genome covered by mapped reads per sample. (EPS 1354 kb)
Additional file 3:Dataset S1. Results from differential expression analysis. Rows contain the 15,448 features analyzed. Columns contain Ensembl feature id, mean expression of GF samples, mean expression of SPF samples, the NOISeq differential expression statistic theta, the probability of differential expression (equal to 1-FDR-correctedpvalue when using NOISeqBio, DEGs defined as those with prob. > 0.9), the log2fold change
in expression (upregulated in GF > 0, downregulated in GF < 0), feature length, chromosome, feature start and end coordinates, feature biotype, and feature symbol. (XLSX 2289 kb)
magenta = GF) and shape indicating sequencing run. ARSyNseq was run with the following parameters (factor =“RunName”, batch = TRUE, norm =“n”, logtransf = FALSE). (EPS 642 kb)
Additional file 5: Figure S3.WGCNA identifies cutaneous gene modules. (A) Hierarchical clustering of samples prior to network generation (B) thresholding analysis, showing scale-free properties of the network with a chosen soft threshold power of 17. Yellow line indicates anR2value of 0.8, orange of 0.85, and red of 0.9. (C) WGCNA cluster
dendrogram of genes in our dataset, with the module membership highlighted below the dendrogram. Gray indicates genes not belonging to any of the determined modules. Dendrogram represents hierarchical clustering of eigengene modules in relation to each other and colonization condition. (D) Correlation of each module to metadata. For each comparison, the rho value is provided above thepvalue in parentheses. No modules are significantly correlated with sequencing run. The color of each box in the
“Colonization Condition”column indicates the strength of the positive correlation with SPF (blue) or GF (magenta) states. (EPS 6217 kb)
Additional file 6Dataset S2. Results from WGCNA analysis. Rows contain the features contained in each WGCNA module. Columns contain Ensembl feature id, gene symbol, module name, module color membership, gene significance (GS) for colonization condition (defined as the absolute value of the correlation between the feature and metadata) and associatedpvalue, and module membership (MM) for each module (defined as the correlation of the module eigengene and the gene expression profile) and associated
pvalue, the Entrez gene ID used for gene ontology analysis, and the differential gene expression status. (XLSX 8459 kb)
Additional file 7: Table S2.WGCNA gene module characterization. Top 5 significantly enriched biological process gene ontology terms (Bonferroni
p< 0.05) associated with each WGCNA module. (XLSX 47 kb)
Additional file 8Dataset S3. Results from gene ontology analysis. Each worksheet contains differential expression analysis results for features in the mentioned gene ontology categories. Blue and orange cells indicate significant DEGs with and without a twofold change difference in expression, respectively. (XLSX 367 kb)
Additional file 9: Figure S4.Analysis of skin immune cell populations supports gene expression findings. (A) Toluidine blue staining for mast cells. (B) Immunofluorescence staining of CD3, a pan T cell marker. Significance testing was performed on an aggregate of three experiments withn= 3 GF and SPF mice each. (C) Flow cytometry analysis of GF and SPF (n= 5 each) of IL-1αand IL-1βproduction by cell subset. Comparisons that are significantly different with apvalue < 0.05 are denoted with * and those with apvalue < 0.01 with **. (D) Barplots showing normalized gene expression values forIL-1αandIL-1β. Lines depict standard error and padj represents the FDR-correctedpvalue (1-prob) calculated by NOISeqBio. (E) Boxplot of normalized gene expression of terminal differentiation markers
Krt1andKrt14, with padj indicating the FDR-correctedpvalue (1-prob) calculated by NOISeqBio. (EPS 85855 kb)
Additional file 10: Figure S5.DGCA analysis identified significantly correlated DEGs that share potential transcription factor binding sites. Analysis with oppossum3 identified enriched transcription factors in positively correlated DGCA gene sets, usingZscores to assess significance. They-axis identifies significant transcription factors, whilex-axis represents the significance metric, with higher values indicating greater significance, and the shape indicating whether the metric score was 1 or 2 standard deviations (SD) above the mean.Zscores are significant when greater than 2 SD above the mean. Size of each point reflects the percentage of all DGCA +/+ DEGs containing a binding region for each TF and color indicates colonization status of the DGCA +/+ DEGs. (EPS 1582 kb)
Abbreviations
DEG:Differentially expressed gene; DGCA: Differential Gene Correlation Analysis; EDC: Epidermal differentiation complex; FDR: False discovery rate; GF: Germ free; GO: Gene ontology; IL-1: Interleukin 1; KEGG: Kyoto Encyclopedia of Genes and Genomes; NMDS: Non-metric multidimensional scaling; SPF: Specific pathogen free; TF: Transcription factor;
WGCNA: Weighted gene network analysis
Acknowledgements
We thank the Penn Next Generation Sequencing Core for sequencing support, the Penn Medicine Academic Computing Services for computing resources, and the members of the Grice laboratory for their underlying contributions.
Funding
EAG is supported by grants from the National Institute of Arthritis and Musculoskeletal and Skin Diseases, the National Institute of Nursing Research (R00-AR060873, R01-AR066663, P30-AR057217, and R01-NR015639), and the Linda Pechenik Montague Investigator Award. JSM is supported by the NIH T32 HG000046 Computational Genomics Training Grant. DA is supported by grants from the National Institutes of Health (AI061570, AI087990, AI074878, AI083480, AI095466, AI095608, AI102942, and AI097333). The content is solely the responsibility of the authors and does not necessarily represent the official views of the National Institutes of Health. This work used the Extreme Science and Engineering Discovery Environment (XSEDE), which is supported by the National Science Foundation grant number ACI-1053575. This research was also supported by the Core A of the Penn Skin Biology and Diseases Resource-based Center, funded by 1P30AR069589-01 (Millar).
Availability of data and materials
Raw and processed data files are available under GSE98877 Super Series in the Gene Expression Omnibus (GEO) data repository. Intermediate files and analysis scripts are archived at Figshare and available at doi:https://doi.org/10.6084/ m9.figshare.5047069. Correspondence and requests for materials should be addressed to Elizabeth A. Grice, [email protected].
Authors’contributions
JSM and EAG conceived and designed the study. AST, BK, JB, GS, CG, JB, and JH performed the experimental procedures. JSM, CBM, QZ, and BH analyzed the sequence data. BK, JB, and DA provided the resources. JSM and EAG drafted the manuscript. All authors edited and approved the manuscript.
Ethics approval and consent to participate
All mouse experiments were approved by the University of Pennsylvania Institutional Animal Care and Use Committee (IACUC).
Consent for publication
Not applicable.
Competing interests
The authors declare that they have no competing interests.
Publisher’s Note
Springer Nature remains neutral with regard to jurisdictional claims in published maps and institutional affiliations.
Author details
1
Department of Dermatology, University of Pennsylvania Perelman School of Medicine, 421 Curie Blvd, 1015 BRB II/III, Philadelphia, PA 19104, USA. 2
Department of Dermatology, Washington University School of Medicine, St. Louis, MO 63110, USA.3Department of Pathology and Immunology, Washington University School of Medicine, St. Louis, MO 63110, USA.4Jill Roberts Institute for Research in Inflammatory Bowel Disease, Joan and Sanford I. Weill Department of Medicine, Weill Cornell Medicine, Cornell University, New York, NY 10021, USA.
Received: 12 June 2017 Accepted: 18 January 2018
References
1. Grice EA, Kong HH, Conlan S, Deming CB, Davis J, Young AC, NISC Comparative Sequencing Program, Bouffard GG, Blakesley RW, Murray PR, Green ED, Turner ML, Segre JA. Topographical and temporal diversity of the human skin microbiome. Science. 2009;324:1190–2.
2. Grice EA, Segre JA. The skin microbiome. Nat Publ Group. 2011;9:244–53. 3. Hannigan GD, Meisel JS, Tyldsley AS, Zheng Q, Hodkinson BP, SanMiguel AJ,
4. Oh J, Byrd AL, Deming C, Conlan S, NISC Comparative Sequencing Program, Kong HH, Segre JA. Biogeography and individuality shape function in the human skin metagenome. Nature. 2014;514:59–64.
5. Lai Y, Di Nardo A, Nakatsuji T, Leichtle A, Yang Y, Cogen AL, Wu Z-R, Hooper LV, Schmidt RR, Aulock Von S, Radek KA, Huang C-M, Ryan AF, Gallo RL. Commensal bacteria regulate toll-like receptor 3-dependent inflammation after skin injury. Nat Med. 2009;15:1377–82.
6. Naik S, Bouladoux N, Wilhelm C, Molloy MJ, Salcedo R, Kastenmuller W, Deming C, Quinones M, Koo L, Conlan S, Spencer S, Hall JA, Dzutsev A, Kong H, Campbell DJ, Trinchieri G, Segre JA, Belkaid Y. Compartmentalized control of skin immunity by resident commensals. Science. 2012;337:1115–9.
7. Nakatsuji T, Chen TH, Narala S, Chun KA, Two AM, Yun T, Shafiq F, Kotol PF, Bouslimani A, Melnik AV, Latif H, Kim J-N, Lockhart A, Artis K, David G, Taylor P, Streib J, Dorrestein PC, Grier A, Gill SR, Zengler K, Hata TR, Leung DYM, Gallo RL. Antimicrobials from human skin commensal bacteria protect against Staphylococcus aureus and are deficient in atopic dermatitis. Sci Transl Med. 2017;9:eaah4680.
8. Kennedy EA, Connolly J, O'B Hourihane J, Fallon PG, McLean WI, Murray D, Jo J-H, Segre JA, Kong HH, Irvine AD. Skin microbiome prior to development of atopic dermatitis: early colonization with commensal staphylococci at 2 months is associated with a lower risk of atopic dermatitis at 1 year. J Allergy Clin Immunol. 2017;139:166–72.
9. Kobayashi T, Glatz M, Horiuchi K, Kawasaki H, Akiyama H, Kaplan DH, Kong HH, Amagai M, Nagao K. Dysbiosis and Staphylococcus aureus colonization drives inflammation in atopic dermatitis. Immunity. 2015;42:756–66. 10. Kong HH, Oh J, Deming C, Conlan S, Grice EA, Beatson MA, Nomicos E, Polley
EC, Komarow HD, NISC Comparative Sequence Program, Murray PR, Turner ML, Segre JA. Temporal shifts in the skin microbiome associated with disease flares and treatment in children with atopic dermatitis. Genome Res. 2012;22:850–9. 11. Fitz-Gibbon S, Tomida S, Chiu B-H, Nguyen L, Du C, Liu M, Elashoff D, Erfe
MC, Loncaric A, Kim J, Modlin RL, Miller JF, Sodergren E, Craft N, Weinstock GM, Li H. Propionibacterium acnes strain populations in the human skin microbiome associated with acne. J Invest Dermatol. 2013;133:2152–60. 12. Barnard E, Shi B, Kang D, Craft N, Li H. The balance of metagenomic
elements shapes the skin microbiome in acne and health. Nat Publ Group. 2016;6:39491.
13. Alekseyenko AV, Perez-Perez GI, De Souza A, Strober B, Gao Z, Bihan M, Li K, Methé BA, Blaser MJ. Community differentiation of the cutaneous microbiota in psoriasis. Microbiome. 2013;1:31.
14. Tett A, Pasolli E, Farina S, Truong DT, Asnicar F, Zolfo M, Beghini F, Armanini F, Jousson O, De Sanctis V, Bertorelli R, Girolomoni G, Cristofolini M, Segata N. Unexplored diversity and strain-level structure of the skin microbiome associated with psoriasis. NPJ Biofilms Microbiomes. 2017;3:14. 15. Scharschmidt TC, Vasquez KS, Pauli ML, Leitner EG, Leitner EG, Chu K, Chu K,
Truong H-A, Lowe MM, Lowe MM, Rodriguez RS, Sanchez Rodriguez R, Ali N, Ali N, Laszik ZG, Laszik ZG, Sonnenburg JL, Millar SE, Millar SE, Rosenblum MD. Commensal microbes and hair follicle morphogenesis coordinately drive treg migration into neonatal skin. Cell Host Microbe. 2017;21:467–477.e5. 16. Scharschmidt TC, Vasquez KS, Truong H-A, Gearty SV, Pauli ML, Nosbaum A,
Gratz IK, Otto M, Moon JJ, Liese J, Abbas AK, Fischbach MA, Rosenblum MD. A wave of regulatory T cells into neonatal skin mediates tolerance to commensal microbes. Immunity. 2015;43:1011–21.
17. Naik S, Bouladoux N, Linehan JL, Han S-J, Harrison OJ, Wilhelm C, Conlan S, Himmelfarb S, Byrd AL, Deming C, Quinones M, Brenchley JM, Kong HH, Tussiwand R, Murphy KM, Merad M, Segre JA, Belkaid Y. Commensal-dendritic-cell interaction specifies a unique protective skin immune signature. Nature. 2015;520:104–8.
18. Chehoud C, Rafail S, Tyldsley AS, Seykora JT, Lambris JD, Grice EA: Complement modulates the cutaneous microbiome and inflammatory milieu. Proc Natl Acad Sci U S A. 2013;110:15061–6.
19. Camp JG, Frank CL, Lickwar CR, Guturu H, Rube T, Wenger AM, Chen J, Bejerano G, Crawford GE, Rawls JF. Microbiota modulate transcription in the intestinal epithelium without remodeling the accessible chromatin landscape. Genome Res. 2014;24:1504–16.
20. Camp JG, Jazwa AL, Trent CM, Rawls JF. Intronic cis-regulatory modules mediate tissue-specific and microbial control of angptl4/fiaf transcription. PLoS Genet. 2012;8:e1002585.
21. Hooper LV, Wong MH, Thelin A, Hansson L, Falk PG, Gordon JI. Molecular analysis of commensal host-microbial relationships in the intestine. Science. 2001;291:881–4.
22. Larsson E, Tremaroli V, Lee YS, Koren O, Nookaew I, Fricker A, Nielsen J, Ley RE, Bäckhed F. Analysis of gut microbial regulation of host gene expression along the length of the gut and regulation of gut microbial ecology through MyD88. Gut. 2012;61:1124–31.
23. Morgun A, Dzutsev A, Dong X, Greer RL, Sexton DJ, Ravel J, Schuster M, Hsiao W, Matzinger P, Shulzhenko N. Uncovering effects of antibiotics on the host and microbiota using transkingdom gene networks. Gut. 2015;64: 1732–43.
24. Richards AL, Burns MB, Alazizi A, Barreiro LB, Pique-Regi R, Blekhman R, Luca F. Genetic and transcriptional analysis of human host response to healthy gut microbiota. mSystems. 2016;1:e00067–16.
25. Vétizou M, Pitt JM, Daillère R, Lepage P, Waldschmitt N, Flament C, Rusakiewicz S, Routy B, Roberti MP, Duong CPM, Poirier-Colame V, Roux A, Becharef S, Formenti S, Golden E, Cording S, Eberl G, Schlitzer A, Ginhoux F, Mani S, Yamazaki T, Jacquelot N, Enot DP, Bérard M, Nigou J, Opolon P, Eggermont A, Woerther P-L, Chachaty E, Chaput N, et al. Anticancer immunotherapy by CTLA-4 blockade relies on the gut microbiota. Science. 2015;350:1079–84.
26. Oh IY, de Guzman SC. The molecular revolution in cutaneous biology: EDC and locus control. J Invest Dermatol. 2017;137:e101–4.
27. Dobin A, Davis CA, Schlesinger F, Drenkow J, Zaleski C, Jha S, Batut P, Chaisson M, Gingeras TR. STAR: ultrafast universal RNA-seq aligner. Bioinformatics. 2013;29:15–21.
28. Zheng Q, Grice EA. AlignerBoost: a generalized software toolkit for boosting next-gen sequencing mapping accuracy using a Bayesian-based mapping quality framework. PLoS Comput Biol. 2016;12:e1005096.
29. Tarazona S, Furió-Tarí P, Turrà D, Pietro AD, Nueda MJ, Ferrer A, Conesa A. Data quality aware analysis of differential expression in RNA-seq with NOISeq R/Bioc package. Nucleic Acids Res. 2015;43:e140.
30. Tarazona S, García-Alcalde F, Dopazo J, Ferrer A, Conesa A. Differential expression in RNA-seq: a matter of depth. Genome Res. 2011;21:2213–23. 31. Nueda MJ, Ferrer A, Conesa A. ARSyN: a method for the identification and
removal of systematic noise in multifactorial time course microarray experiments. Biostatistics. 2012;13:553–66.
32. Langfelder P, Horvath S. WGCNA: an R package for weighted correlation network analysis. BMC Bioinformatics. 2008;9:559–72.
33. D'Erme AM, Wilsmann-Theis D, Wagenpfeil J, Hölzel M, Ferring-Schmitt S, Sternberg S, Wittmann M, Peters B, Bosio A, Bieber T, Wenzel J. IL-36γ(IL-1F9) is a biomarker for psoriasis skin lesions. J Invest Dermatol. 2015;135:1025–32. 34. Ainscough JS, Macleod T, McGonagle D, Brakefield R, Baron JM, Alase A, Wittmann
M, Stacey M. Cathepsin S is the major activator of the psoriasis-associated proinflammatory cytokine IL-36γ. Proc Natl Acad Sci U S A. 2017;114:E2748–57. 35. de Guzman SC, Conlan S, Deming CB, Cheng J, Sears KE, Segre JA. A milieu of
regulatory elements in the epidermal differentiation complex syntenic block: implications for atopic dermatitis and psoriasis. Hum Mol Genet. 2010;19:1453–60. 36. Thorey IS, Roth J, Regenbogen J, Halle JP, Bittner M, Vogl T, Kaesler S, Bugnon
P, Reitmaier B, Durka S, Graf A, Wöckner M, Rieger N, Konstantinow A, Wolf E, Goppelt A, Werner S. The Ca2+-binding proteins S100A8 and S100A9 are encoded by novel injury-regulated genes. J Biol Chem. 2001;276:35818–25. 37. Büchau AS, Hassan M, Kukova G, Lewerenz V, Kellermann S, Würthner JU,
Wolf R, Walz M, Gallo RL, Ruzicka T. S100A15, an antimicrobial protein of the skin: regulation by E. coli through toll-like receptor 4. J Invest Dermatol. 2007;127:2596–604.
38. Gläser R, Harder J, Lange H, Bartels J, Christophers E, Schröder J-M. Antimicrobial psoriasin (S100A7) protects human skin from Escherichia coli infection. Nat Immunol. 2005;6:57–64.
39. Lessard JC, Piña-Paz S, Rotty JD, Hickerson RP, Kaspar RL, Balmain A, Coulombe PA. Keratin 16 regulates innate immunity in response to epidermal barrier breach. Proc Natl Acad Sci U S A. 2013;110:19537–42. 40. Köpf-Maier P, Mboneko VF, Merker HJ. Nude mice are not hairless. A
morphological study. Acta Anat (Basel). 1990;139:178–90.
41. Cai J, Lee J, Kopan R, Ma L. Genetic interplays between Msx2 and Foxn1 are required for Notch1 expression and hair shaft differentiation. Dev Biol. 2009;326:420–30. 42. Paladini RD, Takahashi K, Bravo NS, Coulombe PA. Onset of
re-epithelialization after skin injury correlates with a reorganization of keratin filaments in wound edge keratinocytes: defining a potential role for keratin 16. J Cell Biol. 1996;132:381–97.
43. Scholzen T, Gerdes J. The Ki-67 protein: from the known and the unknown. J Cell Physiol. 2000;182:311–22.
45. Roop DR, Hawley-Nelson P, Cheng CK, Yuspa SH. Keratin gene expression in mouse epidermis and cultured epidermal cells. Proc Natl Acad Sci U S A. 1983;80:716–20.
46. McKenzie AT, Katsyv I, Song W-M, Wang M, Zhang B. DGCA: a comprehensive R package for differential gene correlation analysis. BMC Syst Biol. 2016;10:106.
47. Ishida-Yamamoto A, Igawa S. The biology and regulation of corneodesmosomes. Cell Tissue Res. 2015;360:477–82.
48. Toulza E, Mattiuzzo NR, Galliano M-F, Jonca N, Dossat C, Jacob D, de Daruvar A, Wincker P, Serre G, Guerrin M. Large-scale identification of human genes implicated in epidermal barrier function. Genome Biol. 2007;8:R107. 49. Kwon AT, Arenillas DJ, Hunt RW, Wasserman WW. oPOSSUM-3: advanced
analysis of regulatory motif over-representation across genes or ChIP-Seq datasets. G3: Genes, Genomes, Genetics. 2012;2:987–1002.
50. Jaubert J, Cheng J, Segre JA. Ectopic expression of Kruppel like factor 4 (Klf4) accelerates formation of the epidermal permeability barrier. Development. 2003;130:2767–77.
51. Segre JA, Bauer C, Fuchs E. Klf4 is a transcription factor required for establishing the barrier function of the skin. Nat Genet. 1999;22:356–60. 52. Nakamura Y, Kawachi Y, Xu X, Sakurai H, Ishii Y, Takahashi T, Otsuka F. The
combination of ubiquitous transcription factors AP-1 and Sp1 directs keratinocyte-specific and differentiation-specific gene expression in vitro. Exp Dermatol. 2007;16:143–50.
53. Imai Y, Yasuda K, Sakaguchi Y, Haneda T, Mizutani H, Yoshimoto T, Nakanishi K, Yamanishi K. Skin-specific expression of IL-33 activates group 2 innate lymphoid cells and elicits atopic dermatitis-like inflammation in mice. Proc Natl Acad Sci U S A. 2013;110:13921–6.
54. Seltmann J, Roesner LM, Hesler Von F-W, Wittmann M, Werfel T. IL-33 impacts on the skin barrier by downregulating the expression of filaggrin. J Allergy Clin Immunol. 2015;135:1659–61.e4.
55. Sedhom MAK, Pichery M, Murdoch JR, Foligné B, Ortega N, Normand S, Mertz K, Sanmugalingam D, Brault L, Grandjean T, Lefrancais E, Fallon PG, Quesniaux V, Peyrin-Biroulet L, Cathomas G, Junt T, Chamaillard M, Girard J-P, Ryffel B. Neutralisation of the interleukin-33/ST2 pathway ameliorates experimental colitis through enhancement of mucosal healing in mice. Gut. 2013;62:1714–23. 56. Pastorelli L, Garg RR, Hoang SB, Spina L, Mattioli B, Scarpa M, Fiocchi C,
Vecchi M, Pizarro TT. Epithelial-derived IL-33 and its receptor ST2 are dysregulated in ulcerative colitis and in experimental Th1/Th2 driven enteritis. Proc Natl Acad Sci U S A. 2010;107:8017–22.
57. Yang B, Suwanpradid J, Sanchez-Lagunes R, Choi HW, Hoang P, Wang D, Abraham SN, MacLeod AS. IL-27 facilitates skin wound healing through induction of epidermal proliferation and host defense. J Invest Dermatol. 2017;137:1166–75. 58. Diegelmann J, Olszak T, Göke B, Blumberg RS, Brand S. A novel role for
interleukin-27 (IL-27) as mediator of intestinal epithelial barrier protection mediated via differential signal transducer and activator of transcription (STAT) protein signaling and induction of antibacterial and anti-inflammatory proteins. J Biol Chem. 2012;287:286–98.
59. McCallion AS, Chakravarti A. EDNRB/EDN3 and Hirschsprung disease type II. Pigment Cell Res. 2001;14:161–9.
60. Voets T, Nilius B, Hoefs S, van der Kemp AWCM, Droogmans G, Bindels RJM, Hoenderop JGJ. TRPM6 forms the Mg2+ influx channel involved in intestinal and renal Mg2+ absorption. J Biol Chem. 2004;279:19–25. 61. Gallo RL, Hooper LV. Epithelial antimicrobial defence of the skin and
intestine. Nat Rev Immunol. 2012;12:503–16.
62. Davison JM, Lickwar CR, Song L, Breton G, Crawford GE, Rawls JF. Microbiota regulate intestinal epithelial gene expression by suppressing the transcription factor hepatocyte nuclear factor 4 alpha. Genome Res. 2017;27:1195–1206. 63. O'Neill CA, Monteleone G, McLaughlin JT, Paus R. The gut-skin axis in health
and disease: a paradigm with therapeutic implications. BioEssays. 2016;38: 1167–76.
64. Mudge JM, Harrow J. Creating reference gene annotation for the mouse C57BL6/J genome assembly. Mamm Genome. 2015;26:366–78. 65. Liao Y, Smyth GK, Shi W. The Subread aligner: fast, accurate and scalable
read mapping by seed-and-vote. Nucleic Acids Res. 2013;41:e108. 66. Durinck S, Spellman PT, Birney E, Huber W. Mapping identifiers for the
integration of genomic datasets with the R/Bioconductor package biomaRt. Nat Protoc. 2009;4:1184–91.
67. Ashburner M, Ball CA, Blake JA, Botstein D, Butler H, Cherry JM, Davis AP, Dolinski K, Dwight SS, Eppig JT, Harris MA, Hill DP, Issel-Tarver L, Kasarskis A, Lewis S, Matese JC, Richardson JE, Ringwald M, Rubin GM, Sherlock G. Gene ontology: tool for the unification of biology. The gene ontology consortium. Nat Genet. 2000;25:25–9.
68. Kanehisa M, Goto S. KEGG: kyoto encyclopedia of genes and genomes. Nucleic Acids Res. 2000;28:27–30.
69. Young MD, Wakefield MJ, Smyth GK, Oshlack A. Gene ontology analysis for RNA-seq: accounting for selection bias. Genome Biol. 2010;11:R14. 70. Supek F, Bosnjak M, Skunca N, Smuc T. REVIGO summarizes and visualizes
long lists of gene ontology terms. PLoS One. 2011;6:e21800.
• We accept pre-submission inquiries
• Our selector tool helps you to find the most relevant journal • We provide round the clock customer support
• Convenient online submission • Thorough peer review
• Inclusion in PubMed and all major indexing services • Maximum visibility for your research
Submit your manuscript at www.biomedcentral.com/submit