R E S E A R C H
Open Access
Single cell isolation process with laser
induced forward transfer
Yu Deng
1,2,3, Philippe Renaud
2, Zhongning Guo
1, Zhigang Huang
1*and Ying Chen
3Abstract
Background:A viable single cell is crucial for studies of single cell biology. In this paper, laser-induced forward transfer (LIFT) was used to isolate individual cell with a closed chamber designed to avoid contamination and maintain humidity. Hela cells were used to study the impact of laser pulse energy, laser spot size, sacrificed layer thickness and working distance. The size distribution, number and proliferation ratio of separated cells were statistically evaluated. Glycerol was used to increase the viscosity of the medium and alginate were introduced to soften the landing process.
Results:The role of laser pulse energy, the spot size and the thickness of titanium in energy absorption in LIFT process was theoretically analyzed with Lambert-Beer and a thermal conductive model. After comprehensive analysis, mechanical damage was found to be the dominant factor affecting the size and proliferation ratio of the isolated cells. An orthogonal experiment was conducted, and the optimal conditions were determined as: laser pulse energy, 9μJ; spot size, 60μm; thickness of titanium, 12 nm; working distance, 700μm;, glycerol, 2% and alginate depth, greater than 1μm. With these conditions, along with continuous incubation, a single cell could be transferred by the LIFT with one shot, with limited effect on cell size and viability.
Conclusion:LIFT conducted in a closed chamber under optimized condition is a promising method for reliably
isolating single cells.
Keywords:Single cell isolation, Laser induced forward transfer, Proliferation, Mechanical stress, Cell damage
Background
Single cell technology is used to study the growth, me-tabolism and apoptosis of individual cells [1]. Recently, it has been widely applied to studies of personalized medicine [2], oncology [3], cardiovascular disease [4], fertility [5] and AIDS [6]. The most crucial step for the implementation of single cell technology is isolation of a single cell.
Currently, there are several methods developed to separate an individual cell, including fluorescence acti-vated cell sorting (FACS), magnetic actiacti-vated cell sorting (MACS), limiting dilution, micro-chips, laser capture micro-dissection (LCM) and optical tweezers. In FACS or MACS, the cells are labeled with fluorescence activated antigen or protein. The cells are then separated by either fluidic or magnetic force, respectively. However, these
methods cannot be used to obtain single cells of rare sample or those lacking a known antigen [7–9]. Limiting dilution is the most used method of single cell separation. The cell suspension is repeatedly dilute into new medium untill the density of the cells is below 10 cells/mL. Although it is simple and easy to use, but the target cell cannot be traced since there is no signal feedback [10], and its ran-domness limits its applications [11, 12]. With the develop-ment of micro-fluidics, various chips have been prototyped to capture single cells basing on the certain properties of the cells, such as size [13, 14], rigidity [15] and metabolic function [16, 17]. However, these chips cannot be used to isolate cells that lack clearly distinguishing characteristics [18]. In LCM, cell samples are fixed on a glass slide with either ethanol or formalin. The laser burns out the neigh-bor cells but keeps the target ones for further research [19]. Because the cells are fixed, the isolated cells with LCM are not viable and cannot be cloned [20]. Optical tweezers, which were originally developed to manipulate micro parti-cles, have recently been introduced to manipulate single * Correspondence:[email protected]
1School of Electromechanical Engineering, Guangdong University of
Technology, Guangzhou 510006, China
Full list of author information is available at the end of the article
cells from channel to a culture well [21], but the manual process is inefficient and complicated [22].
Laser-induced forward transfer (LIFT) utilizes the laser with high energy to partially evaporate the materials coated on the glass, resulting in high pressure to reject the remaining material to a work piece, namely the receptor [23]. Recently, LIFT has been developed for biological materials [24, 25], and has been successfully used to transfer stem cells in tissue engineering [26], to obtain a vein with fully function [27], and to deposit DNA or protein on bio-chips [28]. In these applications, a random number of cells were transferred within each laser shot since there is no specific requirement for the number of deposited cells.
In this paper, we use LIFT to isolate single Hela cell. To prevent lossing of viability from contamination and drying, a chamber was developed with polydimethylsi-loxane (PDMS) to seal LIFT environment and regulate humidity. The impact of critical parameters of the process, including laser pulse energy, spot size, working distance and the thickness of the scarified layer was inves-tigated comprehensive. In addition, glycerol was added to the medium and a layer of alginate is deposited on the receptor to optimize the LIFT process. The modifications successfully protected the cells from damage.
Methods
Laser induced forward transfer setup
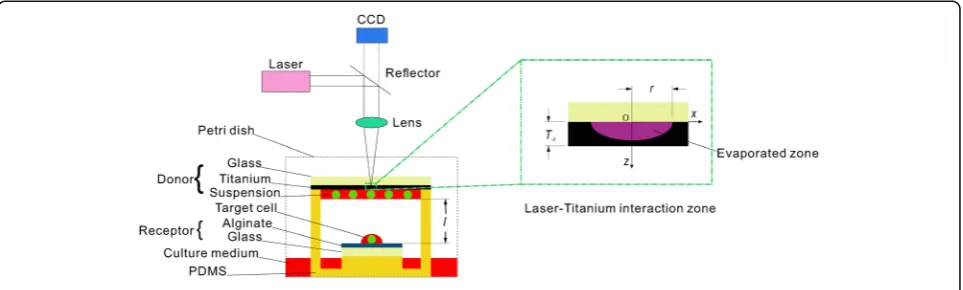
As illustrated in Fig. 1, the YAG laser pulse (Dawa 200, Beamtech, China) with pulse width of 5 ns and wavelength of 532 nm passed through a reflector (RBK-25-3-532, Wavelength Opto-electronic, Singapore) and convex lens (LFS-1-150-ET2, Wavelength Opto-electronic, Singapore), and then was focused on the scarificed layer (Titanium) coated on the bottom side of a transparent glass (JGS-1 quartz, In Situ Technology, China). The heat generated by the laser pulse melted the sacrificed layer resulting in shock wave. The target cell in the suspension deposited underneath the sacrificed layer was propelled by the shock
wave from the donor (including the glass, sacrificed layer and cell suspension) to the receptor, which was coated with alginate (W201502-Sigma Aldrich, Switzerland). The cells were not able to survive from the process in an open separation environment because of contamination and dry. Therefore, a small chamber made of PDMS was de-signed to seal the processing environment. The chamber had channels filled with culture medium. And the cham-ber will located in a culture dish that was filled with culture medium as well. After 2 h of incubation, the humidity inside the chamber reached 100%. Therefore the sealed chamber maintained humidity at the same time as it protect the cells from from contamination and dry.
Cell preparation
HELA cell (CCL-2™, ATCC, USA) was chosen as the object for its easy-culture, uniformly growth and fast proliferation. Accordingly the cell culture medium is made of 89 vol% DMEM (Dulbecco’s Modified Eagle’s Medium, D5796-Sigma Aldrich, Switzerland), 10 vol% FBS (Fetal Bovine Serum, F6765- Sigma Aldrich, Switzerland) and 1 vol% P/S (Penicillin-Streptomycin, P4333-Sigma Aldrich, Switzerland). The cells were grown at 5% CO2, 100% humidity and 37 °C for 5 days untill cells covered over 90% of the flask (3151-Corning, USA). The culture medium was replaced with 4 mL of PBS (Phosphate buffered saline, P5368- Sigma Aldrich, Switzerland) to wash away the dead cells. After disper-sing the PBS, 2 mL of trypsin (T4049- Sigma Aldrich) was added to the flask for 3 min to detach the cells. The cells were transferred to a 15 mL tube filled with 8 mL of culture medium and centrifuged. After removing the medium from the tube, fresh medium was added to resuspend cells to a concentration of 103cells/mL.
Donor preparation
The base of the donor was quartz glass that was care-fully cleaned with Piranha cleaning process. After dry-ing overnight at 80 °C, the sacrificed layer, a layer of
Titanium with defined thickness, was deposited on quartz by sputtering coating. The coated quartz was cleaned with ethanol and, rinsed with sterilized water, and then was sterilized with UV light. The prepared cell suspension with cell density of 103 cells/mL was coated on the surface of the Titanium by spin coating process. The depth of the suspension was no more than 30μm, ensuring a single layer of cells.
Receptor preparation
Quart was also used as receptor for its great transparency that makes it suitable for microscope. It was sterilized as for the donor, and then Alginate solution (2 wt% in culture medium) was stacked on the quartz by spin coating process.
Viability analysis of cell after LIFT
The cells were stained with trypanblue (T8154-Sigma Aldrich) to distinguish the dead cells from live ones. The trypan blue was diluted 10 times in PBS, then transferred to the flask of cultured cells. After 30 min, the tryan blue solution was removed and the cell samples were observed under the microscope immedi-ately. The transferred cells were stained after culturing for 1 to 5 days to calculate the proliferation ratio each day.
Experimental conditions
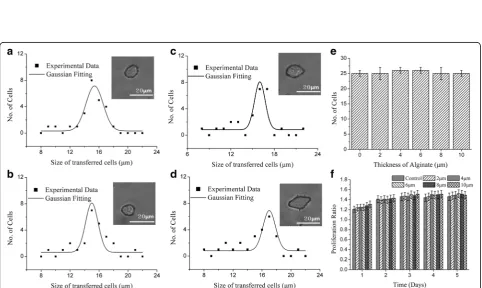
For each of the parameters listed in Table 1, 25 laser pulses were released in order to transfer cells, and all of those cells isolated were cultured immediately in the incubator. The number and the diameter of these cells separated within 25 laser shots were evaluated immedi-ately after the LIFT process to analyze the impact of the key parameters of the process on single cell separation. Ideally, the number should be 25, and the diameter distribution should peak at 20μm as indicated in Fig. 2 All isolated cells were continuously cultured to verify
the viability of cells post LIFT process. The formula for calculating the proliferation ratio was:
ηProliferation ¼NNi
i−1 ð
1Þ
whereNiindicates the number of the cells in the culture chamber and i= 1, 2, 3, 4, 5 is the number of days in culture days, andN0is the number of those isolated cells
attached to the culture surface in 4 h.
The damage to isolated cells in LIFT process, and their ability to recover were analyzed by comparing their size and proliferation ratio to those of untreated cells (Fig. 2).
Results
Effect of laser pulse energy
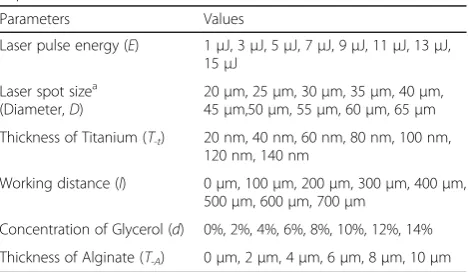
Figure 3a-d presents the cell size distribution when pulse energy was set at 1μJ, 5μJ, 9μJ, and 13μJ, respectively. After fitting a Gaussian model to the data, the distribu-tion with pulse energy 1 μJ peaked at 18 μm, 5 μJ at 16μm, 9 μJ at 15μm, and 13 μJ at 14μm. For 25 laser shots with 1μJ, about 10 cells were transferred, resulting in s success rate for single cell isolation of about 40%. When the pulse energy was set at at 9μJ, 25 cells were separated with success rate of 100%. Above 11 μJ, the number of isolated cell increased above 25 (Fig. 3e). The proliferation ratios of cells are shown in Fig. 3f. Com-pared with the control cells, all cells isolated by LIFT suffered from a low proliferation ratio on the first day. The proliferation decreased as the pulse energy increased. At 15 μJ the proliferation was less than 1, meaning there were some cell lost the viability. However, the cells recovered their ability to proliferate over time. Only 1 day was needed to recover for samples processed with 1μJ but samples processed with pulse energy above 11μJ could not proliferate untill the second day. It was noted that all cell samples had recovered within 4 days. With the target of obtaining a viable single cell, the laser pulse energy should not be set above11μJ.
Effect of laser spot size
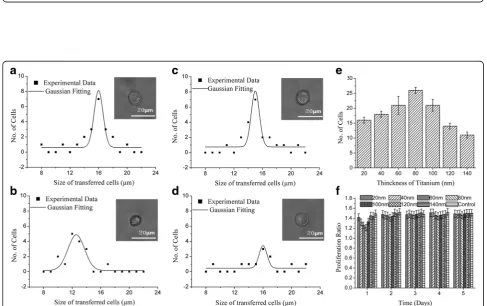
Laser spot size is another important parameter for single cell isolation. Cell size decreased as the spot size was re-duced. For instance, Fig. 4a-e presents that samples processed with spot size of 20 μm, 30 μm, 40 μm and 50 μm distributed with peaks at 11μm, 12 μm, 15 μm and 17 μm, respectively. Meanwhile, the number of the cells isolated from donors decreased from 30 at a spot size of 20μm to 22 at 40μm, and then to 21 at 45μm. As spot size was increased beyond 45 μm, the number of isolated cells increased, 35 at 65 μm as shown in (Fig. 4e). Under these process conditions, the optimal spot sizes were 40 μm and 45μm, which, the single cell
Table 1The experimental arrangement of single factor
experiments
Parameters Values
Laser pulse energy (E) 1μJ, 3μJ, 5μJ, 7μJ, 9μJ, 11μJ, 13μJ, 15μJ
Laser spot sizea (Diameter,D)
20μm, 25μm, 30μm, 35μm, 40μm, 45μm,50μm, 55μm, 60μm, 65μm
Thickness of Titanium (T-t) 20 nm, 40 nm, 60 nm, 80 nm, 100 nm, 120 nm, 140 nm
Working distance (l) 0μm, 100μm, 200μm, 300μm, 400μm, 500μm, 600μm, 700μm
Concentration of Glycerol (d) 0%, 2%, 4%, 6%, 8%, 10%, 12%, 14%
Thickness of Alginate (T-A) 0μm, 2μm, 4μm, 6μm, 8μm, 10μm
a
isolation proceeded with 100% success. Furthermore, presented in Fig. 4f ), on the first day, the proliferation ratio was less than 1 when the spot size was less than 30μm The samples transferred at 20μm or 25 μm spot size started to proliferate on the third day whereas the samples transferred at higher spot size had already fully recovered. The optimal spot size was set between 40 and 45μm.
Effect of the thickness of titanium
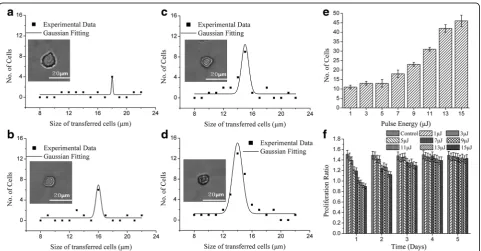
Next, the effect of titanium thickness on LIFT results was examined. The peaks of the cell-size distribution first deceased from 16μm at 20 nm to 12μm at 60 nm of titanium, then rose up to 16μm at 140 nm, as shown in Fig. 5a-d. The number of cells peaked when the titan-ium thickness was 80 nm as indicated in Fig. 5e. Although not every laser shot propel a cell successfully, multiple Fig. 2The size distribution and proliferation ration of the untreated cella) the size distribution of the sample cells,b) the proliferation ratio of the sample cells
Fig. 4The impact of spot size. The representative size distribution of the transferred cell at laser pulse energy of 7μJ, thickness of Titanium of 60 nm, working distance of 500μm and no modification in culture medium and receptor with different laser spot size of:a20μm,b30μm,c40μm and
d50μm,ethe bar diagram of laser spot size as function of the number of transferred cells within 25 laser shots andfthe proliferation ratio change of the of isolated cells with various spot size within 5 days
Fig. 5The impact of the thickness of titanium. The representative size distribution of the transferred cell at laser pulse energy of 7μJ, spot size of 40μm, working distance of 500μm and no modification in culture medium and receptor coated with various thick Titanium:a20 nm,b60 nm,
cells were never transferred within one pulse. The prolifer-ation ratio, was the lowest (1.2) 80 nm titanium, and increased at thinner or thicker titanium settings as shown in Fig. 5f. After 2 days post-transfer culture, the cells had recovered. 80 nm titanium thickness resulted in lowest day-1 proliferation ratio, but a high rate of success for separating individual cells with a single laser shot. There-fore, 80 nm is the optimized thickness for titanium this process.
Effect of working distance
We next investigate the working distance, the gap between donor and receptor. As the working distance was varied, the peak cell-size distribution after LIFT changed from 18μm to 16μm, as illustrated in Fig. 6a-d but there were 47 cells propelled with a working distance of 100 μm; However, as the working distance inceased above 100μm, there was a dramatic drop to 20 cells at 500μm as shown in Fig. 6e). Once the working distance was set to over 500 μm, the number of cells separated was stabilized around 20. After 1 day in culture, the proliferation ratio varied from 1.01 to 1.34. However, after 2 days in culture the cells seemed to recover from the damage. To optimize cell number, size, and proliferation, the working distance should be set in the range of 500 to 600μm.
Effect of concentration of glycerol
To optimize droplet formation, glycerol was added into cul-ture medium to increase the viscosity of the medium. Figure 6a-d shows that cell size shrank from 16 μm for medium lacking glycerol to 15μm, 14μm, then to 12μm for those isolated in medium with 4, 8 and 12% glycerol, re-spectively. Glycerol had no effect on the number of cell separated as illustrated in Fig. 7e. In contrast, glycerol dra-matically influenced cell proliferation. Figure 7f showed that the cells did not grow on day-1 after LIFT isolation process with glycerol and lower concentration of glycerol, cells re-covered the ability to proliferate. But the cells processed with higher concentration of glycerol took more time to recover. Cells transferred with 10 and 12% glycerol in cul-ture medium survived the process but did not recover the ability to proliferation after 5 days. Therefore, the glycerol concentration should not be above 10% and it should be ideally set between 2–4%.
Effect of alginate
Alginate (2% w/v) was used to form a soft layer on the receptor to ensure that the isolated cell had a soft landing. The peak cell-size shifted from 14 μm to 17 μm as the thickness of alginate increase from 0 μm (control) to 10 μm (Fig. 8a-d). Alginate thickness did not affect the
Fig. 7The impact of glycerol concentration. The representative size distribution of the transferred cell at laser pulse energy of 7μJ, spot size of 40μm, thickness of Titanium of 60 nm working distance of 500μm and no modification in receptor but adding to culture medium with different concentration of glycerol:acontrol (0%),b4%,c8% andd12%,ethe bar diagram of glycerol concentration as function of the number of transferred cells within 25 laser shots andfthe proliferation ratio change of the of isolated cells with various glycerol concentration within 5 days incubating with no modified culture medium
Fig. 8The impact of Alginate. The representative size distribution of the transferred cell at laser pulse energy of 7μJ, spot size of 40μm, thickness of Titanium of 60 nm working distance of 500μm, no modification in culture medium but alginate layer coated on the receptor with different height:a
number of isolated cells as expressed in Fig. 8e. But Fig. 8f indicated that alginate did appear to increase the prolifera-tion ratio slightly, in a dose-dependent manner. However, there was minimal increase in the proliferation ratio be-tween 2μm and 10μm alginate. Therefore, we concluded that 2μm of alginate is sufficient to protect the cells from damage.
Orthogonal optimization
To optimize LIFT single cell isolation, we measured cell number, peak size and proliferation ratio in an or-thogonal experiment including three-levels and four-factors (Table 2). As in the single factor experiment, 25 laser pulses were used to propel cells. All cells were counted and measured. Cell size were graphed and fitted with a Gaussian curve to obtain the peak cell diameter. The proliferation ratios were calculated after 3 days of culturing post transfer. The experiment was conducted three times for each condition.
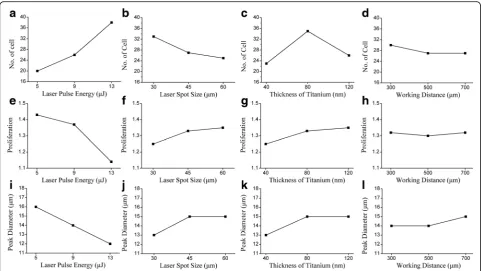
Figure 9 summarizes the results of this orthogonal experi-ment. The number of cells increased as pulse energy in-creased, spot size decreased or working distance decreased. The number of cells peaked as titanium thickness neared 80 nm. The peak diameter of the separated cells, as well as their proliferation ratio, increased as the pulse energy
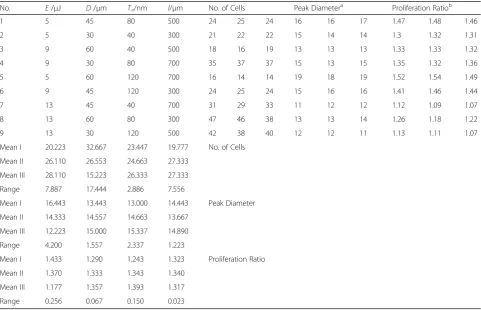
decreases and as the spot size, titanium thickness or work-ing distance increased. Because the goal was to isolate an individual cell with maximum size and maximum prolifera-tion ratio, the optimal LIFT process parameters should be laser pulse energy, 9μJ; spot size, 60μm; thickness of titan-ium, 12 nm; working distance, 700 μm. Spot size is the most critical factor for cell number, with a range of 17.444, followed by pulse energy (range = 7.887), thickness of titan-ium (range = 2.886) and working distance (range = 7.556). Pulse energy is the predominant contributor to the peak diameter with a range of 4.200, followed by thickness of titanium (range = 2.337), spot size (range = 1.557) and working distance (range = 1.223). For proliferation ratio, pulse energy had the largest effect (range = 0.256), followed by thickness of titanium (range = 0.150), spot size (range = 0.067) and working distance (range = 0.023).
Discussion
Mechanism of single cell isolation
For the LIFT process, the only energy source is the laser pulse. The laser interacts with the sacrificed layer (as shown in Fig. 1, the laser-titanium interaction zone), which trans-forms the energy of laser to thermal effect leading to evap-oration of Titanium. Based on thermal conductive theory,
Table 2The result of orthogonal experiment
No. E/μJ D/μm T-t/nm l/μm No. of Cells Peak Diametera Proliferation Ratiob
1 5 45 80 500 24 25 24 16 16 17 1.47 1.48 1.46
2 5 30 40 300 21 22 22 15 14 14 1.3 1.32 1.31
3 9 60 40 500 18 16 19 13 13 13 1.33 1.33 1.32
4 9 30 80 700 35 37 37 15 13 15 1.35 1.32 1.36
5 5 60 120 700 16 14 14 19 18 19 1.52 1.54 1.49
6 9 45 120 300 24 25 24 15 16 16 1.41 1.46 1.44
7 13 45 40 700 31 29 33 11 12 12 1.12 1.09 1.07
8 13 60 80 300 47 46 38 13 13 14 1.26 1.18 1.22
9 13 30 120 500 42 38 40 12 12 11 1.13 1.11 1.07
Mean I 20.223 32.667 23.447 19.777 No. of Cells
Mean II 26.110 26.553 24.663 27.333
Mean III 28.110 15.223 26.333 27.333
Range 7.887 17.444 2.886 7.556
Mean I 16.443 13.443 13.000 14.443 Peak Diameter
Mean II 14.333 14.557 14.663 13.667
Mean III 12.223 15.000 15.337 14.890
Range 4.200 1.557 2.337 1.223
Mean I 1.433 1.290 1.243 1.323 Proliferation Ratio
Mean II 1.370 1.333 1.343 1.340
Mean III 1.177 1.357 1.393 1.317
Range 0.256 0.067 0.150 0.023
a
The size distribution of transferred cell was fitting with Gaussian curve, and the peak size was defined as peak diameter with unit ofμm
b
the critical depth of melted titanium could be calculated as
D¼ Imð Þz;t
πr2ρCpΔTþLf þm0Lv ð2Þ
where Im(z,t) indicates the laser energy absorbed by titanium, z the position along the depth direction,tthe time, r the radius of laser spot size, ρ the density of titanium, Cp the specific heat capacity of titanium, ΔT the boiling point of titanium,Lffusion heat,m' evaporation ratio, andLvthe evaporation heat.
According to Lambert-Beer [29], the transformed energy can be described as following
Imð Þ ¼z;t αkð1−RÞIlð Þx;t expð−αzÞ ð3Þ
whereαis the absorptance,kthe transmission efficiency,
Rthe reflectivity, and the laser used in the process was an Gaussian spot, so the laser intensity distribution could be described asIl(x,t),
Ilð Þ ¼x;t I0⋅exp −x 2
r2
⋅exp −3:5ðt−τÞ 2
τ2
!
ð4Þ
where x depicts the position in radius direction, I0 the
amplitude of intensity,τthe pulse width of laser.
From Eq. (2), the depth of ablated titanium significantly depends on the laser fluency as well as the thermal prop-erties of titanium. Depending on laser, titanium within the critical depth would be evaporated to generate the cavita-tion. Because of differences in critical depth and the thick-ness of Titanium, there were four types of morphologies observed on the titanium after LIFT: bump, broken bump, spot with shrunken edge and spot completely ablated as shown in Fig. 10. The four different morphologies mainly resulted from the hybrid functions of high pressure and the constrain of titanium itself. At a given laser fluency, the thicker the titanium results in stronger constrain is, and the morphology changes from a spot completely ablated to a spot with shrank edge, then to a and lastly to a bump. As seen in Eqs. (3) and (4), increasing pulse energy and decreasing the spot size increase laser fluency.
Increasing the Oh number, which mainly dependes on the property of the medium, helps to constrain the titan-ium deformation and suppress the jet formation. We number is influenced by velocity and medium. By vary-ing theOhnumber and theWenumber, the jet behavior changes from a bump with titanium partially ablated, to a bump with titanium completely ablated, to a well de-fined jet, then to a less control one as explained in Fig. 11. In consequence, a single target cell, may either not be transferred, may be isolated precisely, or may be separated along with other cells within one laser pulse, as presented in Fig. 12.
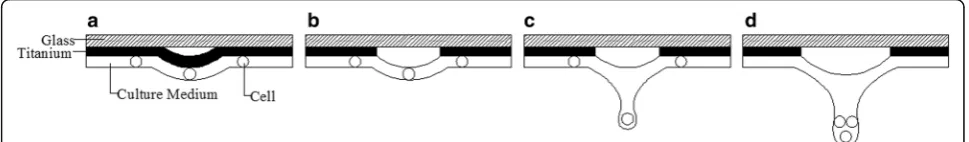
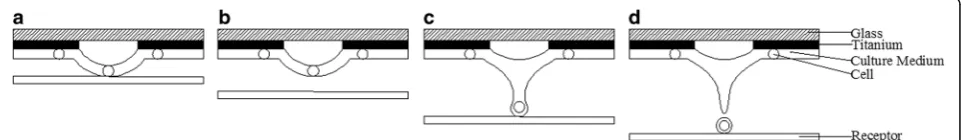
The working distance had a limited effect on jet for-mation but it influenced the process as presented in Fig. 13. With the receptor close to the donor, cells could be transferred to the receptor even when there was not jet formed, as in Fig. 10a-b. But in this case, the number of separated cells was unpredictable because the cells were separated by the capillary force. However, once the working distance was equal to, or larger than the length of jet generated by cavitation, the cells could be precisely transferred.
When the laser energy was raised from 1μJ to 15μJ, the laser fluency increased from 79.58 mJ/cm2to 1193.69 mJ/ cm2. And the jet formation changed through four types, a bump with titanium partially ablated, a bump with titanium completely melted, a narrow jet, and a less controlled jet. Accordingly, the number of cell rose up from 11 to 47.
Conversely, in Fig. 4, the spot size was enlarged from 20 to 65μm, the laser fluency decreased from 557.06 mJ/cm2 to 52.74 mJ/cm2, causing the jet to narrow down and even
disappear, so there were fewer cells isolated successfully. The spot size also changed theOhnumber andWe num-ber by shifting the value ofR. With a larger spot, a less control jet could form, with which multiple cells were transferred. Generally, increasing the radius of spot size decreased the number of cells separated with 25 laser shots but eventually the number increased again.
The function of the titanium was to convert laser energy to drive the cell separation. But in LIFT process, the thickness of titanium should be carefully selected. On one hand, Titanium functionally absorbs the laser energy to induce cavitation. On the other hand, if not completely evaporated by laser, the remained titanium constrains the expansion of the cavitation and consums the energy to deform. When the titanium is thin (20 nm), The LIFT process is not efficient enough to to isolate cell successfully. In contrast, when the titanium is thick (140 nm), the laser fluency was fully transformed into the process which was 139.26 mJ/cm2, but some of the energy was wasted in deformation as shown in Fig. 10a and b).
The critical distance within which the jet was stably formed was 500 μm, so the working distance should be set at least 500 μm to ensure that only a target cell is isolated with each laser pulse.
Modifying the culture medium with glycerol mainly varied the properties of the medium, especially the viscosity. As the glycerol concentration increased, more energy were consumed by viscous dissipation during jetting. As a result, adding glycerol increased the chance that a cell was not transferred with each shot.
Fig. 10The morphologies of titanium layer after LIFT process,aa bump under pulse energy of 2μJ, spot size of 45μm, titanium with thickness of 160 nm,ba broken bump under pulse energy of 2μJ, spot size of 45μm, titanium with thickness of 100 nm,ca spot with shrank edge under pulse energy of 2μJ, spot size of 45μm, titanium with thickness of 80 nm,da spot completely ablated under pulse energy of 2μJ, spot size of 45μm, titanium with thickness of 40 nm
The cell damage
The cells suffered from three types of damage during the LIFT isolation process : mechanical, thermal and UV light. The damage can be recognized by a reduced cell radius or a reduced the proliferation ratio.
The mechanical damage results from three pro-cesses. During cavitation bubble expansion, the iso-lated cell was subject to the high pressure. Duringthe jetting process, the cell is rapidly accelerated to a high velocityThen the cell decelerates when it lands on the receptor. Young reported that the velocity can be high as 1000 m/s and the acceleration/deceleration can be 105-109 g [31, 32]. The pressure, acceleration and de-celeration lead to high shear stress on the cell, which shrinks the cell and slows the proliferation. Since the pressure is generated from energy absorbed by titan-ium, the laser fluency, the thickness of titanium and the working distance are the main factors affecting the shear stress on the cell.
In addition, the interaction between the laser and the titanium produces heat. The heat injures cells by deacti-vating the enzymes, denaturing protein and carbonization [33]. In fact, the thermal damage is dependent on both temperature and exposure time. Within several nanoseconds, the thermal effect zone was found to be dominated by Fourier heat conduction meaning that the zone was confined to within several micrometers depth. With a 30μm thick suspension, the thermal injury of separated cell was negligible in this study.
UV lights can kill cells effectively, but in LIFT with a sacrificed layer, the UV light was constrained to the
interface between the glass and titanium. Even with a 20 nm thick layer of titanium will absorbed, only 40% of laser passed through the sacrificed layer. Using Lambert-Beer law, with less than 4 μJ of pulse energy and 45 μm of spot size, 60% of laser radiation was absorbed by titanium, even with only a 20 nm thick layer. For the other 40% of laser fluency, the damage threshold depth in culture medium was estimated to be about 2 μm meaning that only 7% of the suspen-sion was affected by UV light, resulting in minimal in-jury. So in this paper, UV light damage was negligible also.
Among mechanical, thermal and UV damage, under the conditions used in our experiments, mechanical stress was the dominant factor contributing to cell dam-age. Since the pressure resulted from energy absorbed by titanium, the laser fluency and the thickness of titanium were the main factors affecting the shear stress acting on the cell. As shown in Figs. 3 and 4, increasing the laser pulse energy, reducing the laser spot diameter helped to reduce the cell size, as well as to slow down the prolifer-ation of the transferred target cell. Increasing Titanium thickness from 20 nm to 80 nm decreased the cell size and the proliferation because the titanium contributes on the conversion of energy to cavitation. When it was greater 80 nm, the cells shrank less and the proliferation ratio increased. As previously mentioned, the working distance had a limited impact on jetting, but decreasing the length of path that the isolated cell had to pass through decreased the mechanical damage to the cell, leading to larger cells with higher viability., Glycerol is used to increase the viscosity to form a better droplet Fig. 12Cell (s) transferred with one laser pulse,aan individual cell transferred with a bump jet or narrow jet,btwo cells transferred with wild jet generated by pulse energy of 4μJ,cthree cells transferred with a wild jet generated by pulse energy of 8μJ
but itchanged the osmotic pressure of the medium, making the cell smaller, and reducing the viability. Coating alginate on the receptor was a method to pro-vide enough cushion to reduce the deceleration during the landing process.
Conclusions
We have analyzed the effects of laser pulse energy, laser spot size, thickness of Titanium, working distance, glycerol and alginate on the number, size and proliferation ratio of cells isolated with LIFT. It revealed that the laser fluency and the thickness of titanium were the main factors affecting the viability of isolated cell because they influence the energy introduced into the process. Providing a suffi-cient work distances and increasing the viscosity with gly-cerol helped to control the cell transfer and coating with alginate was employed to soften the cell landing.
The optimal settings for obtaining a viable cellare: laser pulse energy, 9μJ; spot size, 60μm; thickness of titanium, 12 nm; working distance, 700 μm, 2–4% glycerol in culture medium and alginate thickness greater than 1μm.
Abbreviations
DMEM:Dulbecco’s modified eagle’s medium; FACS: Fluorescence activate cell sorting; FBS: Fetal bovine serum; LCM: Laser capture micro-dissection; LIFT: Laser induced forward transfer; MACS: Magnetic activate cell sorting; P/S: Penicillin-streptomycin; PBS: Phosphate buffered saline;
PDMS: Polydimethylsiloxane
Acknowledgements
The discussion with Arnaud Bertsch and Yufei Ren of École Polytechnique Fédérale de Lausanne, and clean room technologies support from Joffrey Pernollet of CMI inÉcole Polytechnique Fédérale de Lausanne.
Funding
The study was partially supported by National Natural Science Foundation of China (51175091) and the project of young innovative talents in university of Guangdong (2015KQNCX027).
Availability of data and materials
All data generated or analysed during this study are included in this published article [and its supplementary information files].
Authors’contributions
YD took charge of lab work, data analysis and participated in the design of the study and drafted the manuscript; PR participated in the design of the study; ZG participated on statistical analyses, coordinated the study and helped to draft the manuscript; ZH took part in lab work, sequence alignment and revised the manuscript. YC conducted the data analysis and partially involved in design of the study. All authors read and approved the final manuscript.
Competing interests
The authors declare that they have no competing interests.
Consent for publication
Not applicable.
Ethics approval and consent to participate
Not applicable.
Author details
1School of Electromechanical Engineering, Guangdong University of
Technology, Guangzhou 510006, China.2Microsystems Laboratory, STI-LMIS, Ecole Polytechnique Federale de Lausanne, CH-1015 Lausanne, Switzerland.
3Guangdong Provincial Key Laboratory of Functional Soft Condensed Matter,
Guangzhou 510006, China.
Received: 22 September 2016 Accepted: 26 December 2016
References
1. Hoppe PS, Coutu DL, Schroeder T. Single-cell technologies sharpen up mammalian stem cell research. Nat Cell Biol. 2014;16(10):919–27. 2. Bhagat AAS, Bow H, Hou HW, Tan SJ, Han J, Lim CT. Microfluidics for cell
separation. Med Biol Eng Comput. 2010;48(10):999–1014. 3. Leslie M. The power of one. Science. 2011;331(6013):24–6.
4. Altelaar AM, Heck AJ. Trends in ultrasensitive proteomics. Curr Opin Chem Biol. 2012;16(1):206–13. doi:10.1016/j.cbpa.2011.12.011.
5. Giorgetti A, Montserrat N, Aasen T, Gonzalez F, Rodríguez-Pizà I, Vassena R, Raya A, Boué S, Barrero MJ, Corbella BA, Torrabadella M. Generation of induced pluripotent stem cells from human cord blood using OCT4 and SOX2. Cell Stem Cell. 2009;5(4):353.
6. Levine JH, Lin Y, Elowitz MB. Functional roles of pulsing in genetic circuits. Science. 2013;342(6163):1193–200.
7. Sanchez A, Golding I. Genetic determinants and cellular constraints in noisy gene expression. Science. 2013;342(6163):1188–93.
8. Toli D, Buttigieg D, Blanchard S, Lemonnier T, d’Incamps BL, Bellouze S, Baillat G, Bohl D, Haase G. Modeling amyotrophic lateral sclerosis in pure human iPSc-derived motor neurons isolated by a novel FACS double selection technique. Neurobiol Dis. 2015;82:269–80.
9. Plouffe BD, Murthy SK, Lewis LH. Fundamentals and application of magnetic particles in cell isolation and enrichment: a review. Rep Prog Phys. 2014;78(1):016601.
10. Wilson A, Chen WF, Scollay R, Shortman K. Semi-automated limit-dilution assay and clonal expansion of all T-cell precursors of cytotoxic lymphocytes. J Immunol Methods. 1982;52(3):283–306.
11. Cheshier SH, Morrison SJ, Liao X, Weissman IL. In vivo proliferation and cell cycle kinetics of long-term self-renewing hematopoietic stem cells. Proc Natl Acad Sci. 1999;96(6):3120–5.
12. Chen WF, Wilson A, Scollay R, Shortman K. Limit-dilution assay and clonal expansion of all T cells capable of proliferation. J Immunol Methods. 1982;52(3):307–22.
13. Kim H, Lee S, Lee JH, Kim J. Integration of a microfluidic chip with a size-based cell bandpass filter for reliable isolation of single cells. Lab Chip. 2015;15(21):4128–32.
14. Khamenehfar A, Beischlag TV, Russell PJ, Ling MTP, Nelson C, Li PCH. Label-free isolation of a prostate cancer cell among blood cells and the single-cell measurement of drug accumulation using an integrated microfluidic chip. Biomicrofluidics. 2015;9(6):064104.
15. Huang WC, Burnouf PA, Su YC, Chen BM, Chuang KH, Lee CW, Wei PK, Cheng TL, Roffler SR. Engineering chimeric receptors to investigate the size-and rigidity-dependent interaction of PEGylated nanoparticles with cells. ACS Nano. 2016;10(1):648–62.
16. Meister A, Gabi M, Behr P, Studer P, Vörös J, Niedermann P, Bitterli J, Polesel-Maris J, Liley M, Heinzelmann H, Zambelli T. FluidFM: combining atomic force microscopy and nanofluidics in a universal liquid delivery system for single cell applications and beyond. Nano Lett. 2009;9(6): 2501–7.
17. Guillaume-Gentil O, Zambelli T, Vorholt JA. Isolation of single mammalian cells from adherent cultures by fluidic force microscopy. Lab Chip. 2014;14(2):402–14. 18. Palima D, Aabo T, Bañas A and Glückstad J. Cell handling, sorting, and
viability. PHOTONICS: Scientific Foundations, Technology and Applications, IV,2015; 197–237.
19. Espina V, Wulfkuhle JD, Calvert VS, VanMeter A, Zhou W, Coukos G, Geho DH, Petricoin EF, Liotta LA. Laser-capture microdissection. Nat Protoc. 2006;1(2):586–603.
20. Kolijn K, Leenders GJ. Comparison of RNA extraction kits and histological stains for laser capture microdissected prostate tissue. BMC Res Notes. 2016;9(1):1. 21. Probst C, Grünberger A, Wiechert W, Kohlheyer D. Microfluidic growth
chambers with optical tweezers for full spatial single-cell control and analysis of evolving microbes. J Microbiol Methods. 2013;95(3):470–6. 22. Liberale C, Cojoc G, Bragheri F, Minzioni P, Perozziello G, La Rocca R, Ferrara
23. Nagel M, et al. Aryltriazene photopolymers for UV‐laser applications: improved synthesis and photodecomposition study. Macromol Chem Phys. 2007;208(3):277–86.
24. Ma H, Mismar W, Wang Y, Small DW, Ras M, Allbritton NL, Sims CE and Venugopalan V. Impact of release dynamics of laser-irradiated polymer micropallets on the viability of selected adherent cells. J Royal Soc Interface. 2011; doi:rsif20110691.
25. Chatzipetrou M, Tsekenis G, Tsouti V, Chatzandroulis S, Zergioti I. Biosensors by means of the laser induced forward transfer technique. Appl Surf Sci. 2013;278:250–4.
26. Nguyen AK, Narayan RJ. Liquid-Phase Laser Induced Forward Transfer for Complex Organic Inks and Tissue Engineering. Ann Biomed Eng. 2017;45(1): 84–99.
27. Ovsianikov A, Gruene M, Pflaum M, Koch L, Maiorana F, Wilhelmi M, Haverich A, Chichkov B. Laser printing of cells into 3D scaffolds. Biofabrication. 2010;2(1):014104.
28. Serra P, Colina M, Fernández-Pradas JM, Sevilla L, Morenza JL. Preparation of functional DNA microarrays through laser-induced forward transfer. Appl Phys Lett. 2004;85(9):1639–41.
29. Zhigilei LV, Garrison BJ. Mechanisms of laser ablation from molecular dynamics simulations: dependence on the initial temperature and pulse duration. Appl Phys A. 1999;69(1):S75–80.
30. Zhang Z, Xiong R, Mei R, Huang Y, Chrisey DB. Time-resolved imaging study of jetting dynamics during laser printing of viscoelastic alginate solutions. Langmuir. 2015;31(23):6447–56.
31. Barron JA, Young HD, Dlott DD, Darfler MM, Krizman DB, Ringeisen BR. Printing of protein microarrays via a capillary‐free fluid jetting mechanism. Proteomics. 2005;5(16):4138–44.
32. Lin Y, Huang Y, Wang G, Tzeng TRJ, Chrisey DB. Effect of laser fluence on yeast cell viability in laser-assisted cell transfer. J Appl Phys. 2009;106(4):043106. 33. Åkerfelt M, Morimoto RI, Sistonen L. Heat shock factors: integrators of cell
stress, development and lifespan. Nat Rev Mol Cell Biol. 2010;11(8):545–55.
• We accept pre-submission inquiries
• Our selector tool helps you to find the most relevant journal
• We provide round the clock customer support
• Convenient online submission
• Thorough peer review
• Inclusion in PubMed and all major indexing services
• Maximum visibility for your research
Submit your manuscript at www.biomedcentral.com/submit