Evaluation of an automated
thresholding algorithm for the quantification
of paraspinal muscle composition from MRI
images
Maryse Fortin
1,2, Mona Omidyeganeh
1,2, Michele Crites Battié
3, Omair Ahmad
2and Hassan Rivaz
1,2*Abstract
Background: The imaging assessment of paraspinal muscle morphology and fatty infiltration has gained considerable attention in the past decades, with reports sug-gesting an association between muscle degenerative changes and low back pain (LBP). To date, qualitative and quantitative approaches have been used to assess paraspinal muscle composition. Though highly reliable, manual thresholding techniques are time consuming and not always feasible in a clinical setting. The tedious and rater-depend-ent nature of such manual thresholding techniques provides the impetus for the development of automated or semi-automated segmentation methods. The purpose of the present study was to develop and evaluate an automated thresholding algo-rithm for the assessment of paraspinal muscle composition. The reliability and validity of the muscle measurements using the new automated thresholding algorithm were investigated through repeated measurements and comparison with measurements from an established, highly reliable manual thresholding technique.
Methods: Magnetic resonance images of 30 patients with LBP were randomly selected cohort of patients participating in a project on commonly diagnosed lumbar pathologies in patients attending spine surgeon clinics. A series of T2-weighted MR images were used to train the algorithm; preprocessing techniques including adap-tive histogram equalization method image adjustment scheme were used to enhance the quality and contrast of the images. All muscle measurements were repeated twice using a manual thresholding technique and the novel automated thresholding algorithm, from axial T2-weigthed images, at least 5 days apart. The rater was blinded to all earlier measurements. Inter-method agreement and intra-rater reliability for each measurement method were assessed. The study did not received external funding and the authors have no disclosures.
Results: There was excellent agreement between the two methods with inter-method reliability coefficients (intraclass correlation coefficients) varying from 0.79 to 0.99. Bland and Altman plots further confirmed the agreement between the two methods. Intra-rater reliability and standard error of measurements were comparable between methods, with reliability coefficient varying between 0.95 and 0.99 for the manual thresholding and 0.97–0.99 for the automated algorithm.
Open Access
© The Author(s) 2017. This article is distributed under the terms of the Creative Commons Attribution 4.0 International License (http://creativecommons.org/licenses/by/4.0/), which permits unrestricted use, distribution, and reproduction in any medium, provided you give appropriate credit to the original author(s) and the source, provide a link to the Creative Commons license, and indicate if changes were made. The Creative Commons Public Domain Dedication waiver ( http://creativecommons.org/publicdo-main/zero/1.0/) applies to the data made available in this article, unless otherwise stated.
RESEARCH
*Correspondence: [email protected] 2 Department of Electrical Engineering, Engineering, Computer Science and Visual Arts Integrated Complex, Concordia University, 1515 Ste-Catherine W. Street, Montreal, QC H3G 2W1, Canada
Conclusion: The proposed automated thresholding algorithm to assess paraspinal muscle size and composition measurements was highly reliable, with excellent agree-ment with the reference manual thresholding method.
Keywords: Multifidus, Erector spinae, Paraspinal muscle, Fatty infiltration, Magnetic resonance imaging, Automated algorithm
Background
Imaging assessment of paraspinal muscle morphology and fatty infiltration has attracted considerable attention over recent decades, with reports suggesting an asso-ciation between muscle degenerative changes (e.g. atrophy, asymmetry, fatty infiltration) and low back pain (LBP) [1–7]. However, there remain inconsistencies in the litera-ture related, in part, to variations in imaging modalities used, such as magnetic reso-nance imaging (MRI), ultrasound and computed tomography (CT), and measurement protocols.
The purpose of the present study was to develop and evaluate an automated threshold-ing algorithm for the assessment of paraspinal muscle composition. The reliability and validity of the muscle measurements using the new automated thresholding algorithm were investigated through repeated measurements and comparison with measurements from an established, highly reliable manual thresholding technique [11].
Methods
Sample of lumbar MRI
A sample of 30 patients (11 female and 19 male) was randomly selected from a cohort of patients participating in Genodisc, a European research consortium project on com-monly diagnosed lumbar pathologies in patients attending spine surgeon clinics. All patients included in this study received a diagnosis of disc herniation, spinal stenosis, spondylolisthesis, or nonspecific LBP. Patients were excluded if they were below 18 or over 60 years of age, had a contract agent allergy, had reduced renal function, were not able to undergo MRI acquisition, or had a tumor, infection, spinal fracture, rheumatoid arthritis or were pregnant. All participants completed a consent form acknowledging that their data will be used for research purposes.
The MRI protocol included a routine T2-weighted turbo spin echo sequence for both axial and sagittal images acquired with a Siemens Avanto 1.5T MRI system (Siemens AG, Erlangen, Germany) (axial T2 parameters included repetition time = 4000, echo time = 113 and slice thickness = 3 mm).
Automated thresholding algorithm
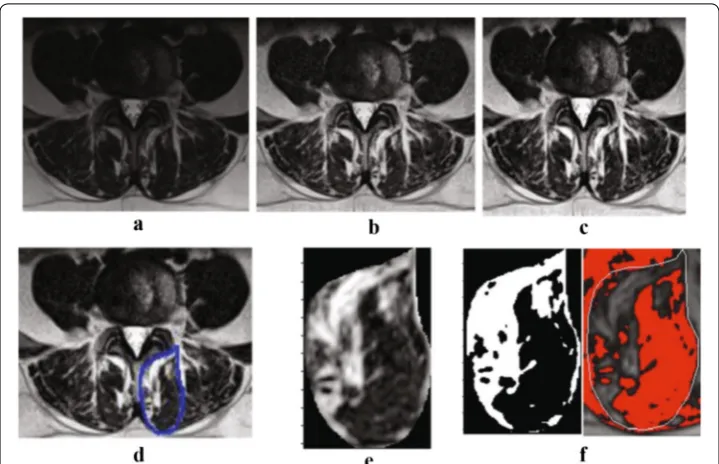
Initially, a series of T2-weighted MR images from two patients were used to train the algorithm. Muscle measurements were then automatically calculated by the algo-rithm, which involves a series of steps, once the muscle of interest has been manually segmented. First, a preprocessing technique was applied to each MR image to enhance the quality and the contrast of the images. This preprocessing step includes an adaptive histogram equalization method and image adjustment scheme. The adaptive histogram equalization algorithm was employed to balance the grayscale level at each point of the image. We have used contrast limited adaptive histogram equalization (CLAHE) algo-rithm [19]. In this algorithm the histogram equalization is applied on small rectangles of the image instead of the whole image. It changes the histogram of each rectangle to a uniform distribution. A bilinear interpolation method was also applied to avoid the formation of artificially stimulated boundaries. Then, the image adjustment scheme was utilized to improve the contrast of the image. This modifies the contrast of the image so that only a small fraction (1%) of the image is saturated as low (dark) and high (bright) intensities [20, 21], providing a high contrast MR image (Fig. 1). These preprocessing steps were applied to reduce the inhomogeneity artifacts. Since our method increase the image contrast locally, the thresholding step was minimally affected by this noise.
which will represent the area of fat and muscle tissue. As the MRI images used for this study were of high quality, the Otsu thresholding technique was adequate for our experi-ments. While the preprocessing steps to enhance the contrast of the image (as described above) provided a high contrast image and Otsu thresholding method segments the image with accuracy compatible with the manual segmentation. The algorithm was implemented in MATLAB (Mathworks, Natick, MA, USA).
Muscle measurements
All muscle measurements were acquired by one of the investigators (MF), who has more than 6 years of experience in quantitative MRI muscle assessment. Quantita-tive measurements of the multifidus and erector spinae muscles were obtained from axial T2-weighted images at mid-disk for L4–L5 and L5–S1 for every subject. This image sequence was selected as it is routinely obtained in lumbosacral MRI examina-tion and has been widely used to assess paraspinal muscle composiexamina-tion. The two lev-els were selected because most lumbar pathologies and muscle morphological changes occur at L4–L5 and L5–S1. The paraspinal muscle measurements of interest for this study included: the total cross-sectional area (CSA), the functional cross-sectional area (FCSA), representing the area of pure muscle mass (excluding fatty infiltration) and the area occupied by fat, and the fat percentage.
This thresholding technique has been shown to be highly reliable and is described in detail elsewhere [11]. Once the first set of measurements with ImageJ was completed, the rater was blinded to the results and the same MRI slices were then assessed using the automated algorithm and MATLAB software (version R2015b), a minimum of 5 days after the first measurements were completed. For this method, the rater manually seg-mented the CSA of the muscle of interest on each slice, and the thresholding algorithm automatically calculated the muscle CSA, the fat CSA and the muscle fat percentage. All muscle measurements were obtained four times by the same rater, twice using the manual thresholding method and twice using the automated thresholding algorithm.
Statistical analysis
Descriptive statistics, such as means and standard deviations, were calculated for each muscle measurement of interest. The ICC(2,1) was calculated to determine the intra-rater reliability of measurement using the manual thresholding technique and auto-mated algorithm, as well as the inter-method reliability using a two-way random-effects model and absolute agreement. The ICCs were interpreted using the following criteria, as suggested by Portney and Watkins: 0.00–0.49 = poor, 0.50–74 = moderate, and 0.75– 1.0 = excellent [24]. Method agreement between the measurements acquired using the manual thresholding technique and the automated algorithm was also evaluated using the 95% limits of agreement, as suggested by Bland and Altman [25, 26]. The standard error of measurement (SEM) was calculated to provide an estimate of the expected error related to a particular measurement in the same units as the initial measurement (SEM = S√(1 − rxx), where S = standard deviation of the test, and rxx = reliability of the test). Results were analyzed according to the spinal level and muscle investigated. The statistical analysis was performed using Statistical Package for the Social Sciences ver-sion 23.0 (SPSS Inc, Chicago, Illinois).
Results
Inter‑method reliability of muscle measurements using the manual thresholding technique and automated algorithm
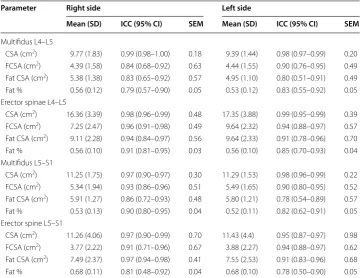
The results for the inter-method correlation (ICC), SEM values, and descriptive statistics (mean ± SD) for the right and left side of the multifidus and erector spinae are pre-sented in Table 1. The inter-method reliability was analyzed by comparing the first set of measurements collected with each method. The ICCs for all of the different muscle com-position measurements, regardless of the muscle analyzed, side or spinal level, showed excellent agreement and varied between 0.79 and 0.99. The SEM was also comparable for the different muscle measurements, muscle analyzed, side and spinal level.
Inter‑method agreement
show good agreement between the manual thresholding technique and automated algo-rithm and no systematic bias; the distribution of the scores around the mean approxi-mates zero and is spread evenly and randomly above and below the line. A histogram of the difference scores was also prepared for every measurement parameter, and all his-tograms followed a normal distribution. As such, because the error is normally distrib-uted, we can observe that about 95% of the points are between the limits of agreement (noted by the dashed lines on the plots) for each measure. The width of the limits of agreement is also small.
Intra‑rater reliability of muscle measurements using the manual thresholding technique and automated algorithm
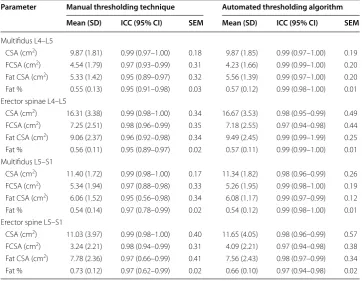
The intrarater reliability (ICC), SEM values, and descriptive statistics (mean ± SD) related to the manual thresholding technique and automated algorithm for the right multifidus and erector spinae muscles at L4–L5 and L5–S1 are presented in Table 2. The results of the left side were virtually equivalent and are not presented. The ICCs for the intrarater reliability across both spinal levels for the manual thresholding technique ranged from 0.95 to 0.99 and 0.97 to 0.99 for the automated algorithm. The ICCs for the fat CSA and fat percentage measurements tended to be slightly lower for the manual thresholding technique, in comparison to the automated algorithm. The SEM associated
Table 1 Inter-method reliability indexes between the manual thresholding technique and automated thresholding algorithm for the right and left multifidus and erector spinae muscles at L4–L5 and L5–S1
ICC intra-class correlation coefficient, CI confidence interval, SEM standard error of measurement, CSA cross-sectional area,
FCSA functional cross-sectional area
Parameter Right side Left side
Mean (SD) ICC (95% CI) SEM Mean (SD) ICC (95% CI) SEM
Multifidus L4–L5
CSA (cm2) 9.77 (1.83) 0.99 (0.98–1.00) 0.18 9.39 (1.44) 0.98 (0.97–0.99) 0.20
FCSA (cm2) 4.39 (1.58) 0.84 (0.68–0.92) 0.63 4.44 (1.55) 0.90 (0.76–0.95) 0.49
Fat CSA (cm2) 5.38 (1.38) 0.83 (0.65–0.92) 0.57 4.95 (1.10) 0.80 (0.51–0.91) 0.49
Fat % 0.56 (0.12) 0.79 (0.57–0.90) 0.05 0.53 (0.12) 0.83 (0.55–0.92) 0.05 Erector spinae L4–L5
CSA (cm2) 16.36 (3.39) 0.98 (0.96–0.99) 0.48 17.35 (3.88) 0.99 (0.95–0.99) 0.39
FCSA (cm2) 7.25 (2.47) 0.96 (0.91–0.98) 0.49 9.64 (2.32) 0.94 (0.88–0.97) 0.57
Fat CSA (cm2) 9.11 (2.28) 0.94 (0.84–0.97) 0.56 9.64 (2.33) 0.91 (0.78–0.96) 0.70
Fat % 0.56 (0.10) 0.91 (0.81–0.95) 0.03 0.56 (0.10) 0.85 (0.70–0.93) 0.04 Multifidus L5–S1
CSA (cm2) 11.25 (1.75) 0.97 (0.90–0.97) 0.30 11.29 (1.53) 0.98 (0.96–0.99) 0.22
FCSA (cm2) 5.34 (1.94) 0.93 (0.86–0.96) 0.51 5.49 (1.65) 0.90 (0.80–0.95) 0.52
Fat CSA (cm2) 5.91 (1.27) 0.86 (0.72–0.93) 0.48 5.80 (1.21) 0.78 (0.54–0.89) 0.57
Fat % 0.53 (0.13) 0.90 (0.80–0.95) 0.04 0.52 (0.11) 0.82 (0.62–0.91) 0.05 Erector spine L5–S1
CSA (cm2) 11.26 (4.06) 0.97 (0.90–0.99) 0.70 11.43 (4.4) 0.95 (0.87–0.97) 0.98
FCSA (cm2) 3.77 (2.22) 0.91 (0.71–0.96) 0.67 3.88 (2.27) 0.94 (0.88–0.97) 0.62
Fat CSA (cm2) 7.49 (2.37) 0.97 (0.94–0.98) 0.41 7.55 (2.53) 0.91 (0.83–0.96) 0.68
Fig. 2 Bland–Altman 95% limits of agreement plots for the FCSA measurements of the multifidus and erec-tor spinae muscles at L4–L5 and L5–S1
with each muscle parameter was generally smaller for the measurements obtained with the automated algorithm as compared to the manual thresholding technique.
Discussion
We have presented a new automated thresholding algorithm for quantitative paraspinal muscle composition assessment based on MR images. The primary goal of this study was to examine to validity of the measurements obtained with the novel automated olding algorithm, as compared to those obtained with an established manual thresh-olding segmentation method. The correlation and agreement of the related paraspinal muscle measurements suggest that the two methods yield comparable measurements, with excellent reliability when applied to a clinically relevant population. These find-ings are further supported by the Bland and Altman limits of agreement that indicate inter-method agreement is within an acceptable range to use either of the two methods interchangeably. Moreover, the similar intra-rater reliability and SEMs indicate that the proposed automated algorithm produces results consistent with the reference manual thresholding method.
While paraspinal muscle composition (including the quantification measures of this study) have already been applied and investigated in different low back pain popula-tion, literature findings are controversial with regards to their predictive clinical value. Currently, a wide range of methodologies and modalities are used to assess paraspinal
Table 2 Intra-rater reliability indexes for the manual thresholding technique and auto-mated thresholding algorithm for the right multifidus and erector spinae muscles at L4–L5 and L5–S1
ICC intra-class correlation coefficient, CI confidence interval, SEM standard error of measurement, CSA cross-sectional area,
FCSA functional cross-sectional area
Parameter Manual thresholding technique Automated thresholding algorithm
Mean (SD) ICC (95% CI) SEM Mean (SD) ICC (95% CI) SEM
Multifidus L4–L5
CSA (cm2) 9.87 (1.81) 0.99 (0.97–1.00) 0.18 9.87 (1.85) 0.99 (0.97–1.00) 0.19
FCSA (cm2) 4.54 (1.79) 0.97 (0.93–0.99) 0.31 4.23 (1.66) 0.99 (0.99–1.00) 0.20
Fat CSA (cm2) 5.33 (1.42) 0.95 (0.89–0.97) 0.32 5.56 (1.39) 0.99 (0.97–1.00) 0.20
Fat % 0.55 (0.13) 0.95 (0.91–0.98) 0.03 0.57 (0.12) 0.99 (0.98–1.00) 0.01 Erector spinae L4–L5
CSA (cm2) 16.31 (3.38) 0.99 (0.98–1.00) 0.34 16.67 (3.53) 0.98 (0.95–0.99) 0.49
FCSA (cm2) 7.25 (2.51) 0.98 (0.96–0.99) 0.35 7.18 (2.55) 0.97 (0.94–0.98) 0.44
Fat CSA (cm2) 9.06 (2.37) 0.96 (0.92–0.98) 0.34 9.49 (2.45) 0.99 (0.99–1.99) 0.25
Fat % 0.56 (0.11) 0.95 (0.89–0.97) 0.02 0.57 (0.11) 0.99 (0.99–1.00) 0.01 Multifidus L5–S1
CSA (cm2) 11.40 (1.72) 0.99 (0.98–1.00) 0.17 11.34 (1.82) 0.98 (0.96–0.99) 0.26
FCSA (cm2) 5.34 (1.94) 0.97 (0.88–0.98) 0.33 5.26 (1.95) 0.99 (0.98–1.00) 0.19
Fat CSA (cm2) 6.06 (1.52) 0.95 (0.56–0.98) 0.34 6.08 (1.17) 0.99 (0.97–0.99) 0.12
Fat % 0.54 (0.14) 0.97 (0.78–0.99) 0.02 0.54 (0.12) 0.99 (0.98–1.00) 0.01 Erector spine L5–S1
CSA (cm2) 11.03 (3.97) 0.99 (0.98–1.00) 0.40 11.65 (4.05) 0.98 (0.96–0.99) 0.57
FCSA (cm2) 3.24 (2.21) 0.98 (0.94–0.99) 0.31 4.09 (2.21) 0.97 (0.94–0.98) 0.38
Fat CSA (cm2) 7.78 (2.36) 0.97 (0.66–0.99) 0.41 7.56 (2.43) 0.98 (0.97–0.99) 0.34
muscle composition, which is likely related to the inconsistent findings. The developed algorithm greatly simplifies the complexity and tedious aspect of MR imaging assess-ment of paraspinal muscle composition and provides a standardized procedure. More specifically, the results obtained using our novel automated thresholding algorithm are particularly encouraging and promising for the following reasons: (1) the threshold selection to identify the pixels representing muscle and fat tissue is completely auto-mated, and thus easily reproducible, time efficient and rater-independent, while the manual thresholding method requires a trained rater to identify the threshold upper and lower limits, (2) the method is not affected by anatomical or image quality differ-ences between subjects, (3) the automated algorithm can be readily used and applied to various datasets to produce robust measurements of paraspinal muscle composition. Furthermore, as could be expected with a largely automated system, the intra-rater reli-ability was slightly higher when the measurements were obtained with the automated thresholding algorithm, as compared to the manual method. Overall, the SEMs of the related paraspinal muscle composition parameters were also smaller when measure-ments were acquired with the automated algorithm. These findings reflect the higher precision of the algorithm in reproducing measurements. Furthermore, we suspect that spatial resolution of the MR images had a minimal impact on the accuracy of the segmentation. As the MR images used were selected from a database of patients that underwent a routine lumbosacral examination, the MRI parameters were very similar for each patients and the image quality and spatial resolution (e.g. pixel size between 1 and 2 mm) was representative of the images that would be used clinically. Lastly, although recent studies have demonstrated that MR imaging techniques such as fat-signal fraction using Dixon and multi-echo imaging (mostly in liver) may be superior in quantifying aqueous tissue [27, 28], the necessity of such techniques for the assess-ment of skeletal muscle remains to be established, as literature findings are inconsist-ent [29–31]. Moreover, such imaging sequences are rarely used clinically in patients with chronic LBP. On the opposite, T2-weigthed images are routinely obtained when performing lumbosacral MRI examination, have been widely used to assess paraspinal muscle composition in previous studies, and have been shown to provide reliable and accurate calculation of muscle composition when compared to muscle biopsy meas-urements and spectroscopy [30, 31]. As a result, we believe that the imaging sequence and methodological approach used in this study to quantify muscle composition was adequate.
also been found to have excellent inter-software agreement when measurements were obtained with ImageJ and OsiriX [11].
Study limitations
While accurate and time-efficient, certain difficulties remain with the described auto-mated thresholding algorithm. First, a selected muscle ROI cannot be corrected once it is fully traced. Thus, if the rater is not satisfied with the selected ROI, the segmentation needs to be repeated. We are currently working on the coding of the algorithm to modify this feature, and allow for the correction of the ROI. Second, the algorithm operates on a single slice (jpeg format), thus slice location is important and volume measurements (cm3 or mm3) cannot be directly obtained. Finally, for accurate measurement of muscle CSA and fat area, the rater needs to indicate the MRI matrix size in the algorithm com-mand prior to performing any measurement.
Conclusion
In conclusion, we present an automated thresholding algorithm for the assessment and quantification of paraspinal muscle size and composition using axial T2-weighted MR images. The ROI of interest is first manually segmented and then the algorithm com-putes the muscle total CSA, fat CSA and fat percentage automatically. This novel algo-rithm was validated against paraspinal muscle composition measurements obtained using an established, highly reliable manual thresholding method, on a sample repre-senting a clinically relevant population with chronic LBP. Our results suggest that the paraspinal muscle composition measurements obtained with the automated algorithm are in excellent agreement with those produced by the manual thresholding technique, with slightly higher intra-rater reliability indices and smaller SEMs. The proposed auto-mated thresholding algorithm greatly simplifies the complexity and tedious aspects of MR imaging assessment of paraspinal muscle composition, and provides a standard-ized procedure to facilitate replication and comparison among related studies. We have made the algorithm available online at (https://users.encs.concordia.ca/~hrivaz/codes/ SemiAutomatic_Thresholding/) for public academic use. The software is accompanied with a video that provides usage instructions. This algorithm can be implemented on the MRI devices to apply the automatic thresholding directly on the scans. While the development of an automated approach for the ROI selection is challenging, due to the variation in the paraspinal muscle morphology between individuals and spinal levels, we are currently working on the development of an atlas-based automated segmentation algorithm.
Abbreviations
LBP: low back pain; ICC: intra-class correlation coefficient; SEM: standard error of measurement; MRI: magnetic resonance imaging; CT: computed tomography; GCS: goutallier classification scale; CSA: sectional area; FCSA: functional cross-sectional area; ROI: region of interest.
Authors’ contributions
Author details
1 PERFORM Centre, Concordia University, 7200 Sherbrooke W, Montreal, QC H4B 1R6, Canada. 2 Department of Electrical Engineering, Engineering, Computer Science and Visual Arts Integrated Complex, Concordia University, 1515 Ste-Cath-erine W. Street, Montreal, QC H3G 2W1, Canada. 3 Common Spinal Disorders Research Group, Faculty of Rehabilitation Medicine University of Alberta, 8205-114 Street, Edmonton, AB T6G 2G4, Canada.
Acknowledgements
The authors wish to acknowledge the European Union Community’s Seventh Framework Programme, GENODSIC pro-ject, for the supportive recruitment of the study sample.
Competing interests
The authors declare that they have no competing interests. Availability of data and materials
The datasets generated and analysed during the current study are available from the corresponding author on reason-able request.
Ethics approval and consent to participate
The Genodisc project has been reviewed and approved by the IOW, Portsmouth and South East Hampshire Research Ethics Committee. This study has also been approved by the Research Ethics Boards of the University of Alberta. Funding
This research was funded by NSERC Discovery Grants RGPIN-2015-04136 and RGPIN-2016-06623.
Publisher’s Note
Springer Nature remains neutral with regard to jurisdictional claims in published maps and institutional affiliations.
Received: 18 October 2016 Accepted: 13 May 2017
References
1. Beneck GJ, Kulig K. Multifidus atrophy is localized and bilateral in active persons with chronic unilateral low back pain. Arch Phys Med Rehabil. 2012;93(2):300–6.
2. Hides J, Gilmore C, Stanton W, Bohlscheid E. Multifidus size and symmetry among chronic LBP and healthy asymp-tomatic subjects. Man Ther. 2008;13(1):43–9.
3. Kulig K, Scheid AR, Beauregard R, Popovich JM Jr, Beneck GJ, Colletti PM. Multifidus morphology in persons sched-uled for single-level lumbar microdiscectomy: qualitative and quantitative assessment with anatomical correlates. Am J Phys Med Rehabil. 2009;88(5):355–61.
4. Mengiardi B, Schmid MR, Boos N, et al. Fat content of lumbar paraspinal muscles in patients with chronic low back pain and in asymptomatic volunteers: quantification with MR spectroscopy. Radiology. 2006;240(3):786–92. 5. Ploumis A, Michailidis N, Christodoulou P, Kalaitzoglou I, Gouvas G, Beris A. Ipsilateral atrophy of paraspinal
and psoas muscle in unilateral back pain patients with monosegmental degenerative disc disease. Br J Radiol. 1004;2011(84):709–13.
6. Barker KL, Shamley DR, Jackson D. Changes in the cross-sectional area of multifidus and psoas in patients with unilateral back pain: the relationship to pain and disability. Spine. 2004;29(22):E515–9.
7. Fortin M, Macedo L. Multifidus and paraspinal muscle group cross-sectional areas of patients with low back pain and control patients: a systematic review with a focus on blinding. Phys Ther. 2013;93(11):1540–50.
8. Battaglia PJ, Maeda Y, Welk A, Hough B, Kettner N. Reliability of the goutallier classification in quantifying mus-cle fatty degeneration in the lumbar multifidus using magnetic resonance imaging. J Manip Physiol Ther. 2014;37(3):190–7.
9. Kader DF, Wardlaw D, Smith FW. Correlation between the MRI changes in the lumbar multifidus muscles and leg pain. Clin Radiol. 2000;55(2):145–9.
10. Kjaer P, Bendix T, Sorensen JS, Korsholm L, Leboeuf-Yde C. Are MRI-defined fat infiltrations in the multifidus muscles associated with low back pain? BMC Med. 2007;5:2.
11. Fortin M, Battie MC. Quantitative paraspinal muscle measurements: inter-software reliability and agreement using OsiriX and ImageJ. Phys Ther. 2012;92(6):853–64.
12. Ranson C, Burnett A, O’Sullivan P, Batt M, Kerslake R. The lumbar paraspinal muscle morphometry of fast bowlers in cricket. Clin J Sport Med. 2008;18(1):31–7.
13. Mikheev A, Nevsky G, Govindan S, Grossman R, Rusinek H. Fully automatic segmentation of the brain from T1-weighted MRI using bridge burner algorithm. J Magn Reson Imaging. 2008;27(6):1235–41.
14. Kazemifar S, Drozd JJ, Rajakumar N, Borrie MJ, Bartha R. Automated algorithm to measure changes in medial tempo-ral lobe volume in alzheimer disease. J Neurosci Methods. 2014;227:35–46.
15. Farmaki C, Mavrigiannakis K, Marias K, Zervakis M, Sakkalis V. Assessment of automated brain structures segmenta-tion based on the mean-shift algorithm: Applicasegmenta-tion in brain tumor. In: Proceeding IEEE EMBS Reg 8 Internasegmenta-tional Conference Information Technology Applications in Biomedicine ITAB. 2010.
• We accept pre-submission inquiries
• Our selector tool helps you to find the most relevant journal
• We provide round the clock customer support
• Convenient online submission
• Thorough peer review
• Inclusion in PubMed and all major indexing services
• Maximum visibility for your research
Submit your manuscript at www.biomedcentral.com/submit
Submit your next manuscript to BioMed Central
and we will help you at every step:
17. Orgiu S, Lafortuna CL, Rastelli F, Cadioli M, Falini A, Rizzo G. Automatic muscle and fat segmentation in the thigh from T1-weighted MRI. J Magn Reson Imaging. 2016;43(3):601–10.
18. Antony J, McGuinness K, Welch N, et al. An interactive segmentation tool for quantifying fat in lumbar muscles using axial lumbar-spine MRI. IRBM. 2016;37(1):11–22.
19. Sund T, Møystad A. Sliding window adaptive histogram equalization of intra-oral radiographs: effect on diagnostic quality. Dentomaxillofac Radiol. 2006;35(3):133–8.
20. Jain AK. Fundamentals of digital image processing. Engle wood cliffs: Prentice Hall; 1989.
21. Pisano ED, Cole EB, Hemminger BM, Yaffe MJ, et al. Image processing algorithms for digital mammography: a picto-rial essay. Radiographics. 2000;20(5):1479–91.
22. Otsu N. A threshold selection method from gray-level histograms. IEEE Trans Syst Man Cybern. 1979;9(1):62–6. 23. Zhu N, Wang G, Yang G, Weiming D. A fast 2D Otsu thresholding algorithm based on improved histogram. In:
Pat-tern Recognition, 2009. CCPR 2009. Chinese Conference. p. 1–5.
24. Portney LG, Watkins MP. Foundations of clinical research: applications to practice. Upper Saddle River: Prentice Hall; 2000.
25. Bland JM, Altman DG. Measuring agreement in method comparison studies. Stat Methods Med Res. 1999;8:135–69. 26. Bland JM, Altman D. Statistical method for assessing agreement between two methods of clinical measurement.
Lancet. 1986;1:307–10.
27. Fischer MA, Nanz D, Reiner CS, et al. Diagnostic performance and accuracy of 3-D spoiled gradient-dual-echo MRI with water- and fat-signal separation in liver-fat quantification: comparison to liver biopsy. Invest Radiol. 2010;45:465–70.
28. Hayashi N, Miyati T, Minami T, et al. Quantitative analysis of hepatic fat fraction by single breath-holding MR spectroscopy with T2 correction: phantom and clinical study with histologic assessment. Radiol Phys Technol. 2013;6:219–25.
29. Yoo YH, Kim HS, Lee YH, et al. Comparison of multi-echo dixon methods with volume interpolated breath-hold gradient echo magnetic resonance imaging in fat-signal fraction quantification of paravertebral muscle. Korean J Radiol. 2015;16(5):1086–95.
30. Fisher MA, Nanz D, Shimakawa A, et al. Quantification of muscle fat in patients with low back pain: comparison of multi-echo MR imaging with single-voxel MR spectroscopy. Radiology. 2013;266(2):555–63.
31. Gaeta M, Scribano E, Mileto A, et al. Muscle fat fraction in neuromuscular disorders: dual-echo dual-flip-angle spoiled gradient-recalled MR imaging technique for quantification: a feasibility study. Radiology. 2011;259(2):487–94.
32. Engstrom CM, Fripp J, Jurcak V, Walker DG, Salvado O, Crozier S. Segmentation of the quadratus lumborum muscle using statistical shape modeling. J Magn Reson Imaging. 2011;33(6):1422–9.
33. Danneels LA, Vanderstraeten GG, Cambier DC, Witvrouw EE, De Cuyper HJ. CT imaging of trunk muscles in chronic low back pain patients and healthy control subjects. Eur Spine J. 2000;9(4):266–72.
34. Niemelainen R, Briand M, Battie MC. Substantial asymmetry in paraspinal muscle cross-sectional area in healthy adults questions its value as a marker of low back pain and pathology. Spine. 2011;36(25):2152–7.