www.geosci-model-dev.net/3/679/2010/ doi:10.5194/gmd-3-679-2010
© Author(s) 2010. CC Attribution 3.0 License.
Geoscientific
Model Development
IMOGEN: an intermediate complexity model to evaluate terrestrial
impacts of a changing climate
C. Huntingford1, B. B. B. Booth2, S. Sitch3,*, N. Gedney3, J. A. Lowe4, S. K. Liddicoat2, L. M. Mercado1, M. J. Best3, G. P. Weedon3, R. A. Fisher5,**, M. R. Lomas5, P. Good2, P. Zelazowski6, A. C. Everitt1, A. C. Spessa7, and C. D. Jones2 1Centre for Ecology and Hydrology, Wallingford, OXON, OX10 8BB, UK
2Met Office Hadley Centre, Fitz Roy Road, Exeter, Devon, EX1 3PB, UK
3Joint Centre for Hydro-Meteorological Research, Met Office Hadley Centre, Wallingford, OXON, OX10 8BB, UK 4Reading Unit, Met Office Hadley Centre, Department of Meteorology, University of Reading, Earley Gate, P.O. Box 243, Reading, RG6 6BB, UK
5Department of Animal and Plant Sciences, University of Sheffield, Western Bank, Sheffield, S10 2TN, UK 6Environmental Change Institute, School of Geography and the Environment, Oxford, OX1 3QY, UK
7National Centre for Atmospheric Sciences, Department of Meteorology, University of Reading, Earley Gate, P.O. Box 243, Reading, RG6 6BB, UK
*now at: School of Geography, University of Leeds, Leeds, LS2 9JT, UK
**now at: Earth and Environmental Sciences, Los Alamos National Laboratory, Los Alamos, New Mexico, NM 87545, USA Received: 6 July 2010 – Published in Geosci. Model Dev. Discuss.: 4 August 2010
Revised: 5 November 2010 – Accepted: 9 November 2010 – Published: 29 November 2010
Abstract. We present a computationally efficient modelling system, IMOGEN, designed to undertake global and regional assessment of climate change impacts on the physical and biogeochemical behaviour of the land surface. A pattern-scaling approach to climate change drives a gridded land sur-face and vegetation model MOSES/TRIFFID. The structure allows extrapolation of General Circulation Model (GCM) simulations to different future pathways of greenhouse gases, including rapid first-order assessments of how the land sur-face and associated biogeochemical cycles might change. Evaluation of how new terrestrial process understanding in-fluences such predictions can also be made with relative ease.
1 Introduction
General Circulation Models (GCMs) remain the main tool of climate change research and it is predominantly these mod-els that led the latest Intergovernmental Panel on Climate Change (IPCC) report (IPCC, 2007) to conclude that recent increases in global average temperatures are “very likely”
Correspondence to: C. Huntingford ([email protected])
680 C. Huntingford et al.: IMOGEN: a model to evaluate terrestrial impacts of a changing climate and present, and then for a prescribed emissions scenario
on-wards to year 2100, will typically require 3 months of com-puting time to complete. This is in addition to the often con-siderable time required to spinup the GCM to a pre-industrial state.
The land surface is an integral component of the Earth Sys-tem, including land-atmosphere exchanges of carbon diox-ide, CO2. Such exchanges have a major influence on emis-sion reductions needed to avoid dangerous climate change. The state of the land surface, which itself is affected by climate change (along with other pollutants such as ozone and various land use practises), also has a direct bearing on societal well-being by providing the majority of our food, and influencing water supply and other ecosystem services (e.g. Imhoff et al., 2004; Schr¨oter et al., 2005; Sitch et al., 2007). The potential impact of climate change on agricul-tural yields is an issue starting to receive particular scrutiny (e.g. Lobell et al., 2007). Altered atmospheric aerosols in-fluence the land surface both through climate change and adjusted ratios of surface direct-to-diffuse radiation (Mer-cado et al., 2009). For all these reasons, it is important to have a well developed regional description of the land sur-face and vegetation that captures its expected response to the non-stationary aspects of weather in a changing climate.
The Met Office Hadley Centre land surface model, used in the various configurations of Version 3 of their GCM, con-sists of the description of vegetation competition and dynam-ics by the “Met Office Surface Exchange Scheme” (MOSES; Cox et al., 1998, 1999) and the “Top-down Representation of Interactive Foliage and Flora Including Dynamics” (TRIF-FID; Cox, 2001). Cox et al. (2000) describe MOSES com-bined with the interactive vegetation scheme, TRIFFID, cou-pled to the Hadley Centre GCM and forced by a business-as-usual emissions scenario (IS92a; Houghton et al., 1992). In this fully coupled climate-carbon cycle simulation the land surface was predicted to become a source of carbon diox-ide in to the atmosphere by the middle of the 21st Century. The severity of modelled climate change was sufficient to en-hance both plant and soil respiration rates enough to overtake any beneficial effects of extra plant fertilisation in a CO2 en-riched environment. This feedback is not, however, realised by all models (Friedlingstein et al., 2006) illustrating the im-portance to understand more fully the processes involved. Further, which future changes in atmospheric greenhouse gas concentrations would avoid such a positive feedback? It is to address these and many similar types of question associated with future land surface functioning in a changing climate, that a computationally efficient model has been developed. The model presented here incorporates an analogue of the climatic response of the Hadley Centre GCM and also con-tains the full GCM land surface scheme. Called IMOGEN: “Integrated Model Of Global Effects of climatic aNomalies”, it is a new type of intermediate complexity model. For dif-ferent future pathways in atmospheric greenhouse gas con-centrations, it provides a fast representation of the climatic
response of a GCM to changing radiative forcing, yet with a more complete treatment of land surface processes directly comparable in complexity to those within GCMs.
The IMOGEN system is designed to operate with a range of CO2emission or concentration scenarios (plus pathways in non-CO2atmospheric greenhouse gas concentrations) that have not currently been used to force a GCM, generating re-gional land surface climate impacts assessments. Land sur-face models are currently undergoing radical change as new geochemical cycles are introduced, along with more sophis-ticated descriptions of vegetation competition. IMOGEN also allows for the testing of the effect of enhanced pro-cess representation in land surface models within a modelled changing climate. An earlier version was used to evaluate the uncertainty in the future modelled climate-carbon cycle introduced by alternative Dynamic Global Vegetation Mod-els (DGVMs) to TRIFFID (Sitch et al., 2008). This previous study was an evaluation of how uncertainty in land processes actually translates into significant uncertainties in the future projections of the climate-carbon cycle system and changes to biogeography. Given the large geographical variability in ecosystem response, such detailed spatial impacts anal-ysis would not have been possible using a simpler zero-order climate-carbon cycle model (e.g. Jones et al., 2006). A long-term aim is to incorporate aspects of the Ecosystem Demog-raphy model (Moorcroft et al., 2001; Fisher et al., 2010) into the IMOGEN structure. Hence, IMOGEN fills a gap between full GCM simulations and more illustrative calculations by very fast global “box” models, thus allowing regional impact assessments. An IMOGEN simulation representing, for in-stance, years 1860 (pre-industrial) to 2100 can be completed in a couple of days on a fast single processor.
2 Model components and simulations
2.1 IMOGEN overview
C. Huntingford et al.: IMOGEN: a model to evaluate terrestrial impacts of a changing climate 681
- 19 - - Figures
1
2
Figure 1: A schematic of the different components forming the IMOGEN impacts 3
tool. Abbreviations are as follow: GHG for Greenhouse Gases, T for Temperature 4
and NEP for Net Ecosystem Production. Optionally, non-CO2 atmospheric GHG
5
concentrations can be prescribed. Currently IMOGEN excludes the influence on 6
radiation of varying volcanic and non-volcanic aerosols and also varying solar 7
constant. 8
9
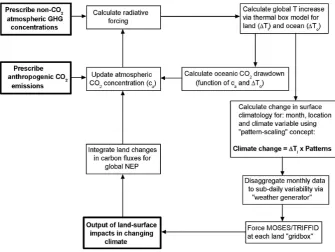
Fig. 1. A schematic of the different components forming the IMOGEN impacts tool. Abbreviations are as follow: GHG for Greenhouse
Gases,T for Temperature and NEP for Net Ecosystem Production. Optionally, non-CO2atmospheric GHG concentrations can be prescribed. Currently IMOGEN excludes the influence on radiation of varying volcanic and non-volcanic aerosols and also varying solar constant.
2004, 2008). Here the complete IMOGEN system available for global impacts modelling is presented.
IMOGEN can operate with a closed global carbon cycle, and thus be forced with CO2emissions. It can explicitly de-rive global atmospheric CO2concentrations at each timestep, modelled as the balance between emissions, areal integra-tion of calculated land-atmospheric fluxes of CO2and a sim-ple description of global oceanic drawdown of CO2. The resulting changes in atmospheric CO2 concentration feed-back on modelled surface climate changes via the energy bal-ance component of the GCM analogue model, and therefore through global land temperature change and regional patterns of climate change. The energy balance component can also account for other climatic drivers, such as non-CO2 green-house gases, where the relationship between the drivers and the radiative forcing is known. For example IMOGEN incor-porates changes in wetland methane emissions due to climate changes, and how these feedback on atmospheric concentra-tions and climate (Gedney et al., 2004). A schematic (Fig. 1) shows the linkages between the different parts of the IMO-GEN model, as described in more detail below.
2.2 “GCM analogue model” details
The GCM that we have attempted to mimic here is HadCM3LC, chosen as this configuration of the Met Office Hadley Centre GCM has nearly identical land surface com-ponents to IMOGEN. This version of the GCM has lower
ocean resolution (“L”) than HadCM3, but a fully interac-tive carbon cycle (“C”). The actual model simulation by HadCM3LC is similar to that described in Cox et al. (2000), except that here it is forced throughout with the CO2-only component of the historical and SRES A2 future emissions scenario (Nakiæenoviæ et al., 2000). Climatological patterns are found by simple regressions against global land temper-ature increase, for each variable of interest, for each month and for each grid point, and all for the period 1860 to 2100. That is, if1Tl(i) (K) is the predicted global land temper-ature increase by yeari, then change in quantityV (i,j,k) (for monthj and spatial position – gridbox –k) is then ap-proximated as pattern (i.e. regression coefficient)XV(j,k) multipled by1Tl(i). (The fitting is actually made against decadal mean values for each month, position and variable.) The variables for which the patterns are derived are 1.5 m temperature, 1.5 m relative humidity, 10 m wind speed, pre-cipitation, downward shortwave radiation, downward long-wave radiation and surface pressure. These are all climato-logical quantities needed to drive the MOSES/TRIFFID land surface model.
682 C. Huntingford et al.: IMOGEN: a model to evaluate terrestrial impacts of a changing climate over ocean, 1To (K), as 1Tl=ν1To. The robustness of
near-constant land-ocean temperature contrast has been an-alyzed by Sutton et al. (2007). Climate feedback parame-ters (λl andλo)are calibrated using GCM data for top of the atmosphere radiative fluxes, mean land and ocean sur-face temperatures, along with an estimate of the radiative forcing modelled by the GCM for the CO2 changes (see Sect. 2.3 of Huntingford and Cox, 2000). This optimal fit to the GCM temperature response is referred to as EBM1. However a second configuration generating a land temper-ature trajectory which was 0.5 K warmer at 2100 than that modelled by the GCM was also undertaken; referred to as EBM2. The fitting parameters of EBM2 were chosen such that the total terrestrial carbon content in IMOGEN during the latter part of the 21st Century has a good match with that predicted by HadCM3LC. The comparison of the land temperature response (1Tl) with the GCM, for both con-figurations of the energy balance component, is shown in Fig. 2. For the optimal fit of HadCM3LC in EBM1, it is found thatλl= 0.493 Wm−2K−1, λo= 1.581 Wm−2K−1, κ= 367 Wm−1K−1andν= 2.02. The “warmer” fit, EBM2, has valuesλl= 0.450 Wm−2K−1,λo= 1.460 Wm−2K−1, but still withκ= 367 Wm−1K−1andν= 2.02. When we express these parameters in terms of the climate sensitivity, i.e. equi-librium global temperature change for a doubling of CO2, then we obtain values of 3.43 K for EBM1 and 3.72 K for EBM2. (As an aside, climate sensitivity is derived from setting1H0to be zero in Eq. (4) of Huntingford and Cox, 2000). Advection1Hais eliminated between their Eqs. (3) and (4), and then for a radiative forcing1Qfor a doubling of atmospheric CO2concentration, along with their Eq. (9), allows1Tl and1Toto be evaluated. Equilibrium climate sensitivity is given by the calculated global mean tempera-ture increase(1−f )1Tl+f 1Towheref is the fraction of Earth covered by ocean.
Calculated mean monthly anomalies in surface climate can be added to either (a) a base climatology, which can be derived from the last years of the “spin-up” phase of a GCM/first years of a transient GCM simulation (and so rep-resenting the GCM depiction of a pre-industrial climate) or (b) an averaged period of a climatology based on global mea-surements (e.g. the Climate Research Unit Global Climate Dataset; see New et al., 1999 and more recent updates). The latter can help to remove any GCM biases in prediction of pre-industrial state. Here, as IMOGEN is presented as emu-lating HadCM3LC, a base climatology derived from the first decade of the historical simulation (years 1860 to 1869 in-clusive) for that model is used. The land surface model in IMOGEN operates at sub-daily timescales (typically hourly) and at present a simple disaggregation scheme is utilised to derive the surface climate (“weather”) at those shorter peri-ods. The control climatology includes fields of diurnal tem-perature range, to which a daily sine wave is fitted, and is then used to perturb the monthly mean calculated tempera-tures to give diurnal variation. This variation is also used
- 20 - 1
Figure 2: A comparison of the global mean land temperature response, ΔTl, from
2
1860 of the two fits of the energy balance component of IMOGEN with the
3
HadCM3LC simulation (continuous line). The EBM1 fit of the energy balance
4
component is shown by the dotted line whilst the EBM2 fit is indicated by the
5
dashed line. The forcing prescribed to the energy balance components of IMOGEN
6
is the CO2 pathway calculated by the HadCM3LC simulation, itself forced with
7
CO2-only component of the SRES A2 emissions profile. The EBM1 fit has an
8
effective climate sensitivity of 3.43 K and the EBM2 fit of 3.72 K.
9
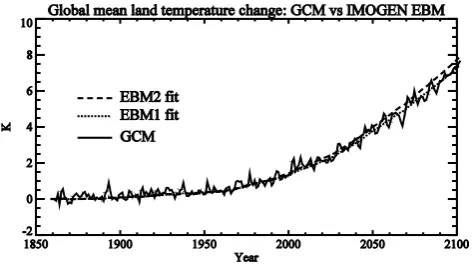
Fig. 2. A comparison of the global mean land temperature response, 1Tl, from 1860 of the two fits of the energy balance component of
IMOGEN with the HadCM3LC simulation (continuous line). The EBM1 fit of the energy balance component is shown by the dotted line whilst the EBM2 fit is indicated by the dashed line. The forc-ing prescribed to the energy balance components of IMOGEN is the CO2pathway calculated by the HadCM3LC simulation, itself
forced with CO2-only component of the SRES A2 emissions
pro-file. The EBM1 fit has an effective climate sensitivity of 3.43 K and the EBM2 fit of 3.72 K.
to alter the monthly mean downward longwave radiation to sub-daily timescales, through a perturbation to its tempera-ture dependence. Shortwave radiation is altered to include diurnal variation, based on sun angle for day of year, time of day and latitude. The mean monthly precipitation is made to occur for short sub-periods of each day, and a temperature cut-off determines whether it falls as rain or snow.
2.3 The MOSES and TRIFFID land surface model, and description of the global carbon cycle
affect estimates of NPP from the beginning of the next 10-day timestep. The carbon content for each PFT is a balance between NPP and temperature-dependent plant respiration (Cox, 2001). Soil carbon is represented as a single “box” un-der all PFTs, and where the carbon content is then a balance between vegetation litterfall and respiration. Soil respiration is modulated by a soil moisture dependence and also aQ10 dependence on temperature (again, please see Cox, 2001).
A typical transient simulation by IMOGEN, up to for ex-ample year 2100, will be initialized from a year such as 1860 and that is considered representative of the pre-industrial pe-riod. Starting the simulation from this year requires an initial state for the vegetation and this is assumed to be in equilib-rium with the pre-industrial climate. To achieve this, an ini-tial “spin-up” period by IMOGEN is performed, where the MOSES/TRIFFID model is repeatedly presented with years of forcing climate data representing the initial climate state. The spin-up simulation is sufficiently long (order of a hun-dred modelled years) that TRIFFID achieves a near equilib-rium prediction of coverages by the different biomes.
IMOGEN contains a depiction of the global carbon cy-cle. This means that carbon dioxide emissions can be pre-scribed, and atmospheric CO2concentration is then a model prognostic. At the end of each modelled year, atmospheric carbon dioxide concentration is adjusted for emissions, and then further adjusted based on the global land-atmosphere and ocean-atmosphere fluxes of CO2for that year (Fig. 1). The land-atmosphere flux is derived, by integrating over all land points for the year, the values of Net Ecosystem Pro-ductivity (NEP). This is integrating gridbox mean values of NPP minus soil respiration. The oceanic draw-down is cal-culated using a single “box” model, as a function of global temperature increase and atmospheric CO2level (Joos et al., 1996; Appendix of Huntingford et al., 2004). This capa-bility of IMOGEN to model land-surface interactions with the full global carbon cycle allowed estimates to be made of “pay-back” times associated with deliberate planting of en-ergy crops (Hughes et al., 2010). The model can also be forced without an interactive carbon cycle, and instead the atmospheric CO2concentrations can be prescribed directly. The effect of non-CO2greenhouse gas concentrations can be prescribed as an additional radiative forcing.
2.4 A case study
After the spin-up phase, in the particular simulations pre-sented here, IMOGEN is forced by prescribed CO2 emis-sions only. These follow historical emisemis-sions to present-day, followed by the CO2component of the SRES A2 emis-sions scenario (as used in the C4MIP study; Friedlingstein et al., 2006). This matches the GCM simulation against which the IMOGEN “patterns” of climate change are cali-brated, and thus its ability to replicate aspects of HadCM3LC may be considered. IMOGEN was run twice using the two
- 21 - - 1
Figure 3: IMOGEN EBM1 and EBM2 calculations (dotted and dashed lines,
2
respectively) of change in total terrestrial carbon (both vegetation and soil, and
3
across all land points except Antarctica) from 1860. Also plotted is the same
4
quantity (continuous line) as predicted by HadCM3LC. As for Figure 2 in all cases,
5
the models are forced by the SRES A2 emissions scenario, but adopting only the
6
carbon dioxide component (i.e. no non-CO2 GHGs).
7
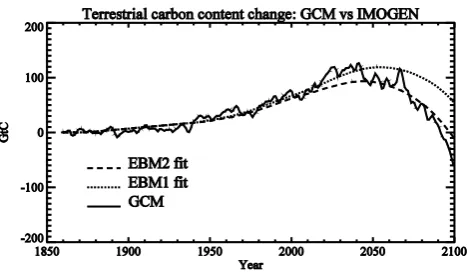
Fig. 3. IMOGEN EBM1 and EBM2 calculations (dotted and dashed
lines, respectively) of change in total terrestrial carbon (both vege-tation and soil, and across all land points except Antarctica) from 1860. Also plotted is the same quantity (continuous line) as pre-dicted by HadCM3LC. As for Fig. 2 in all cases, the models are forced by the SRES A2 emissions scenario, but adopting only the carbon dioxide component (i.e. no non-CO2GHGs).
configurations for the energy balance component (i.e. EBM1 and EBM2).
684 C. Huntingford et al.: IMOGEN: a model to evaluate terrestrial impacts of a changing climate
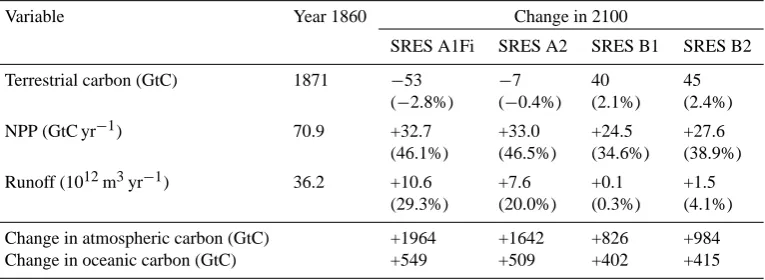
Table 1. Changes in total terrestrial carbon content, net primary productivity and runoff, relative to year 1860 and for four SRES scenarios,
and all using EBM2. The year 1860 values are presented in the second column. Changes for period 1860 to 2100 are also expressed as percentages (in brackets). In addition, the change since year 1860 in atmospheric carbon and carbon sequestered by the ocean are also given (both in units of GtC, and positive numbers implying a gain).
Variable Year 1860 Change in 2100
SRES A1Fi SRES A2 SRES B1 SRES B2
Terrestrial carbon (GtC) 1871 −53 −7 40 45
(−2.8%) (−0.4%) (2.1%) (2.4%)
NPP (GtC yr−1) 70.9 +32.7 +33.0 +24.5 +27.6
(46.1%) (46.5%) (34.6%) (38.9%)
Runoff (1012m3yr−1) 36.2 +10.6 +7.6 +0.1 +1.5
(29.3%) (20.0%) (0.3%) (4.1%)
Change in atmospheric carbon (GtC) +1964 +1642 +826 +984
Change in oceanic carbon (GtC) +549 +509 +402 +415
put this into context, the accepted likely range in climate sen-sitivity in the recent IPCC assessment was 1.5–4.5 K.
It is the “warmer” EBM2 configuration which reproduces the GCM’s land surface sink to source behaviour, rather than the configuration which optimally fitted the GCM temper-ature response (EBM1). This highlights that there remain IMOGEN deficiencies if it is regarded as an emulator of HadCM3LC, as opposed to simply a credible model of cli-mate change. Potential causes of this are discussed below.
The EBM2 IMOGEN configuration is extrapolated to three additional simulations, for SRES marker scenarios A1FI, B1 and B2 (but again, just adopting the CO2-only component of the emissions scenarios). The impact on total terrestrial carbon content is presented in Fig. 4. As expected for the more severe SRES A1FI scenario (i.e. higher emis-sions), the changes predicted in terrestrial carbon content are larger, with values for year 2100 indicating a massive loss of carbon back into the atmosphere. Quantities of Net Primary Productivity (NPP) and runoff are also diagnosed, these be-ing fluxes related to the carbon cycle and the hydrological cy-cle respectively. For all four SRES simulations considered, Table 1 gives the global calculated values for these variables (also presented is terrestrial carbon content) for year 1860, and the change, for period 1860 to 2100. For all simula-tions, global NPP increases by 2100. However by this time, in all simulations, terrestrial carbon content is decreasing and hence the magnitude of soil respiration is increasing at an even faster rate, to overtake that of NPP. Hence the land sur-face is a net source of CO2. In addition, from Table 1, global runoff increases in all model simulations. This can be related to the analysis by Gedney et al. (2006) and Betts et al. (2007), suggesting that CO2-induced stomatal closure might be one factor contributing to the known increasing levels of runoff.
IMOGEN has been designed specifically as a tool to model climate change impacts on the land-surface, and thereby
- 22 - 1
2
Figure 4: IMOGEN EBM2 calculation of change in total terrestrial carbon from
3
1860 (both vegetation and soil, and across all land points except Antarctica) and for
4
four SRES scenarios (but for the CO2-only component, i.e. no non-CO2 GHGs).
5
Fig. 4. IMOGEN EBM2 calculation of change in total terrestrial
carbon from 1860 (both vegetation and soil, and across all land points except Antarctica) and for four SRES scenarios (but for the CO2-only component, i.e. no non-CO2GHGs).
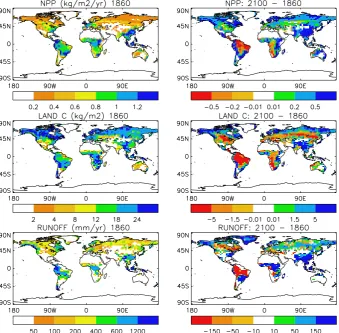
Fig. 5. Predictions of Net Primary Productivity, terrestrial carbon content (soil and vegetation) and runoff for year 1860, the start of the
IMOGEN transient simulation (left hand panels). These values are considered representative of pre-industrial state. The right hand panels show the changes in each of these quantities during the period 1860 to 2100. These simulations all correspond to the SRES A2 (CO2
emissions only) scenario, and with the EBM2 configuration of IMOGEN.
3 Discussion and conclusions
The IMOGEN impacts modelling system is designed to pre-dict surface climate and associated land surface impacts for future varying levels of atmospheric greenhouse gas concen-trations for which GCM simulations may be unavailable. The system also allows rapid assessment of the consequences of changing the depiction of processes in the land surface scheme. This can be either through re-parameterisation of the existing model equations, or the inclusion of new land surface processes believed to have potential importance in a changing climate. In addition IMOGEN can be configured so that it is forced by known global observed climatologies, to which the analogue model predictions of future climate change can be added. In those circumstances the climate model against which the patterns have been fitted provides anomalies only, and thus removal of possible GCM biases.
The case study we present highlights how relatively small differences in modelled climate sensitivity cause large dif-ferences in predictions of land surface-to-atmosphere carbon
flux at the end of the Century (for a “business-as-usual” emis-sions scenario). This overall sensitivity depends predom-inantly on the spatially-integrated balances between plant CO2 fertilisation and temperature influences on both plant physiology and on plant and soil respirations. Reducing un-certainties surrounding this balance are clearly important, as it will indicate the amount to which society can rely on ter-restrial ecosystems to “draw down” emitted carbon dioxide.
686 C. Huntingford et al.: IMOGEN: a model to evaluate terrestrial impacts of a changing climate seasons, and this can be investigated once GCM variability
is captured. In addition, a more realistic “weather gener-ator” is needed for describing the sub-daily timescales and characteristics of GCM-predicted surface climatology. The sub-daily variability may also influence, through the tempo-ral aggregation, the EBM parameterisation required to mimic the GCM. A particular request is, therefore, that GCM mod-elling groups save high temporal resolution data – possibly at each timestep – for calibration of weather-generator com-ponents of impacts models. This does have huge data stor-age implications but in the first instance it may be neces-sary to record such diagnostics only for particular years, cor-responding to different levels of global warming. As more GCM data becomes available the pattern-scaling concept, al-though known to be broadly valid (Huntingford and Cox, 2000), can be revisited and analyzed specifically for key ge-ographical regions of interest. One further difference is the current methodology for forcing MOSES/TRIFFID with at-mospheric data. In the GCM, the atat-mospheric data driving the land surface sub-model comes from the first atmospheric GCM model level, whereas in IMOGEN the 1.5 m temper-ature and humidity and 10m wind speed are used. This is because these are the usual GCM diagnostics, in keeping with traditional meteorological measurement heights. De-spite correcting for this difference in height, these differ-ences in forcing the surface scheme lead to small perturba-tions within the heat and moisture fluxes that could integrate to give larger changes through the length of the integration. This could also generate differences between the modelled terrestrial carbon cycle in the GCM and in IMOGEN.
An additional limitation of the IMOGEN concept is that it fails to model the influence of local land-atmosphere energy-and water-feedbacks on surface climate. Hence, for a radi-cally different parameterisation of MOSES/TRIFFID (for in-stance, that alters significantly the timing of predicted Ama-zon “die-back”), an incompatibility might emerge between GCM analogue model estimates of near-surface temperature and humidity, and what would be predicted by the GCM should simulations with the revised land surface model be available. Work is now starting to consider adding a second-order scaling pattern that depends explicitly on changes in land surface quantities. Finally the pattern-scaling concept for surface climate will be rigorously tested for long stabil-isation scenarios (possibly going significantly beyond mod-elled year 2100), or even the emerging concept of climate “overshoot” (e.g. Huntingford and Lowe, 2007; Lowe et al., 2009), as GCM simulations become available depicting such futures.
Despite the issues raised above, all of which will be ad-dressed as future refinements to the IMOGEN modelling structure, it is believed that this system can provide accept-able regional estimates of the impacts of climate change on the land surface. It can compute impacts issues of concern (i.e. related to food and water security) for a range of emis-sion scenarios relatively quickly, and for any enhancements
to modelled ecosystem response. This system allows “what if” type impacts questions to be readily answered as they emerge from international negotiations regarding future lev-els of atmospheric greenhouse gas concentrations. It has the potential to determine the main expected atmospheric drivers of change to ecosystem behaviour by individually switching patterns on and off for the various constituents of surface me-teorology. Finally it opens many new scientific applications, through determining the global implications of new process understanding as this is added to models of the land surface.
Acknowledgements. CH and LMM recognise the support of the Centre for Ecology and Hydrology Science Budget fund. The Met Office authors were supported by the Joint DECC and Defra Integrated Climate Programme – DECC/Defra (GA01101).
Edited by: D. Lawrence
References
Betts, R. A., Boucher, O., Collins, M., et al.: Projected increase in continental runoff due to plant responses to increasing carbon dioxide, Nature, 448, 1037–1041, 2007.
Cox, P. M.: Description of the TRIFFID dynamic global vegetation model, Technical Note 24, Hadley Centre, Met Office, UK, 2001. Cox, P. M., Betts, R. A., Bunton, C. B., Essery, R. L. H., Rowntree, P. R., and Smith, J.: The impact of new land surface physics on the GCM simulation of climate and climate sensitivity, Clim. Dynam., 15, 183–203, 1999.
Cox, P. M., Betts, R. A., Jones, C. D., Spall, S. A., and Totterdell, I. J.: Acceleration of global warming due to carbon-cycle feed-backs in a coupled climate model, Nature, 408, 184–187, 2000. Cox, P. M., Huntingford, C., and Harding, R. J.: A canopy
conduc-tance and photosynthesis model for use in a GCM land surface scheme, J. Hydrol., 212–213, 79–94, 1998.
Fisher, R., McDowell, N., Purves, D., Moorcroft, P., Sitch, S., Cox, P., Huntingford, C., Meir, P., and Woodward, F. I.: Assessing uncertainties in a second-generation dynamic vegetation model caused by ecological scale limitations, New Phytol., 187, 666– 681, 2010.
Friedlingstein, P., Cox, P., Betts, R., et al.: Climate-carbon cycle feedback analysis: Results from the (CMIP)-M-4 model inter-comparison, J. Climate, 19, 3337–3353, 2006.
Gedney, N., Cox, P. M., Betts, R. A., Boucher, O., Huntingford, C., and Stott, P. A.: Detection of a direct carbon dioxide effect in continental river runoff records, Nature, 439, 835–838, 2006. Gedney, N., Cox, P. M., and Huntingford, C.: Climate
feed-back from wetland methane emissions, Geophys. Res. Lett., 31, L20503, doi:10.1029/2004GL020919, 2004.
Gordon, C., Cooper, C., Senior, C., Banks, H., Gregory, J., Johns, T., Mitchell, J., and Wood, R.: The simulation of SST, sea ice extents and ocean heat transport in a version of the Hadley Cen-tre coupled model without flux adjustments, Clim. Dynam., 16, 147–168, 2000.
Hughes, J. K., Lloyd, A. J., Huntingford, C., Finch, J. W., and Hard-ing, R. J.: The impacts of extensive planting of Miscanthus as an energy crop on future CO2atmospheric concentrations, Global Change Biol. Bioenerg., 2, 79–88, 2010.
Huntingford, C. and Cox, P. M.: An analogue model to derive addi-tional climate change scenarios from existing GCM simulations, Clim. Dynam., 16, 575–586, 2000.
Huntingford, C., Fisher, R. A., Mercado, L., et al.: Towards quan-tifying uncertainty in predictions of Amazon “Die-back”,Philos. T. Roy. Soc. B, 363, 1857–1864, 2008.
Huntingford, C., Harris, P. P., Gedney, N., Cox, P. M., Betts, R. A., Marengo, J. A., and Gash, J. H. C.: Using a GCM analogue model to investigate the potential for Amazonian forest dieback, Theor. Appl. Climatol., 78, 177–185, 2004.
Huntingford, C. and Lowe, J.: Overshoot scenarios and climate change, Science, 316, 829, 2007.
Imhoff, M. L., Bounoua, L., Ricketts, T., Loucks, C., Harriss, R., and Lawrence, W. T.: Global patterns in human consumption of net primary production, Nature, 429, 870–873, 2004.
IPCC: Climate Change 2007: The Physical Science Basis, Con-tribution of Working Group I to the Fourth Assessment Report of the Intergovernmental Panel on Climate Change, edited by: Solomon, S., Qin, D., Manning, M., Chen, Z., Marquis, M., Av-eryt, K. B., Tignor, M., and Miller, H. L., Cambridge University Press, Cambridge, UK and New York, NY, USA, 996 pp., 2007. Jones, C. D., Cox, P. M., and Huntingford, C.: Climate-carbon cy-cle feedbacks under stabilization: uncertainty and observational constraints, Tellus B, 58, 603–613, 2006.
Joos, F., Bruno, M., Fink, R., Siegenthaler, U., and Stocker, T. F.: An efficient and accurate representation of complex oceanic and biospheric models of anthropogenic carbon uptake, Tellus B, 48, 397–417, 1996.
Lobell, D. B. and Field, C. B.: Global scale climate-crop yield rela-tionships and the impacts of recent warming, Environ. Res. Lett., 2, 014002, doi:10.1088/1748-9326/2/1/014002, 2007.
Lowe, J. A., Huntingford, C., Raper, S. C. B., Jones, C. D., Lid-dicoat, S. K., and Gohar, L. K.: How difficult is it to recover from dangerous levels of global warming?, Environ. Res. Lett., 4, 014012, doi:10.1088/1748-9326/4/1/014012, 2009.
Mercado, L. M., Bellouin, N., Sitch, S., Boucher, O., Huntingford, C., Wild, M., and Cox, P. M.: Impact of changes in diffuse ra-diation on the global land carbon sink, Nature, 458, 1014–1017, 2009.
Moorcroft, P. R., Hurtt, G. C., and Pacala, S. W.: A method for scaling vegetation dynamics: the ecosystem demography model (ED), Ecol. Monogr., 71, 557–586, 2001.
Moss, R. H., Edmonds, J. A., Hibbard, K. A., Manning, M. R., Rose, S. K., van Vuuren, D. P., Carter, T. R., Emori, S., Kainuma, M., Kram, T., Meehl, G. A., Mitchell, J. B. F., Nakicenovic, N., Riahi, K., Smith, S. J., Stouffer, R. J., Thomson, A. M., Weyant, J. P., and Wilbanks, T. J.: The next generation of scenarios for climate research and assessment, Nature, 463, 747–756, 2010. Nakiæenoviæ, N., Alcamo, J., Davis, G., et al.: IPCC Special
Re-port on Emissions Scenarios, Cambridge University Press, Cam-bridge, UK, 570 pp., 2000.
New, M., Hulme, M., and Jones, P. D.: Representing twentieth century space-time climate variability, Part 1: development of a 1961–90 mean monthly terrestrial climatology, J. Climate, 12, 829–856, 1999.
Schr¨oter, D., Cramer, W., Leemans, R., et al.: Ecosystem Service Supply and Vulnerability to Global Change in Europe, Science, 310, 1333–1337, 2005.
Sitch, S., Cox, P. M., Collins, W. J., and Huntingford, C.: Indirect radiative forcing of climate change through ozone effects on the land-carbon sink, Nature, 448, 791–794, 2007.
Sitch, S., Huntingford, C., Gedney, N., et al: Evaluation of the ter-restrial carbon cycle, future plant geography and climate-carbon cycle feedbacks using five Dynamic Global Vegetation Models (DGVMs), Global Change Biol., 14, 2015–2039, 2008. Sutton, R. T., Dong, B. W., and Gregory, J. M.: Land/sea warming