Monocyte to Lymphocyte Ratio,
Neutrophil to Lymphocyte Ratio,
and Red Cell Distribution Width
are the Associates with Gouty Arthritis
Cengiz Kadiyoran
1, Orhan Zengin
2, Hilal Akay Cizmecioglu
3, Abdurrahman Tufan
4, Orhan Kucuksahin
5,
Medine Cumhur Cure
6, Erkan Cure
7,*, Adem Kucuk
8, Mehmet Akif Ozturk
4ABSTRACT
Background: Neutrophils, monocytes, and macrophages activations are associated with a gout attack. Monocyte to lymphocyte ratio (MLR), neutrophil to lymphocyte ratio (NLR), platelet to lymphocyte ratio (PLR), red cell distribution width (RDW), and mean platelet volume (MPV) are well-known inflammation markers. In this study, we aimed to investigate whether they could be a predictive marker to the gout attack.
Material and Methods: A hundred and ten gout patients (male/female, 86/24) and 90 (male/female, 64/26) age-, gender-, and body mass index-matched volunteer controls were included in the study. Blood samples were obtained in the intercritical and attack period of the patients. Hemogram, serum uric acid (SUA), C-reactive protein (CRP), and erythrocyte sedimentation rate (ESR) values were studied. Results: In the attack period NLR (p < 0.001), PLR (p < 0.05), MLR (p < 0.001), RDW (p < 0.05), MPV (p < 0.05), ESR (p < 0.001), CRP (p < 0.001) and SUA (p < 0.001) values were significantly higher than intercritical period values. According to the results of regression analysis; There was an independent strong relationship between the gout attack and SUA, (Beta [β] = 0.352, p < 0.001), ESR (β = 0.329, p < 0.001), CRP (β = 0.286, p < 0.001), MLR (β = 0.126, p < 0.001), RDW (β = 0.100, p = 0.003) and NLR (β = 0.082, p = 0.014).
Conclusions: MLR, RDW, and NLR may be a strong predictive marker for a gout attack. MPV and PLR values in the gout attack may be associated with systemic inflammation.
KEYWORDS
gouty arthritis; monocyte to lymphocyte ratio; neutrophil to lymphocyte ratio; red cell distribution width; mean platelet volume
AUTHOR AFFILIATIONS
1 Department of Radiology, Necmettin Erbakan University, Konya, Turkey
2 Department of Rheumatology, Adiyaman Training and Research Hospital, Adiyaman, Turkey 3 Department of Internal Medicine, Necmettin Erbakan University, Konya, Turkey
4 Division of Rheumatology, Department of Internal Medicine, Gazi University Faculty of Medicine, Ankara, Turkey 5 Division of Rheumatology, Department of Internal Medicine, Ankara Liv Hospital, Kavaklidere, Ankara, Turkey 6 Department of Biochemistry, Sadik Ahmet Hospital, Istanbul, Turkey
7 Department of Internal Medicine, Ota&Jinemed Hospital, Istanbul, Turkey
8 Division of Rheumatology, Department of Internal Medicine, Necmettin Erbakan University, Konya, Turkey
* Corresponding author: Department of Internal Medicine, Ota & Jinemed Hospital, Beşiktaş, Istanbul, Turkey; e-mail: erkancure@yahoo.com
Received: 4 April 2019 Accepted: 18 July 2019
Published online: 30 October 2019
Acta Medica (Hradec Králové) 2019; 62(3): 99–104 https://doi.org/10.14712/18059694.2019.132
INTRODUCTION
Gout is a common type of inflammatory arthritis and its prevalence is increasing. It is common in men compared to women. Acute episodes usually begin with sudden pain and swelling in the joints of the toe or the lower ex-tremities (1–3). There are many mechanisms that initiate a gout attack that is one of the reasons for hyperuricemia (4). Generally, when serum uric acid (SUA) level exceeds 6.4 mg/dl, the inflammatory attack starts with accumu-lation in small joints in the form of monosodium urate (MSU) crystals (5). The crystals accumulate in the joint range and synovium where areas have excessive mac-rophage and neutrophil migration. MSU crystals cause the release of pro-inflammatory cytokines, such as inter-leukin (IL)-1beta, IL-6, tumor necrosis factor (TNF), and some chemokines (6). These pro-inflammatory cytokines and lysosomal enzymes are released from macrophages and neutrophils (7). Colchicine inhibits the inflammato-ry effect of MSU cinflammato-rystals and the release of IL-1beta (6). As a result of phagocytizing of MSU crystals by treatment or spontaneously by macrophages, the acute attack ends and the asymptomatic period begins (5, 8). Gout patients are exposed to local and systemic inflammation, especially during the acute attack.
The presence and prognosis of systemic inflamma-tion are increased by elevated C-reactive protein (CRP), leukocyte, platelet, ferritin and decreased albumin levels (9). Neutrophils, monocytes, and macrophages migrate to the site of inflammation, causing inflammation by releas-ing some cytokines and chemokines (8). Also, lysosomal enzymes released from neutrophils and cytokines cause reactive oxygen species (ROS) (4). Increased ROS and cy-tokines cause the release of young and immature erythro-cytes and platelets from the bone marrow to the periph-ery (10). There is a relationship between the inflammation level and the hemogram parameters such as neutrophil to lymphocyte ratio (NLR), platelet to lymphocyte ratio (PLR), monocyte to lymphocyte ratio (MLR), red cell dis-tribution width (RDW), and mean platelet volume (MPV), therefore; recently, researchers focused on investigating the reliability of these inexpensive hematological parame-ters. Many studies have reported that the parameters may be a reliable and inexpensive marker as a prognostic factor for predisposition to thrombosis, cancer patients, cerebro-vascular and cardiocerebro-vascular diseases (11–15).
In this study, we aimed to investigate whether NLR, PLR, MLR, MPV, and RDW were higher in gout patients compared to the control group. Secondly, we aimed to in-vestigate whether these parameters increase in gout at-tack and which markers may be the predictive marker for the gout attacks.
METHODS
SAMPLES SELECTION
The study included 110 outpatients with gout (male/fe-male: 86/24) who were admitted to our hospital, Depart-ment of Rheumatology and Internal Medicine policlinics, and 90 volunteer controls (male/female: 64/26) were
included in the study. Patients’ Gout was diagnosed ac-cording to the American College of Rheumatology (ACR) 2012 criteria (16). Blood samples were taken between 24 and 48 hours after the onset of pain, redness swelling complaints in patients with gout attack according to ACR 2012 criteria. Blood samples for hemogram, erythrocyte sedimentation rate (ESR), CRP, SUA, ALT, blood urea nitro-gen (BUN) and creatinine values were taken in the inter-critical period (17, 18). Patients with any of the following conditions were not included in the study; other rheuma-tologic diseases, uncontrolled diabetes, uncontrolled hy-pertension, uncontrolled hyperlipidemia, hematological and solid malignancy, acute and chronic infections, septic arthritis, hemodialysis or peritoneal dialysis patients with renal failure, and smokers.
RADIOLOGIC EXAMINATION
X-ray and radiological imaging of the patients were per-formed during attacks and non-attacks period. In the in-tercritical period, bone erosions were differentiated from other erosive arthritis according to the shape of gout, and the diagnosis of gout was confirmed by clinical, laboratory and radiological findings. The presence of soft tissue swell-ing in the joint region of acute gout arthritis was evaluated radiologically by direct X-ray.
BLOOD PRESSURE (BP) MEASUREMENTS
After both gout patients and control group at least 15 min-utes relaxing, systolic and diastolic BP measurements ob-tained from their right and left arm by using sphygmoma-nometer. According to their elevated arm measurements, the dominant side was determined for blood pressure measurement and that the arm was used for subsequent BP measurements. After two additional measures which were obtained from the dominant arm, waiting 5 minutes between two measures, mean systolic and diastolic BP were calculated in order to get a proper measurement.
BIOCHEMICAL PARAMETERS
STATISTICAL ANALYSIS AND ETHIC ISSUE
The results were given as mean ± standard deviation, me-dian (range), and n (%). Statistical evaluation was per-formed with SPSS (version 18) package program. Kol-mogorov Smirnov test was used to determine whether the data were homogenous. Homogeneous distribution data were compared with the Independent Student Test. Non-homogeneous distribution data such as CRP, ESR, NLR, PLR, and MLR were compared with the Mann Whit-ney U test. The Chi-square test was used to evaluate cat-egorical data. The Pearson correlation test was used for correlation analysis. Stepwise linear regression analysis was performed to determine the independent variables associated with attack formation in patients with gout. Regression analysis was performed as an independent variable such as NLR, MLR, PLR, MPV, hemoglobin, SUA, creatinine, BUN, CRP, and ESR. A p value of < 0.05 was considered significant. The study was approved by the lo-cal ethics committees, and informed consent from each participant was obtained.
RESULTS
Age (58.1 ± 11.8 vs. 58.5 ± 14.9 years, p = 0.810), gender (M/F: 86/24 vs 64/26, p = 0.415), and body mass index
(26.3 ± 3.6 vs. 26.7 ± 4.2 kg/m2, p = 0.454) of patients with
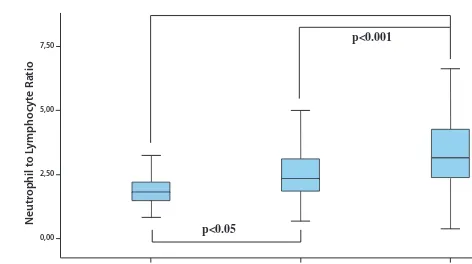
gout were similar to those of control patients. The comor-bid conditions of these patients were similar to the control group. Age, sex, disease duration, co-morbidity and medi-cations of the patients were given in table 1. The intercrit-ical period NLR (p < 0.05), RDW (p < 0.001), ESR (p < 0.05), SUA (p < 0.001) systolic BP (p < 0.05), and diastolic BP (p < 0.05) values of the gout patients were significantly higher than the control group values. In the attack peri-od of the gout patients: NLR (p < 0.001), PLR (p < 0.001), MLR (p < 0.001), RDW (p < 0.001), MPV (p < 0.05), ESR (p < 0.001), CRP (p < 0.001) and SUA (p < 0.001) were higher than the values of the control group. When the at-tack period and intercritical period of gout patients were compared, the attack period was NLR (p < 0.001), PLR (p < 0.05), MLR (p < 0.001), RDW (p < 0.05), MPV (p < 0.05), ESR (p < 0.001). ), CRP (p < 0.001) and SUA (p < 0.001) val-ues were significantly higher than intercritical period values. MLR, NLR and RDW values of the patients were given in figures 1, 2 and 3, respectively. All values of attack period, non-attack period and control group are shown in Table 1.
Tab. 1 Age, gender, duration comorbidities, and medications for Patients.
Gout Patients
(n = 110) Control (n = 90) P value Age (years) 58.1 ± 11.8 58.5 ± 14.9 0.810
Gender (M/F) 86/24 64/26 0.415
BMI (kg/m2) 26.3 ± 3.6 26.7 ± 4.2 0.454 Duration of disease
(months) 14.0 (1.0–96.0)
SBP (mmHg) 125.9 ± 11.0 122.0 ± 11.5 0.016 DBP (mmHg) 80.1 ± 8.7 76.1 ± 9.5 0.002 Hypertension 26 (23.6) 22 (24.4) 0.512 Coronary artery
disease 12 (10.9) 10 (11.1) 0.570
Diabetes mellitus 9 (8.1) 11 (12.2) 0.391 Hyperlipidemia 25 (22.7) 25 (27.7) 0.255 Chronic renal failure 3 (2.7) 2 (2.2) 0.594
Thyroid disease 0 (0.0) 1 (0.9) 0.450
Colchicine 97 (88.1) 0 (0.0) 0.001
Allopurinol 102 (92.7) 0 (0.0) 0.001
NSAIDs 14 (12.7) 0 (0.0) 0.001
Steroids 6 (5.4) 0 (0.0) 0.001
Acetyl salicylic acid 20 (18.1) 18 (20) 0.441 Diuretic (single or
combination) 5 (4.5) 9 (10) 0.110
The results were given as mean ± SD, median (range) or n (%). M, male; F, female; BMI, body mass index; SBP, systolic blood pressure; DBP, diastolic blood pressure; NSAIDs, non-steroidal anti-inflammatory drugs.
M
onoc
yt
e t
o L
ymphoc
yt
e R
atio2,00
0,00
p<0.001
p<0.001
Control Intercritical gout Acute gouty arthritis
Fig. 1 Monocyte to lymphocyte ratio in attack and intercritical period of gouty arthritis.
Neutr
ophil t
o L
ymphoc
yt
e R
atio
7,50
2,50 5,00
0,00 p<0.05
p<0.001
Control Intercritical gout Acute gouty arthritis
Fig. 2 Neutrophil to lymphocyte ratio in attack and intercritical period of gouty arthritis.
Red C
ell D
istribution
W
idth
16,00
12,00 14,00
10,00
p<0.001 p<0.001
p<0.05
Control Intercritical gout Acute gouty arthritis
Tab. 3 NLR, RDW, MLR, uric acid, and correlation analysis of other factors in patients with gout arthritis.
Variable
r value SUAp value r value CRPp value Intercritical
period NLRRDW 0.2150.100 0.0010.138 0.2750.070 0.0010.340
MLR 0.115 0.089 0.155 0.022
MPV 0.006 0.924 0.141 0.037
PLR 0.063 0.355 0.168 0.013
SUA 0.118 0.081
CRP 0.118 0.081
SBP 0.250 0.009 0.164 0.088
DBP 0.216 0.023 0.234 0.014
Attack
period NLRRDW 0.2020.319 0.0010.001 0.3320.173 0.0010.002
MLR 0.045 0.435 0.092 0.109
MPV 0.032 0.577 0.142 0.012
PLR 0.068 0.232 0.221 0.001
SUA 0.300 0.001
CRP 0.300 0.001
SUA, serum uric acid; CRP, C-reactive protein; NLR, neutrophil to lymphocyte ratio; RDW, red cell distribution width; MLR, monocyte to lymphocyte ratio; MPV, mean platelet volume; PLR, platelet to lymphocyte ratio; SBP, systolic blood pressure; DBP, diastolic blood pressure.
Tab. 4 Stepwise Linear Regression Analyses, determinants of attack period in patients with Gout Arthritis.
Gout attack as Dependent Variable Independent Variables Beta coefficients p value
SUA 0.352 0.001
ESR 0.329 0.001
CRP 0.286 0.001
MLR 0.126 0.001
RDW 0.100 0.003
NLR 0.082 0.014
SUA, uric acid; ESR, erythrocyte sedimentation rate; CRP, C-reactive protein; MLR, monocyte to lymphocyte ratio; RDW, red cell distribution width; NLR, neutrophil to lymphocyte ratio.
In the correlation analysis for intercritical period, there was a positive correlation between SUA and RDW (p < 0.001). We found a positive association between CRP and NLR (p < 0.001), MLR (p = 0.022), and PLR (p = 0.013). In addition, we determined a positive association between MLR and systolic BP (r = 0.199, p = 0.039). In the correla-tion analysis for attack period; we found a positive associ-ation between SUA and NLR (p < 0.001), RDW (p < 0.001), and CRP (p < 0.001). We determined a positive relation between CRP and NLR (p < 0.001), RDW (p = 0.002), MPV (p = 0.012), and PLR (p < 0.001). Correlation analysis re-sults are shown in Table 3.
Tab. 2 Hematological and biochemical parameters in attack and attack free period in patients with gout.
Variables Attack period (n = 110) Attack free period (n = 110) Control (n = 90)
WBC (×109/L) 9.6 ± 2.0 *1 1 8.4 ± 1.9 8.8 ± 3.0
Neutrophil (×109/L) 6.4 ± 2.0**1 1 5.4 ± 1.9 5.3 ± 2.5
Lymphocyte (×109/L) 2.1 ± 0.7** 2.3 ± 0.9** 2.7 ± 0.7
Monocyte (×109/L) 0.8 (0.1–5.3)*1 1 0.7 (0.1–2.3) 0.8 (0.2–8.5)
Platelet (×109/L) 270.3 ± 93.71 239.3 ± 80.5* 266.3 ± 63.5
Hb (g/dL) 13.9 ± 1.3** 13.8 ± 1.1** 14.6 ± 1.7
MPV (fL) 10.3 ± 1.0*1 9.9 ± 1.0 9.9 ± 0.8
NLR 3.1 (0.4–8.8)**1 1 2.3 (0.6–13.1)* 1.8 (0.8–6.4)
PLR 128.8 (28.8–360.0)**1 104.1 (28.9–362.5) 95.0 (44.1–204.0)
MLR 0.4 (0.1–3.7)**1 1 0.3 (0.1–1.9) 0.3 (0.1–2.1)
RDW 14.2 ± 0.9**1 13.8 ± 1.3** 13.1 ± 1.2
ESR (mm/h) 36.0 (11.0–100.0)**1 1 12.0 (2.0–53.0)* 8.0 (2.0–37.0) CRP (mg/dL) 29.5 (5.6–120.0)**1 1 3.5 (1.3–32.0) 2.2 (0.3–15.9)
Uric acid (mg/dL) 8.4 ± 1.5**1 1 7.3 ± 2.3** 4.7 ± 1.1
BUN (mg/dL) 33.6 ± 17.6** 30.8 ± 15.3** 15.3 ± 4.7
Creatinine (mg/dL) 1.0 ± 0.4* 1.0 ± 0.4* 0.9 ± 0.2
ALT (IU/L) 36.5 ± 20.6* 32.1 ± 22.5 27.9 ± 19.8
The results were given as mean ± SD and median (range).
WBC, white blood cell; HB, hemoglobin; MPV, mean platelet volume; NLR, neutrophil to lymphocyte ratio; PLR, platelet to lymphocyte ratio; MLR, monocyte to lymphocyte ratio; RDW, red cell distribution width; ESR, erythrocyte sedimentation rate; CRP, C-reactive protein; BUN, blood urea nitrogen; ALT, alanine aminotransferase.
* p < 0.05, ** p < 0.001 vs control group
According to the results of stepwise linear regression analysis; There was an independent strong relationship between gout attack and SUA (p < 0.001), ESR (p < 0.001), CRP (p < 0.001), MLR (p < 0.001), RDW (p = 0.003) and NLR (p = 0.014). Regression analysis results are shown in Ta-ble 4.
DISCUSSION
In this study, NLR and RDW values were significantly higher in gout patients compared to the control group. In the attack period, NLR, PLR, MLR, RDW, and MPV values were significantly higher than the intercritical period and control group. In the regression analysis, we found that SUA, CRP, ESR, MLR, NLR and RDW values could be pre-dictive markers for a gout attack.
Even if the SUA concentration is normal, a gout attack may develop (19). However, there is a high correlation between SUA concentration and gout attack (20). In our study, we found a very high relationship between gout attack and SUA level. Also, according to our findings, the SUA level is the most important predictive marker for a gout attack. Hyperuricemia leads to ROS formation and endothelial dysfunction (21). Hyperuricemia is associated with obesity, type 2 diabetes mellitus, atherosclerosis and hypertension (22, 23). We found the systolic and diastolic BP values in gout patients to be higher than the control group. Also, we found a high relation between both systol-ic and diastolsystol-ic BP and SUA levels in the correlation anal-ysis. Gout patients may be prone to cardiovascular disease because hypertension is one of the major factors of ather-osclerosis.
Although SUA inhibits the formation of ROS, it caus-es ROS formation due to autophagy defects (24). SUA shows the pro-inflammatory effect by direct stimulation of the monocytes (24, 25). Monocyte stimulation causes inflammation by releasing pro-inflammatory cytokines (26). Monocytes play an important role both at the begin-ning and end of the gout attack (27). MSU crystals provide transformation of monocytes into macrophages by stim-ulating transforming growth factor beta (8, 27). In addi-tion, monocytes release pro-inflammatory cytokines in the peripheral circulation. Monocytes accumulate in the arterial wall and turn into macrophages and they cause lo-cal damage by releasing pro-inflammatory cytokines from macrophages (28). Low lymphocyte counts have been re-ported to be related to inflammation, atherosclerosis and plaque development (29). Increased monocyte count and decreased lymphocyte count cause to raise MLR. There has been a strong relationship between MLR and systemic inflammation, cardiovascular disease and myocardial in-farction (30, 31). In our study, we found MLR as a strong predictive marker in the gout attack. Also, there was also a relationship between MLR and systolic BP. The relation-ship between MLR values and subclinical atherosclerosis in gout patients may be investigated in the novel studies.
Neutrophils are the major responsible cells in gout inflammation and attack development (32). The deposi-tion of MSU crystals in tissues leads to massive leukocyte inflammation (33). The release of pro-inflammatory
cy-tokines and lysosomal enzymes from leukocytes causes ROS to increase in the environment. Increasing the num-ber of neutrophils also leads to an enhancement in blood viscosity and hypercoagulability by causing interaction in the platelets and endothelium (34). Neutrophils show nonspecific inflammation and the decrease in the number of lymphocytes reflects the inflammation (35). NLR, there-fore; shows more effective inflammation than the neutro-phil count (34). NLR is a powerful independent indicator of prognosis in systemic inflammation, atherosclerotic heart disease, and cancer patients (11, 12). We determined a high relationship between NLR and SUA, especially dur-ing the attack episode of gout. In our study, we found NLR as a strong independent predictive marker for a gout at-tack in regression analysis.
Inflammation and increased ROS suppress erythro-poiesis. As a result of this suppression, erythrocytes in the bone marrow pass into peripheral blood before they reach adequate maturation, and complete immature erythro-cytes increase in peripheral blood (36). Pro-inflammatory cytokines increase the synthesis of hepcidin in the liver by IL-6 mediated inhibition of iron reaching normoblasts and these cytokines suppress normoblast proliferation and in-crease the phagocytosis of erythrocytes (37, 38). As a result of these events, the non-functional juvenile erythrocytes increase in the peripheral blood. RDW is the best test that shown this increase in the laboratory. RDW has been found to be an independent predictive marker for inflammation and atherosclerotic heart disease (39). We found a high relationship between RDW and SUA, particularly during the gout attack. In our study, we found RDW as a strong predictive marker for a gout attack.
Platelets adhere to endothelial cells and increase in-flammation by causing leukocytes to migrate to this area and cling to it. On the other hand, increased cytokines and ROS affect the thrombopoiesis and increase the output of immature, larger than normal and active platelets to the peripheral blood (10). These active platelets release
ser-otonin, thromboxane A2, ADP and clotting factors to the
environment. MPV is a laboratory test that reflects these platelets in the blood (10, 14). Studies have reported that releasing the juvenile, dysformic erythrocytes and young, large platelets to peripheral blood circulation; increase in the risk of thrombosis (14, 39). Conway et al. reported that platelet activity was significantly increased during the attack, particularly with a predisposition to thrombosis (40). Increased MPV is associated with systemic inflam-mation and atherosclerotic heart disease (10). However, in our study, we found that PLR and MPV values for gout attack were not predictive markers.
CONCLUSION
period and intercritical period, increased inflammation and platelet activation may cause various organ and sys-tem diseases especially cardiovascular disease. Whether the inexpensive hematological parameters are a marker for cardiovascular disease in gout patients can be investi-gated in novel studies.
CONFLICT OF INTEREST STATEMENT
None to declare.
REFERENCES
1. Mirmiran R, Bush T, Cerra MM, et al. Joint Clinical Consensus State-ment of the American College of Foot and Ankle Surgeons® and the American Association of Nurse Practitioners®: Etiology, Diagnosis, and Treatment Consensus for Gouty Arthritis of the Foot and Ankle. J Foot Ankle Surg 2018; 57: 1207–7.
2. Ragab G, Elshahaly M, Bardin T. Gout: An old disease in new perspec-tive – A review. J Adv Res 2017; 8: 495–511.
3. Terkeltaub R. What makes gouty inflammation so variable? BMC Med 2017; 15: 158.
4. Zamudio-Cuevas Y, Hernandez-Díaz C, Pineda C, et al. Molecular ba-sis of oxidative stress in gouty arthropathy. Clin Rheumatol 2015; 34: 1667–72.
5. Schett G, Schauer C, Hoffmann M, et al. Why does the gout attack stop? A roadmap for the immune pathogenesis of gout. RMD Open 2015; 1: e000046.
6. Pope RM, Tschopp J. The role of interleukin-1 and the inflammasome in gout: implications for therapy. Arthritis Rheum 2007; 56: 3183–8.
7. Joosten LA, Netea MG, Mylona E, et al. Engagement of fatty acids with Toll-like receptor 2 drives interleukin-1β production via the ASC/ caspase 1 pathway in monosodium urate monohydrate crystal-in-duced gouty arthritis. Arthritis Rheum 2010; 62: 3237–48.
8. Cronstein BN, Sunkureddi P. Mechanistic aspects of inflammation and clinical management of inflammation in acute gouty arthritis. J Clin Rheumatol 2013; 19: 19–29.
9. Ren K, Yin Y, He F, et al. Prognostic role of derived neutrophil-to-lym-phocyte ratio in surgical triple-negative breast cancer. Cancer Manag Res 2018; 10: 4891–8.
10. Cure MC, Cure E, Kirbas A, et al. The effects of Gilbert’s syndrome on the mean platelet volume and other hematological parameters. Blood Coagul Fibrinolysis 2013; 24: 484–8.
11. Lin J, Zhang W, Huang Y, et al. Sarcopenia is associated with the neu-trophil/lymphocyte and platelet/lymphocyte ratios in operable gas-tric cancer patients: a prospective study. Cancer Manag Res 2018; 10: 4935–44.
12. Nam KW, Kwon HM, Jeong HY, et al. High neutrophil to lymphocyte ratios predict intracranial atherosclerosis in a healthy population. Atherosclerosis 2018; 269: 117–21.
13. Zhu Z, Xu L, Zhuang L, et al. Role of monocyte-to-lymphocyte ratio in predicting sorafenib response in patients with advanced hepato-cellular carcinoma. Onco Targets Ther 2018; 11: 6731–40.
14. Cumhur Cure M, Cure E, Yuce S, et al. Mean platelet volume and vi-tamin D level. Ann Lab Med 2014; 34: 98–103.
15. den Harder AM, de Jong PA, de Groot MCH, et al. Commonly available hematological biomarkers are associated with the extent of coronary calcifications. Atherosclerosis. 2018; 275: 166–73.
16. Khanna D, Fitzgerald JD, Khanna PP, et al. American College of Rheu-matology. 2012 American College of Rheumatology guidelines for management of gout. Part 1: systematic nonpharmacologic and phar-macologic therapeutic approaches to hyperuricemia. Arthritis Care Res (Hoboken) 2012; 64: 1431–46.
17. Khanna D, Khanna PP, Fitzgerald JD, et al. American College of Rheu-matology. 2012 American College of Rheumatology guidelines for management of gout. Part 2: therapy and antiinflammatory
prophy-laxis of acute gouty arthritis. Arthritis Care Res (Hoboken) 2012; 64: 1447–61.
18. Litao MK, Kamat D. Erythrocyte sedimentation rate and C-reactive protein: how best to use them in clinical practice. Pediatr Ann 2014; 43: 417–20.
19. Badulescu M, Macovei L, Rezuş E. Acute gout attack with normal serum uric acid levels. Rev Med Chir Soc Med Nat Iasi 2014; 118: 942–5.
20. Robinson PC. Gout – An update of aetiology, genetics, co-morbidities and management. Maturitas 2018; 118: 67–73.
21. Maruhashi T, Hisatome I, Kihara Y, et al. Hyperuricemia and en-dothelial function: From molecular background to clinical perspec-tives. Atherosclerosis 2018; 278: 226–31.
22. Tomiyama H, Shiina K, Vlachopoulos C, et al. Involvement of Arterial Stiffness and Inflammation in Hyperuricemia-Related Development of Hypertension. Hypertension 2018; 72: 739–45.
23. Baey C, Yang J, Ronchese F, Harper JL. Hyperuricaemic UrahPlt2/Plt2 mice show altered T cell proliferation and defective tumor immu-nity after local immunotherapy with Poly I:C. PLoS One 2018; 13: e0206827.
24. Crişan TO, Cleophas MCP, Novakovic B, et al. Uric acid priming in human monocytes is driven by the AKT-PRAS40 autophagy pathway. Proc Natl Acad Sci U S A 2017; 114: 5485–90.
25. Crișan TO, Cleophas MC, Oosting M, et al. Soluble uric acid primes TLR-induced proinflammatory cytokine production by human pri-mary cells via inhibition of IL-1Ra. Ann Rheum Dis 2016; 75: 755–62.
26. Harre U, Derer A, Schorn C, et al. T cells as key players for bone de-struction in gouty arthritis? Arthritis Res Ther 2011; 13: 135.
27. Martin WJ, Shaw O, Liu X, et al. Monosodium urate monohydrate crystal-recruited noninflammatory monocytes differentiate into M1-like proinflammatory macrophages in a peritoneal murine mod-el of gout. Arthritis Rheum 2011; 63: 1322–32.
28. Ley K, Miller YI, Hedrick CC. Monocyte and macrophage dynamics dur-ing atherogenesis. Arterioscler Thromb Vasc Biol 2011; 31: 1506–16.
29. Gravani F, Papadaki I, Antypa E, et al. Subclinical atherosclerosis and impaired bone health in patients with primary Sjogren’s syndrome: prevalence, clinical and laboratory associations. Arthritis Res Ther 2015; 17: 99.
30. Fan Z, Li Y, Ji H, Jian X. Prognostic utility of the combination of monocyte-to-lymphocyte ratio and neutrophil-to-lymphocyte ratio in patients with NSTEMI after primary percutaneous coronary in-tervention: a retrospective cohort study. BMJ Open 2018; 8: e023459.
31. Ji H, Li Y, Fan Z, et al. Monocyte/lymphocyte ratio predicts the se-verity of coronary artery disease: a syntax score assessment. BMC Cardiovasc Disord 2017; 17: 90.
32. Mitroulis I, Kambas K, Chrysanthopoulou A, et al. Neutrophil extra-cellular trap formation is associated with IL-1β and autophagy-relat-ed signaling in gout. PLoS One 2011; 6: e29318.
33. Schorn C, Janko C, Krenn V, et al. Bonding the foe – NETting neutro-phils immobilize the pro-inflammatory monosodium urate crystals. Front Immunol 2012; 3: 376.
34. Li X, Ji Y, Kang J, Fang N. Association between blood neutro-phil-to-lymphocyte ratio and severity of coronary artery disease: Evidence from 17 observational studies involving 7017 cases. Medi-cine (Baltimore) 2018; 97: e12432.
35. Diakos CI, Charles KA, McMillan DC, et al. Cancer-related inflamma-tion and treatment effectiveness. Lancet Oncol 2014; 15: e493–503.
36. Hartman ES, Brindley EC, Papoin J, et al. Increased Reactive Oxygen Species and Cell Cycle Defects Contribute to Anemia in the RASA3 Mutant Mouse Model scat. Front Physiol 2018; 9: 689.
37. Kanda J, Mizumoto C, Kawabata H, et al. Serum hepcidin level and erythropoietic activity after hematopoietic stem cell transplantation. Haematologica 2008; 93: 1550–4.
38. Kroot JJ, Tjalsma H, Fleming RE, et al. Hepcidin in human iron disor-ders: diagnostic implications. Clin Chem 2011; 57: 1650–69.
39. Nam JS, Ahn CW, Kang S, et al. Red Blood Cell Distribution Width Is Associated with Carotid Atherosclerosis in People with Type 2 Dia-betes. J Diabetes Res 2018; 2018: 1792760.