ISSN :2394-2231 http://www.ijctjournal.org Page 36
Complex Background Image Detection and Processing Based on
Machine Vision
Lei Tai*
*(College of Information&Science, Jinan University, Guangzhou, China)
---
************************
---Abstract:
This paper suggests a new method that generates sampling point along the guide line for linear contour defect detection and recognition. The method registers the vector data with the measured image to generate sampling points that can cover the contour accurately. Next, these sampling points are saved into a test file for quick batch detection of the same products. Then pictures are taken to eliminate the complex background noise on the objects to carry out a series of image pretreatment. On this basis, the algorithm that using SUSAN Operator is used to determine the location of the sampling points. Also, the potential defects are identified and classified. The method has good adaptability to the detection of linear image contour. It is of high application value due to reliability and real-time capability.
Keywords —Machine Vision, Defect Detection, Vector File, Image Contour
---
************************
---I. INTRODUCTION
The main features of the machine vision is to improve production flexibility and automation, in some not suitable for manual operation of the risk environment or the human eye is difficult to meet the requirements of the occasion, machine vision has become a better alternative to artificial vision; at the same time in the scale of industrial production, artificial visual inspection of industrial product quality and low efficiency the poor precision, while the application of machine vision detection can greatly improve the detection efficiency and the degree of automation of production. And the machine vision is easy to realize the collection and integration of information, which is an important link in the realization of computer integrated manufacturing[1].
As one of the most important industrial applications of laser technology, laser cutting has become the main cutting technology of modern manufacturing automation processing. It has been widely applied in various kinds of cutting products, including wood puzzle. But because the laser
cutting machine, power stability table positioning precision and cutting effect to the product properties and the thickness and other factors, after cutting the quality of the finished products difficult to fully guarantee[2]. The main method is to remove the product line by artificial screening, and then reprocess the secondary board. With the laser cutting machine performance and continuously improve the efficiency of manual grading in the present mode of operation has been difficult to adapt to large-scale production needs, the urgent need to automatic detection of the corresponding equipment instead of manual, machine vision and objectivity, non contact and its characteristics of high efficiency and low cost can meet the requirements[3-4].
ISSN :2394-2231 http://www.ijctjournal.org Page 37
with the corresponding reference point to the reference point in the PLT document to calculate the transformation matrix, and the detection point coordinates previously generated by the transfer matrix is projected onto the knife on the road; secondly, by sorting out line defect using the SUSAN operator in the detection point of the tool path; finally, the type of defect judgment, so as to realize the automatic classification of defects. Wood puzzle products is shown in Fig.1.
Fig. 1 wood puzzle products
II. PLTDATAPROCESSING
Different from the traditional strategy to rely on standard image plane domain object defect detection template, a major innovation of this method is through the analytic vector file accurate position coordinates to be detected in ROI region, and then targeted to point to the surface using discrete sampling points to detect the continuous cutting edge. The main operation is shown in Figure 2.
Fig. 2 PLT processing flow
A. PLT format overview
The PLT document is derived from the HP plotter. Because of its characteristics of vector, small files, less system resources and high marking efficiency, it has become the main basis of laser marking. It acts as a transitional file for CAD drawing, and uses HP-GL language to simulate the output of plotters[4].
The data in PLT documents are composed of instruction set and numeric value, so all the information of vector image is retained. The instruction set mainly consists of drawing basic segments, such as line segments, circles, ellipses, arcs, and arbitrary polygons[5].
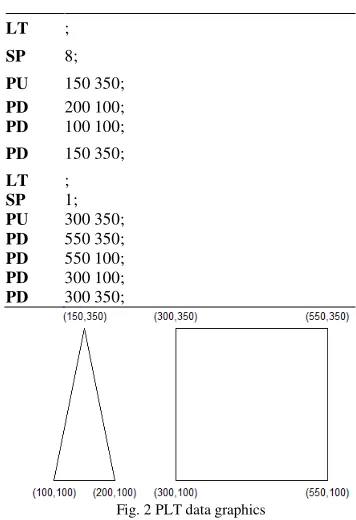
The following number of "PU" or "PD" is the two-dimensional coordinate information that is passed or stayed by the knife. From a "PU" beginning with several "PD" until the next one is not "PD", a polygon graph can be formed by a straight line connection[6]. A segment that starts with "PU" with the end of "PD" is called a cutting segment. Table 1 shows (150,350) to draw a basic HP-GL statement is required for the vertex coordinates of the isosceles triangle and square of length 250, one of the first data segment represented by an isosceles triangle (150,350) pen, after (200,100) (100,100), two points, and then return to the starting point. The PLT graph is shown as shown in Figure 2.
TABLE1PLT DATA FORMAT
LT ;
SP 8;
PU 150 350;
PD 200 100;
PD 100 100;
PD 150 350;
LT ;
SP 1;
PU 300 350;
PD 550 350;
PD 550 100;
PD 300 100;
PD 300 350;
Fig. 2 PLT data graphics
B. Selection of target tool path and corner point
Fig. 3 Selection of target tool path
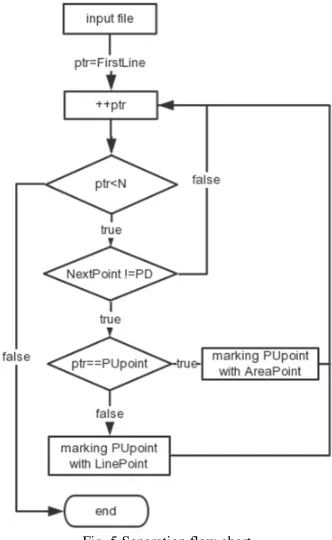
C. Separating line segments and regions
Wooden Jigsaw products ensure that the parts on board are easy to be removed, but not too loose, so that they fall off naturally. As shown in Figure 4, there are usually some small connection points to be kept during cutting to keep the parts and boards in a more stable connection state. The part that needs to be removed from the part is completely treated with a closed knife and does not leave the connection point. This is part of the tool path is composed of a plurality of data segments in the PLT data, and the need to eliminate the knife closed domain is usually only a data description, namely the pen "PU" and the data segment at the end of the "PD" point.
Fig. 4 connection points
Because of the difference in the processing strategy of the cutting line and the cutter domain in the subsequent detection algorithm, the lines and
domains in the data stream are marked respectively when the document is imported.
Fig. 5 Separation flow chart
ISSN :2394-2231 http://www.ijctjournal.org Page 39
domain attributes; otherwise the marked line, said all the coordinates of the data segment in all lines of property. The separation effect is shown in Figure 6
Fig. 6 Separation effect diagram
D. Sampling point generation
After implementing the differentiated operation in line area, the next step is to generate
corresponding line sampling points and domain sampling points on the tool path, and achieve the purpose of detecting continuous line segments or edges with discrete points. The effect is shown in Figure 7.
Fig. 7 Sampling point generation
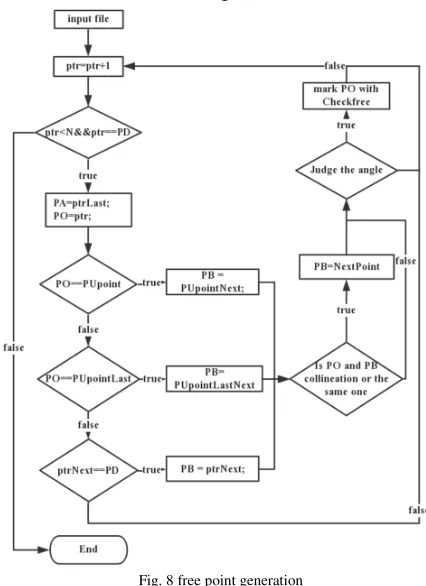
E. The generation and densification of the inspection free
point
In the subsequent use of the edge detection template for processing, if the sampling point is too close to the corner less than equal to the right angle edge, the error will be misjudged to affect the result.
Meanwhile, in view of the fact that most of the wood puzzle defects are continuous large area distribution, and based on a large number of experimental data, it is found that removing the inflection point which only accounts for a small part of the total does not affect the experimental results. Therefore, the operation of eliminating the corner adjacent points to the sampling point is carried out. As shown in Figure 8.
Fig. 8 free point generation
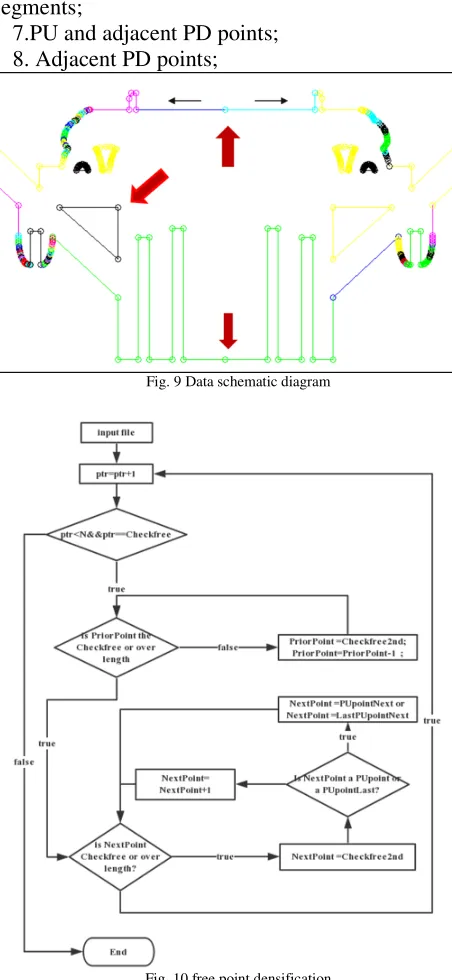
Since the PLT documents generated by Auto CAD in most situations have on the details of the individual part of the modified artificial pruning, the premise leads to the PLT document in a data section of the basic order, there will be irregular scattered arrangement. The following rules are summarized as follows:
1. No concurrent data segments are not collinear, form an angle;
2. Both point to form a closed domain data segment;
3. The coordinate points in the data segment are collinear.
ISSN :2394-2231 http://www.ijctjournal.org Page 40
5. The data segment at the end of the PD and separated by a plurality of data segments of PU points;
6. There are two PU concurrent multiple data segments;
7.PU and adjacent PD points; 8. Adjacent PD points;
Fig. 9 Data schematic diagram
Fig. 10 free point densification
More than 1, 2, 4 cases accounted for the vast majority of PLT document, which is normally only angle judgment data segment for three consecutive points and a plurality of data segments of the data segment parts PU and PD at the end of the data
segment connected to the formation of these three kinds of situations, and domain data segment end to end. Its performance is shown as shown in Figure 9. For the above three conventional and five special cases, the design flow chart is shown in Figure 10. The effect is shown as the highlight of the corner of Figure 11.
Fig. 11 free point
III. IMAGE PREPROCESSING AND MATCHING
The following three characteristics are the following: the material of the board, the dust in the workshop and the real time requirement of the detection system.
1) the contrast between the cutting line and the board background is low.
2) the background noise of the board is large. 3) the resolution of single large scale picture is low.
In order to facilitate subsequent detection, registration points were collected after corresponding image preprocessing, affine transformation of vector data and matching with preprocessed pictures.
The image preprocessing and registration section is shown in Figure 12.
Fig. 12 free point
A. Nonlinear Extension
ISSN :2394-2231 http://www.ijctjournal.org Page 41
relative threshold in subsequent process, we need to draw on the reference value of contrast stretching, so we use the latter.
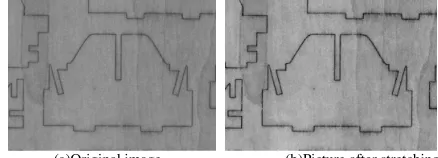
Histogram nonlinear stretching mainly enhances the gray level of the target area and inhibits the gray level of the background or other non target areas, so as to achieve the goal of improving the difference between the target and the background.
< < = f f g M y x f b y x f b M d M b y x f a y x f a b c d a y x f y x f a c y x g ≤ ) , ( ≤ ) , ( -) , ( ≤ ) , ( -) , ( ≤ 0 ) , ( ) , ( (1)
The original image
f
(x
,y
) on [0, ], the gray range of the ROI region is [a,b], and would like tostretch it to the [c,d] interval[9], and the expression
is like (1). The stretching effect is shown in Figure 13.
(a)Original image (b)Picture after stretching Fig. 13 free point
B. Guided filter
Due to the background of the wood wood puzzle compared to other industrial products manufactured with white noise, more involved in surface defect detection, edge information will be serious or even submerged, and taking into account the target area mainly to the main lines, so it is necessary to use the edge preserving filtering method to better noise performance.
In this test, Gauss filtering[10], median filtering[11], bilateral filtering[12] and guided filtering the four commonly used edge preserving filtering algorithm[13], the test found two edge information loss is more serious, the edge preserving effect is good, but the premise in the same SNR, oriented filtering efficiency is better, so choose the latter.
The mathematical expression of the guide filter is as follows:
∑
∈ωi
j ij j
i W I p
q = ( )• ( 2) In (2) type, qirepresentation of the i pixel in the image q, said window to the i pixel as the center of the p, i
p represents the j pixel in the window ω, and ∙ represents the weight of the guided image in the weighted average operation. When I is p itself, the guiding filter has the effect of edge preserving and noise reduction.
C. Morphological processing
In order to extend the line width and improve the reliability of detection, and not cover up the defect information, morphological corrosion treatment is adopted in this paper, so that the tool path can be broadened on the premise that the original defect is preserved.
The mathematical expression of corrosion is as follows } + | { =
ΘS x S x X
X ⊆ (3)
Formula (3) means that the elements of the X are added to all the elements of S, and the result is also X, which is the result of the expansion of X and S. It is specifically described as a set of point X that makes the structure element S moved after its central x is translated into the X[14].
D. Image matching point acquisition
In order to follow the need of affine transformation with vector data, four vertices of the plank and a total of eight points in the middle point of the four edges need to be obtained. The most important step is to fit the edge lines. In order to improve the accuracy of registration, two times of fitting are used.
Step1: rough fitting. In the experiment the author found that due to the wood puzzle path is very compact and close to the border, if the direct use of Hough transform line is easy to make the tool path board interior is counted as the edge, the first use of scanning get edge points and fitting a straight line for vertex.
Step2: locally fuzzy. The rough fitting point of the right angle vertex is obtained by Step1, and the local mean filtering is carried out in the direction of the wood puzzle, and the knife path is smoothed.
ISSN :2394-2231 http://www.ijctjournal.org Page 42
smooth after image obtained by Step2 and the intersection point between the X direction and the longest line in the Y direction is selected.
Step4: gets the four right angles of the target from Step3. The coordinates of X and the Y coordinates of the middle point of the left and right sides of the parallel upper and lower sides are obtained respectively, and the location of the point is scanned along the Y and X directions to get the actual midpoint coordinates.
Because the image acquired by the area array camera will be affected by the distortion produced by the lens and barrel distortion, the strategy of extracting the quadrangle midpoint and affine transformation to cancel the distortion is adopted.
E. Affine transformation
In image registration, vector data coordinates are projected onto the image coordinate system to be measured by affine transformation. Because the two fitting of matching points and the processing of Step4 offset the influence of image distortion, the accuracy of matching is guaranteed[15].
The vector data can get the transformation matrix by its matching points with the pictures to be measured, and then the data of the sampling point can be processed accordingly.
IV. SUSANOPERATOR
Definition: absorption of the nuclear same value area. Move the circular template on the image (see Figure 14). If the difference between the pixel gray in the template and the pixel center of the template is less than a given threshold, it is considered that the point is the same value as the center point, and the area composed of pixels satisfying such conditions is called the absorption core value area (USAN). The USAN area contains the structure information of the image in a local area. The size of the same value kernel reflects the intensity of the local feature of the image[16]. The size of the USAN area in a point in the image can be expressed in the lower form:
(4) (5)
When the circular template is in the background or in the target completely, the area of the USAN area is the largest. When the template moves to the target edge, the area of the USAN area decreases. When the center is at the target edge, the USAN area is very small. When the center is at the target corner, the USAN area is the smallest. With the size of the USAN area on each point of the image as a saliency measure of the feature, the smaller the point of the USAN region the more prominent. The method can detect corner point, intersection point and edge point quickly and without direction. As shown in figures 14 and figure 15.
Fig. 14 Diagram of SUSAN
Fig. 15 Diagram of corner points selecting
V. EXPERIMENTALRESULTSAND ANALYSIS
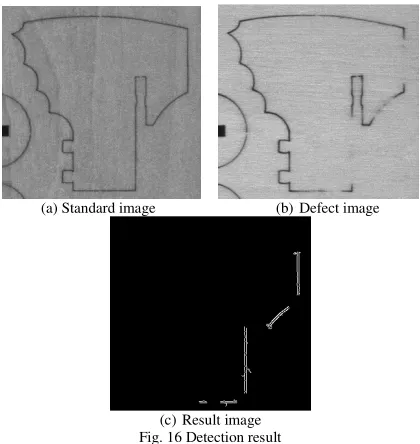
In order to verify the feasibility of the algorithm, a series of experiments were carried out on a microcomputer with thousands of images and multiple sub region cross-correlation tracking algorithms. These images contain a large number of visible light targets with various motion gestures in complex backgrounds.
ISSN :2394-2231 http://www.ijctjournal.org Page 43
(a) Standard image (b) Defect image
(c) Result image Fig. 16 Detection result
VI. CONCLUSIONANDPROSPECT
This paper presents a new method for vector file generating sampling point detection of wood puzzle cutting, and can accurately identify the rapid detection of cutting defects, and high real-time performance, better meet the application requirements of industrial field for real-time detection, of manual detection in reliability and real-time advantages. The detection algorithm is not only for wood puzzle detection, but also for other industrial products which are mainly characterized by line and surface area, such as detection of PCB and FPC. At the same time, the whole detection process of the system is integrated into a set of software with simple operation and friendly
interface, which has great application and popularization prospect in practical application.
REFERENCES
[1] Weiss S A. Machine Vision Exceeds Expectations[J]. About Us, 2009. [2] Zhang L, Ji S, Xie Y, et al. Research on the robot vision system for
Detecting defects of the cover of crystal oscillators[C]// Proceedings of the 7th WSEAS International Conference on Robotics, Control & Manufacturing Technology. World Scientific and Engineering Academy and Society (WSEAS), 2014.
[3] Cho H S, Chi S Y. An inspection method for burrs in an inlet side hole using a low cost vision system[C]// International Conference on Information and Communication Technology Convergence. IEEE, 2015:783-786.
[4] Vaughan T. CAD drawings[J]. Heating/piping/air Conditioning Engineering, 2005, 44(6):503.
[5] Tovey M. Drawing and CAD in industrial design[J]. Design Studies, 1989, 10(1):24-39.
[6] Johansson P, Kliger R. Knowledge reuse in the design of steel connections using 2D-CAD drawings[J]. Electronic Journal of Information Technology in Construction, 2007.
[7] YANG Bi wu, GUO Xiao song, WANG Ke jun, et al. New algorithm of infrared image enhancement based on histogram nonlinear extension[J]. Infrared & Laser Engineering, 2003.
[8] Pizer S M, Amburn E P, Austin J D, et al. Adaptive histogram equalization and its variations[J]. Computer Vision Graphics & Image Processing, 1987, 39(3):355-368.
[9] Maksimenko A. Nonlinear extension of the x-ray diffraction enhanced imaging[J]. Applied Physics Letters, 2007, 90(15):2314.
[10] Geusebroek J M, Smeulders A W M, Weijer J V D. Fast anisotropic Gauss filtering[J]. IEEE Transactions on Image Processing A Publication of the IEEE Signal Processing Society, 2003, 12(8):938-43. [11] Lu Z, Wang F L, Chang Y Q, et al. Region-adaptive median filter[J].
Journal of System Simulation, 2007, 19(23):5411-5414.
[12] Paris S, Durand F. A Fast Approximation of the Bilateral Filter Using a Signal Processing Approach[J]. International Journal of Computer Vision, 2009, 81(1):24-52.
[13] He K, Sun J, Tang X. Guided image filtering[J]. Pattern Analysis & Machine Intelligence IEEE Transactions on, 2013, 35(6):1397-1409. [14] Soille P. Morphological Image Analysis[J]. Computer Physics
Communications, 2010, 132(1):94-103.
[15] Modiano E, Barry R, Swanson E. Improving the Hough Transform gathering process for affine transformations[J]. Pattern Recognition Letters, 2001, 22(9):959-969.