Summer 2011, Volume 2, Number 4
Basic and Clinical
1. Introduction
unctional magnetic resonance imaging (fMRI) is a safe and non-invasive tool to as-sess the brain functions by using the signal changes associated with functional brain ac-tivities. fMRI is a relatively new procedure which measure tiny metabolic changes which occur in an active part of the brain using magnetic resonance im-aging. fMRI is becoming a diagnostic method for learn-ing how normal, disease or injured brain performs, in addition to, for assessing the potential risk of surgery or other invasive treatments on the brain (Poldrack et al., 2011). Neuroscientists and physicians carry out fMRI experiments to determine precisely which part of brain is active for critical functions such as thinking, speech, motion, sensation and attention, to assess the
ef-Statistical Analysis Methods for the fMRI Data
Mehdi Behroozi1, Mohammad Reza Daliri1, Huseyin Boyaci2
1. Biomedical Engineering Department, Faculty of Electrical Engineering, Iran University of Science and Technology (IUST), Narmak, 16846-13114 Tehran, Iran
2. Department of Psychology, Bilkent University, 06800 Ankara, Turkey.
* Corresponding Author:
Mohammad Reza Daliri, PhD., Email: [email protected]
Functional magnetic resonance imaging (fMRI) is a safe and non-invasive way to assess brain functions by using signal changes associated with brain activity. The technique has become a ubiquitous tool in basic, clinical and cognitive neuroscience. This method can measure little metabolism changes that occur in active part of the brain. We process the fMRI data to be able to find the parts of brain that are involve in a mechanism, or to determine the changes that occur in brain activities due to a brain lesion. In this study we will have an overview over the methods that are used for the analysis of fMRI data.
A B S T R A C T
Article info:
Received: 20 April 2011 First Revision: 15 May 2011 Accepted: 10 June 2011
fects of stroke, trauma or degenerative diseases (such as Alzhiemer’s Disease) on brain function, to monitor the growth and the activity of the brain tumor regions and to plan surgery, radiotherapy or other surgical treat-ments of the brain.
After designing an fMRI paradigm and running the ex-periment and the data collection, various analysis steps must be applied on resulting data before the neurosci-entists and physicians can achieve answers to the ques-tions about activities corresponding to the experiment. The goal of computer-based analysis is to determine automatically, those parts of the brain which respond to stimuli that presented to the subjects. The fMRI analysis methods are composed of several basic stages: Pre-pro-cessing, signal detection and description and extraction of the brain connectivity.
Key Words:
fMRI,
Machine Learning, Multi-Voxel Pattern Analysis (MVPA),
General Linear Model (GLM), Independent Component Analysis (ICA),
Principal Component Analysis (PCA).
data and improving the image resolution (Amaro-Jr et al., 2006). After preprocessing, signal detection is car-ried out. The purpose of signal detection is to determine which voxels are activated by the stimulation and it is commonly achieved by applying a test statistic. The out-put of this stage is an activation map which indicates those parts of brain which have been activated in re-sponse to the stimulus. The purpose of signal descrip-tion is modeling the BOLD response shape by several parameters and relating these parameters to the descrip-tion of the stimuladescrip-tion context. Finally, the connectivity analysis tries to estimate brain networks.
The aim of this paper is to provide an overview of sta-tistical analysis methods for fMRI data which have been developed to accomplish the above stages. The paper has been organized as follows: section 2 provides an over-view of the kind of fMRI paradigms (block, event related and mixed design). Section 3 gives an overview of the pre-processing methods that are used in fMRI analysis. Section 4 provides an overview of the statistical analysis methods (univariate and multivariate methods). We pro-vide a summary and conclusions in Section 5.
2. fMRI Paradigms
The different types of stimulus designs are used in the studies of fMRI. There are mainly three types of para-digms for the fMRI experiments namely the blocked, the event-related or the mixed designs. Depending on the type of a study that is performed, one of these stim-uli designs are selected (Amaro-Jr., 2006).
2-1- Blocked Paradigms
In the fMRI experimental paradigm, the block design was the first type that was used. To localize the func-tional brain areas and to study the brain state processes (e.g attention), usually blocked designs are used. The blocked design is several distinct epochs of “on-off” periods (Fig.1a) in which “on “ is referred to stimuli presentation period and “off” is referred to a state of rest or baseline period. The "on-off" periods are alter-nated to reduce the variations that might occur during the experiment (because of subject movements, scan-ner sensitivity or attention shifts). Blocked designs are powerful methods in terms of the signal detection, i.e. to determine which voxels are activated during an experi-ment (Fig1.a).
sponse to mental tasks (Kao, 2009). It differs from blocked paradigm in measuring the individual trial events. In Event-related designs each one of the events can occur at any point in the scanning session. In other words, different trials or stimuli are presented in arbi-trary sequences (Fig1.b). This paradigm has the advan-tage of yielding temporal information about the under-lying neuronal activity.
2-3- Mixed Designs
A combination of block and event-related designs can investigate interaction between processes that work at different time-scales (Otten et al.,2002). This technique is an interesting mixture of the characteristic block de-sign measurement of repetitive sets of stimuli and the transient responses detected by the event-related de-signs. It allows to extract the brain regions exhibiting
Summer 2011, Volume 2, Number 4
Basic and Clinical
an item-related pattern of information processing (tran-sient), or a task-related information processing (sus-tained) ( Donaldson., 2004) (Fig1.c).
3. Pre-Processing
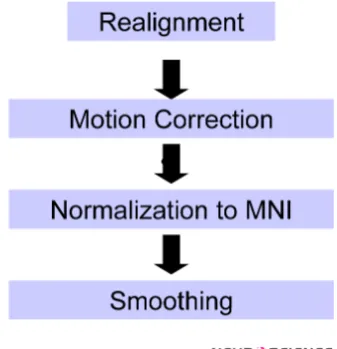
Before statistical analysis and signal detection, it is necessary to improve the signal quality by preprocess-ing the raw data obtained from the MRI scanner, includ-ing artifact detection, baseline correction, movement correction, and image restoration. The pre-processing step applies different image and signal processing tech-niques to reduce the noise and the artifacts of the raw fMRI data. The pre-processing steps are applied indi-vidually in particular orders to the fMRI data (Fig. 2).
the first functional image. Second, these parameters are calculated and they are applied to the functional images. The new voxel values can be obtained by interpolation of the data points.
3-2- Slice Timing Correction
Nearly all fMRI data are collected using two-dimen-sional MRI acquisition, in which the data are acquired one slice at a time, with the timing of the slice acqui-sition evenly spread over the repetition time (TR). In some cases, the slices are acquired in ascending or de-scending order. In another known method as interleaved acquisition, every other slice is acquired sequentially (fig.3). These differences in the acquisition time of dif-ferent voxels are problematic for the analysis of fMRI data. The goal of slice timing correction is to adjust the voxel time series so that common reference timing ex-ists for all voxels. The time corresponding to the first slice is often chosen to be the reference (Henson et al., 1999).
3-3- Intensity Normalization
The goal of the intensity normalization is the rescale of the mean intensity of the fMRI signals in order to compensate for variations of global signal both within sessions and between sessions (Andersson., 1997). In the first case, normalization tries to compensate changes of intensities with time, while in the latter case the com-pensation is for the changes from session to session.
Figure 2. fMRI data preprocessing block diagram.
3.1. Realignment (Motion Correction)
If the subjects move their head during the fMRI exper-iment, the brain position will vary in all time series of functional images. The goal of realignment is to align all functional images to a reference image to have the same coordinate for all voxels in all time series and have com-mon orientation for all images. Normally the first image is chosen as the reference image and then every image in the series will be registered and re-sampled to be in the same orientation as the first image (Andersson et al., 2001). For realignment two steps are considered: First, the head movement can be described by three rotation parameters (x, y, and z axis) and three translation pa-rameters (left-right, up-down, and forward-backward). These parameters are needed for a rigid-body transfor-mation (the size of the brain is kept constant) of the im-ages to a user-selected functional image, that is typically
nal of interest. The temporal filtering deals with each voxel’s time series separately, instead of each (spatial) volume separately, as in spatial filtering and intensity normalization. This step of the pre-processing chain is applied after that all steps of spatial processing is done since temporal filtering like high pass filtering (Hu, 1995) removes the mean signal, which is often critical for the previous stages such as motion correction or in-tensity normalization.
4. Statistical Analysis Methods
At the pre-processing stages, the quality of the fMR images is improved. After that, statistical analysis is at-tempted to determine which voxels are activated by the stimulation. Most fMRI studies are established upon the correlation of hemodynamic response function with stimulation. Activation defines the local intensity changes in the images. These methods can be grouped into two broad categories: the univariate methods (hy-pothesis testing methods), and the multivariate methods (exploratory methods).
The univariate methods attempt to define which vox-els can be characterized as activated given one signal model. This allows the parameterization of the response and then the estimation of the model parameters. The univariate methods are widely used to analyze brain images obtained from fMR imaging. In these methods, signal estimation and the presence or the absence of activation are defined by the statistical test. One of the typical methods is Statistic Parametric Mapping (SPM), which is based upon the hypothesis of linear correla-tion between neuro-activities and the tasks (Friston et al., 1994).
Multivariate methods are also applied to fMRI data analysis, which extract information from dataset, often with any prior knowledge of the experimental condi-tions. They use some structural properties, such as decorrelation, independence, similarity measures, that can discriminate between features of interest present in the data. Unlike the univariate methods which carry out voxel-wise statistical analysis, multivariate methods provide statistical inference about the whole brain so as to describe brain responses in terms of spatial patterns (Pekar et al., 2001). A wide range of multivariate statis-tical methods is being increasingly employed to analyze the fMRI time series. fMRI data are essentially
multi-data. Most of these techniques are based on Singular Value Decomposition (SVD) that assumes separability between time and space. As the distribution of brain re-gions are involved in a task, it seems to be desirable to use the spatially distributed information from different areas to understand a brain function. So the multivariate approaches seem to be interesting in this case to con-sider the spatially distributed information.
4-1- Univariate Analysis
The univariate or voxel based analysis approaches have been traditionally used to analyze neuroimaging data. Here we briefly describe the most common uni-variate approach that is widely used for the fMRI data analysis namely the generalized linear model (GLM).
4-1-1- Generalized Linear Model (GLM)
The GLM approach for the analysis of neuroimag-ing data was first proposed by Friston et al. (Friston et al., 1995) and the vast majority of fMRI data analysis techniques employed by neuroscientists use a GLM of one form or another. The GLM is one of the most com-mon approaches in fMRI statistical analysis which is the construction of a model that describes the way in which the BOLD response depends on the stimulus. In general linear modeling first a model must be set up and then this model has to be fit to the data. It consists of two parts: the fixed effects and the random error. The fixed effects are the part of the model that do not vary if the experiment is repeated. The random error is related to the part that describes how the observations vary, even if the experiment is repeated on the same subject and under the same conditions. The mathematical formula of GLM is given by the following formula:
Y=Xβ+e
Summer 2011, Volume 2, Number 4
Basic and Clinical
(stimuli presented at each time point) are explained by the column of the design matrix of X.
The basic GLM is usually applied under the follow-ing assumptions: voxels are independent, time points are independent, the error variance at each time point is the same, and for every voxel in the brain the same model is allotted (Lazar, 2008). The estimates of β, un-der these assumptions, can be achieved by the ordinary least squares (OLS). Thus, the estimated parameters are given by:
β = (XT X)-1 XT Y
The estimated parameters define how well the model, described in the design matrix, fits the time series of each voxel. The statistical research in fMRI has focused on ways to improving and extending the GLM.
4-2- Multivariate Analysis
In this subsection we briefly describe the most com-mon multivariate methods that are applied for the fMRI data analysis. These approaches include principal com-ponent analysis (PCA), independent comcom-ponent analy-sis (ICA) and multi-voxel pattern analyanaly-sis (MVPA).
4-2-1- Principle Component Analysis (PCA)
The principal component analysis (PCA) is one of the best-known methods for matrix decomposition. The PCA is used in two aims: the data reduction and the interpretation (Press., 2005). The PCA is a statis-tical method to determine a set of components for re-expressing a dataset that are uncorrelated, or orthogonal to one another. The first principal component is corre-sponding to the linear combination of variables in the direction through the original data that has the greatest amount of variance. The second principal component is linear combination of the direction that accounts for the next greatest amount of variance and is uncorrelated (orthogonal) with the first principal component. Further components are the linear combinations that maximize the variability and are orthogonal to all previous ones. The number of components is the minimum of the num-ber of dimensions or observations; in fMRI data, there are generally many more dimensions (voxels) than ob-servations (time points or subjects) so the number of component is equivalent to the number of observations. PCA can also be used as a data reduction technique.
To perform PCA on fMRI data, the data must be rear-ranged into a two dimensional matrix, with voxels as
columns and time-points/subjects as rows. When PCA applied to fMRI data, it will provide a set of components that have a value for each time-point. Each component determines the contribution of a voxel in the data. The PCA of the fMRI data is often carried out through a SVD technique after centering the dataset. SVD simply decomposes the dataset into mutually orthogonal spa-tio-temporal components (Viviani et al., 2005).
4-2-2- Independent Component Analysis (ICA)
When the time course of the hemodynamic response can be inferred apriori, it is useful to utilize model-based approaches. The recent application of indepen-dent component analysis (ICA) to fMRI data has pro-vided a useful approach (McKeown., 1998). When ICA is applied to the fMRI data, the statistically independent components can be derived either in the spatial or in the temporal domain but not in both. The ICA uses in-formation available in higher moments; hence it does not assume normality. Application of ICA involves two main preprocessing steps, data reduction and whitening. Formally, the ICA model is defined as:
X=AS
where X is the signal that we are trying to decompose, S is a set of unknown sources (or components), and A is the unknown mixing matrix that combines the compo-nents to obtain the observed signal. Because both A and S are unknown we will make assumptions about the re-lation between the different components in S. If we as-sume that they are orthogonal and Gaussian, then PCA can solve the problem. However, if the signals from the different sources are not orthogonal and Gaussian then PCA will not be able to find them (Sarty., 2007).
The ICA method has the assumption of statistically in-dependent components in S. In the case of inin-dependent neural processes in fMRI signals, the ICA method has more ability than the PCA approach in identifying the component sources because in this case it is more likely that the components are non-Gaussian.
4-2-3- Multi-Voxel Pattern Analysis (MVPA)
distrib-and track cognitive states distrib-and characterizes how these cognitive states are represented in the brain. In com-pared to the conventional statistical analysis approach-es, MVPA method has the advantage of higher sensitiv-ity in discriminating perceptual and cognitive states.
The basic MVPA method applies the pattern classifi-cation techniques to classify the voxels, where the pat-terns to be classified are vectors of voxel activity values. There are five basic steps in a MVPA approach (fig4):
Step 1. Feature Extraction: In applying pattern clas-sification algorithms to the fMRI data, it is necessary to obtain a good estimate of “activity” at each voxel that forming the feature vector (X), because brain activity measured in response to a stimulus or a cognitive state is represented as a point in a multidimensional space of voxels (MV), so this multidimensional matrix is trans-formed into a long vector of features (voxels) of the ac-tivities.
Step 2. Feature Selection: The performance of pattern recognition applications typically depends on the num-ber and quality of the voxels that are given to the classi-fier. The feature selection approaches choose the voxels that have more information about the mental task. There
Step 3. Pattern Assembly: The third step involves sort-ing the data into discrete ‘brain patterns’ correspondsort-ing to the pattern of activity across the selected voxels at a particular time in the experiment. Brain patterns are labeled according to which experimental condition gen-erated the pattern; this labeling procedure needs to ac-count for the fact that the hemodynamic response mea-sured by the scanner is delayed and smeared out in time, relative to the instigating neural event (Norman., 2006).
Step 4. Classifier Training: The fourth step involves feeding a subset of these labeled patterns into a multi-variate pattern classification algorithm. Based on these patterns, the classification algorithm learns a function that maps between voxel activity patterns and experi-mental conditions. There are different kinds of classi-fiers that can be used for this aim including SVM, NB (Naïve Bayesian), k-NN (k-Nearest Neighbor), LDC (linear discriminant classifier), decision tree classifiers, multilayer perceptron etc. (Kuncheva et al, 2010).
Step 5. Generalization Testing: Given a new pattern of brain activity, this step predicts the label of the experi-mental condition that has generated the activity.
4-3- Connectivity Analysis
Finding the answer to the question "whether two or more regions of the brain are associated with each other" is important. Activation pattern of the blood-oxygen-level-dependent (BOLD) response to task and the strength of the interconnections between function-ally active regions of the brain can be determined by functional connectivity analysis. Effective connectivity analysis allows investigating of how a neural net-work changes in its connections between sites during an experiment. Changes in the connection strength between regions in the brain can occur independently of changes in response amplitude and ex-tent in the region. Structural equation Modeling (SEM) is the technique that is used to estimate the strength of the con-nection between different brain regions (McIntosh et al., 1994). SEM uses a pri-Fig4. Main steps of a generic pattern recognition algorithm as used in fMRI data
Summer 2011, Volume 2, Number 4
Basic and Clinical
ori model for the regions in the network and their con-nections based on anatomical information. Buchel and Friston improved the SEM method (Buchel et al., 1997) to examine modulation of the connectivity between the visual cortex and the posterior parietal by the level of activity of the prefrontal cortex.
Summary and Conclusions
After designing and performing an fMRI experiment, various analysis steps must be applied to the resulting data before the experimenter can get answers to the questions about experimentally related activations at the individual or multi-subject level.
In this paper, we have described the preprocessing stages, univariate and multivariate techniques as em-ployed in functional MRI data analysis. After com-pleting the data collection using the fMRI, first step of analysis is to apply the preprocessing stages to the data to prepare them for different analysis methods. Tradi-tional analysis methods for the fMRI data are univariate or voxel based analysis approaches, which rely exclu-sively on the information contained in the time course of individual voxels. These approaches are limited in their ability to describe differences between groups because they are significantly biased toward detecting group differences that are highly localized in space and linear in nature. Therefore, they are significantly less effective and appropriate in cases for which the group differences are spatially distributed and subtle. Since the fMRI measures the information about the brain activity at thousands of different voxels, the nature of function-al MRI data is multivariate. As the brain functions are considered as activities in a network of different brain areas and regions, and the information is processed in a distributed manner in the brain, the multivariate pattern recognition methods are very proper approaches for a better understanding of brain functions.
Acknowledgement
This project has been carried out by the collaboration between the Iran University of Science and Technology, Tehran, Iran and the Bilkent University, Ankara, Turkey. The authors would like to thank the support from the European Commission Marie Curie International
(Re-integration grant (PIRG-GA-2008-239467)) and the Iran University of Science and Technology.
References
Amaro-Jr, E., Barker, G. J. (2006). Study design in fMRI: Basic principles. Brain and Cognition, 60(3), 220-32.
Andersson, J. L. R., Hutton, C., Ashburner, J., Turner, R., & Fris-ton, K. (2001). Modelling geometric distortions in EPI time series. NeuroImage, 13(5), 903–919.
Andersson, J. L. R. (1997). How to estimate global activity inde-pendent of changes in local activity. NeuroImage, 6:237–244.
Bannister, P. R., Smith, S. M., Brady, M., & Jenkinson, M. (2002). Spatio-temporal realignment of FMRI data. In Eighth Int. Conf. on Functional Mapping of the Human Brain.
Buchel, C., & Friston, K. J. (1997). Modulation of connectivity in visual pathways by attention: Cortical interactions evalu-ated with structural equation modeling and fMRI. Cerebral Cortex , 7(8), 768–778.
Donaldson, D.I. (2004). Parsing brain activity with fMRI and mixed designs: what kind of a state is neuroimaging in?Trends in Neuroscience, 27, 442–444.
Formisano, E., Martino, F.D., Valente, G. (2008). Multivariate analysis of fMRI time series: classification and regression of brain responses using machine learning. Magnetic Reso-nance Imaging, 26, 921–934.
Friston, K. J., Worsley, K. J., Frackowiak, R. S. J., Mazziotta, J. C., & Evans, A.C. (1994). Assessing the significance of focal ac -tivations using their spatial extent. Human Brain Mapping, 1:214–220.
Friston, K. J., Holmes, A., Worsley, K. J., Poline, J. P., Frith, C. D., Frackowiak, R. S. J. (1995). Statistical parametric map-ping: a general linear approach. Human Brain Mapping, 2, 189–210.
Friston, K.J., Jezzard, P., & Turner, R.(1994). The analysis of functional MRI time-series. Human Brain Mapping, 1, 153-171.
Hu, X., Le, T.H., Parrish, T., & Erhard, P. (1995). Retrospec-tive estimation and correction of physiological fluctuation in functional MRI. Magnetic Resonance in Medicine, 34(2), 201–212.
Henson, R. N. A., Buchel, C., Josephs, O., & Friston, K. J. (1999). The slice-timing problem in event-related fMRI. NeuroIm-age, 9, 125.
Kao, M. H. (2009). Multi-objective Optimal Experimental De-signs for ER-fMRI Using Matlab. Journal of Statistical Soft-ware, 30(11), 1-13.
Kuncheva, L. I., & Rodríguez, J. J. (2010). Classifier ensembles for fMRI data analysis: an experiment. Magnetic Resonance Imaging, 28, 583–593.
ration Into Independent Spatial Components. Human Brain Mapping, 6, 160-188.
Norman, K. A., Polyn, S. M., Detre, G. J., Haxby, J. V. (2006). Beyond mind reading: multi-voxel pattern analysis of fMRI data. Trends in Cognitive Sciences, 10(9), 424–30.
Otten, L. J., Henson, R. N., & Rugg, M. D. (2002). State-related and itemrelated neural correlates of successful memory en-coding. Nature Neuroscience 5, 1339–1344.
Pekar, J. J., Calhoun, V., Adali, T., & Pearlson, G. D. (2001). Spatial & temporal independent component analysis of fMRI data with two task-related waveforms. Human Brain Map-ping, 13, 43–53.
Poldrack, R. A., Mumford, J. A., Nichols, T. E. (2011). Hand-book of sunctional MRI data analysis. Cambridge University Press.
Press, S. J. (2005). Applied Multivariate Analysis: Using Baye-sian and Frequentist Methods of Inference,(2th ed). Mineola, NY: Dover Publications.
Sarty, G. E. (2007). Computing brain activity maps from fMRI time-series images. cambridge university press.