123
Advances in Science and TechnologyResearch Journal
Volume 9, No. 27, Sept. 2015, pages 123–134
DOI: 10.12913/22998624/59094 Research Article
Received: 2015.07.12 Accepted: 2015.08.05 Published: 2015.09.01
OPTIMIZATION OF POTASSIUM NITRATE BASED SOLID PROPELLANT
GRAINS FORMULATION USING RESPONSE SURFACE METHODOLOGY
Oladipupo Olaosebikan Ogunleye1, Jimoh Olugbenga Hammed2, Solomon Oluyemi Alagbe3
1 Ladoke Akintola University of Technology, Nigeria, e-mail: [email protected]
2 Center for Space Transport and Propulsion, National Space Research and Development Agency, Epe, PMB 1001, Lagos, Nigeria, e-mail: [email protected]
3 Department of Chemical Engineering, Faculty of Engineering and Technology, Ladoke Akintola University of Technology, P.M.B. 4000, Ogbomoso, Nigeria, e-mail: [email protected]
ABSTRACT
This study was designed to evaluate the effect of propellant formulation and geometry on the solid propellant grains internal ballistic performance using core, bates, rod and
tubular and end-burn geometries. Response Surface Methodology (RSM) was used to
analyze and optimize the effect of sucrose, potassium nitrate and carbon on the
cham-ber pressure, temperature, thrust and specific impulse of the solid propellant grains through Central Composite Design (CCD) of the experiment. An increase in potas
-sium nitrate increased the specific impulse while an increase in sucrose and carbon decreased specific impulse. The coefficient of determination (R2) for models of cham
-ber pressure, temperature, thrust and specific impulse in terms of composition and ge
-ometry were 0.9737, 0.9984, 0.9745 and 0.9589, respectively. The optimum specific impulse of 127.89 s, pressure (462201 Pa), temperature (1618.3 K) and thrust (834.83 N) were obtained using 0.584 kg of sucrose, 1.364 kg of potassium nitrate and 0.052 kg of carbon as well as bate geometry. There was no significant difference between the
calculated and experimented ballistic properties at p < 0.05. The bate grain geometry
is more efficient for minimizing the oscillatory pressure in the combustion chamber.
Keywords: propellant grains, specific impulse, grains performance, combustion in -stability, geometry.
INTRODUCTION
Solid Rocket Motor (SRM) comprises of a combustion chamber, nozzle, and grain [1]. A complex interrelationship between these three sub-systems and their proper integration determine the performance of a particular SRM mission [2]. Ef -fort to minimize the pressure and friction losses of internal and external flows may increase the range or payload capacity of SRM. Performance charac-teristics, envelope constraints and mission profile are important considerations in combustion cham-ber design and these are hinged on grain design and burning surface of the propellant grains [3].
The nozzle is another important component of rockets because its efficiency significantly af
-fects rocket’s performance. By minimizing the losses in the nozzle, the thrust of a rocket can be increased by keeping the grain geometry fixed [3]. Specification of limiting conditions is another challenging task for a designer to prevent failures from excessive deformation of the propellant; over pressurization due to propellant cracking; casing burn-through due to premature exposure of the insulation because of the grain structural failure or the propellant-insulation-motor casing bond failure [4].
124
and up to 20% of metal [5, 6]. When metalized propellants burn, a complex process of aggrega-tion to agglomeraaggrega-tion takes place at the burning surface. Condensed combustion products that leave the burning surface are released in the gas phase where combustion process keeps progress-ing while they move towards the nozzle [7]. The rocket motor’s operation in terms of volumetric efficiency and average pressure over the course of the burn depends combustion characteristics of the propellants, its burning rates, burning surface and grain geometry [4, 8, 9, 10].
In the modern solid propellants, the oxidant is usually one of the inorganic salts such as po-tassium nitrate, chlorates and perchlorates and the fuels sometimes include sulphur while carbon serves as the organic binder. The various combina-tions of propellants ingredients are meant to give burning stability and storage stability. The pres-ence of carbon and the byproducts of inorganic oxidants, potassium and sodium salts produces a higher molecular weight and hence lower exhaust velocity. This affects the performance of the noz-zle in converting heat energy into gas flow [11]. The overall thrust profile can be controlled by the shape of the grains as well as the stability of the thrust. The stability of the thrust is determined by the rate at which the surface of the burning grain is consumed which itself is a function of pressure in the combustion chamber. Therefore, the pressure and thrust are dependent on the recession rate and the area of the burning surface [8, 11].
Propellant grains, based on their combustion surfaces, can be classified as regressive, neutral and progressive burning. If there is a central core, it is usually a neutral burning grain; cylindrical, spherical and cubical grains exhibit regressive burning. And, multi-perforated grains are usu-ally progressive burning [8, 12]. Temperature and pressure of the combustion chamber as well as solid propellant compositions are also important parameters affecting the burn rate [9]. Also, as initial temperature and pressure of the combus-tion chamber increased, the burn rate increased. With that, as the fuel temperature increased, the end pressure also increased which shortened the combustion duration [13]. Other studies whose burn rate, combustion surface and pressure re-lations have been investigated in a wide range of pressures includes Meda et al. [14], Song et al.[15] and found that burn rate increased not only by increasing pressure but also combustion surface area.
Many approaches, starting from gradient methods to basic heuristics, especially tailored meta-heuristics and hybrid heuristics, have been used for design and optimization process of SRM system parameters and sub-components. Design and optimization of SRM have evolved from several previous studies [16 – 28]. How-ever, there is a need to improve SRM modelling and the application of optimization technique to relate various factors like geometries and com-position to the performance of the SRM. Present research effort proposes a solution strategy us-ing Response Surface Methodology (RSM) [29] in trying to improve the design process consider-ing both modellconsider-ing and optimization issues. The solid propellant grains considered for this study are hollow-cylindrical, bates, rod and tubular and end burn grains. Response surface method-ology (RSM) has been shown to be an effective tool for optimizing a process as highlighted by various authors [29, 30].
MATERIALS AND METHODS
Propellant preparation
125
Advances in Science and Technology Research Journal Vol. 9 (27) 2015
Static firing test
The prepared propellant was inserted into the combustion chamber of the De Laval nozzle SRM where it was ignited. The combustion process pro-duced the energy that was converted to the thrust propelling the rocket to predetermined altitude. The ballistic states of the combustion process measured were pressures (MPa), temperature (K), thrust (N) and specific impulse using data acquisition system connected with rocket motor chamber. The specific impulse, ISP is the thrust per unit weight flow rate of the propellant expressed as shown on equation (1). The static firing tests were carried out for com -bustion process at the Centre for Space Transport and Propulsion, Epe, Lagos.
Isp = F/w (1)
Experimental design
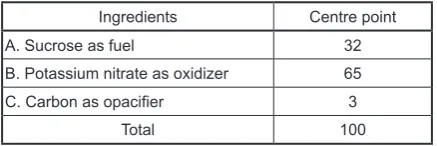
In this study Central Composite Design (CCD) in RSM using Design expert software was used to design and optimise the experiment. The design was based on the fact that each of the chamber pressure, temperature, thrust and specific impulse of the SRM is functionally related to specific pro -pellant formulation and geometry. Multiple re-gression equation describing ballistic properties in terms of composition and geometry were fit -ted. List of ingredients in the descending order of assumed importance as a propellant composition are as presented on Table 1. The composition of propellant has the following form: A (Sucrose) + B (Potassium Nitrate) + C (Carbon) = 100%. This equation implies mathematical linear dependence of the variables if the amounts of ingredients are used directly as variables, from the equation, the quantity of any ingredient is uniquely determined by the amounts of the other two. To function in a multiple factor analysis, these ingredients were transformed into ratios, which can be varied inde-pendently for mathematical consistency. For this experiment, the ingredients ratios were selected as the xivariables as shown on equation (2) – (3):
Table 1: Propellant Formulation at the Design Centre Point Ingredients Centre Point
A. Sucrose as fuel 32
B. Potassium Nitrate as oxidizer 65 C. Carbon as opacifier
Total 3 100 471 . 0 ) (
1 A BC
x (2)
667 . 21 2 B C
x (3)
A centre point for the design was selected with ingredients at levels expected to yield, at least, satisfactory experimental results. With the centre composition selected, the normal xi ratios were calculated by using the normal weight composition of the formulation given in Table 1. The design depended upon the symmetrical selection of variation increments about the centre composition. These levels of variation were chosen to be within the range of formulation, and the increments were carefully selected, as interpretation of the result valid only within the experimental limits. The increments of variation for each variable spaced around the centre point ratios, along with the equations relating the actual and coded ratios, are presented in Table 2. By substituting these equations, compositions were coded for solution of the multiple regression equations. The coded level equations are as shown in equations (4) – (5).
Table 2: Experimental Values for the Experimental Design Ingredients Xi coded levels
(xi) ±Increment -1 0 1
x1 ±0.2 0.377 0.471 0.565
x2 ±0.2 17.334 21.667 26.000
Where xi and coded Xi ratios are related by the following equations:
2 . 0 ) 471 . 0 ( 1 1 x
X (4)
) 667 . 21 ( 2 2 x
X (5) (2)
Table 1: Propellant Formulation at the Design Centre Point Ingredients Centre Point
A. Sucrose as fuel 32
B. Potassium Nitrate as oxidizer 65 C. Carbon as opacifier
Total 3 100 471 . 0 ) (
1 A BC
x (2)
667 . 21 2 B C
x (3)
A centre point for the design was selected with ingredients at levels expected to yield, at least, satisfactory experimental results. With the centre composition selected, the normal xi ratios were
calculated by using the normal weight composition of the formulation given in Table 1. The design depended upon the symmetrical selection of variation increments about the centre composition. These levels of variation were chosen to be within the range of formulation, and the increments were carefully selected, as interpretation of the result valid only within the experimental limits. The increments of variation for each variable spaced around the centre point ratios, along with the equations relating the actual and coded ratios, are presented in Table 2. By substituting these equations, compositions were coded for solution of the multiple regression equations. The coded level equations are as shown in equations (4) – (5).
Table 2: Experimental Values for the Experimental Design Ingredients Xi coded levels
(xi) ±Increment -1 0 1
x1 ±0.2 0.377 0.471 0.565
x2 ±0.2 17.334 21.667 26.000
Where xi and coded Xi ratios are related by the following equations:
2 . 0 ) 471 . 0 ( 1 1 x
X (4)
2 . 0 ) 667 . 21 ( 2 2 x
X (5) (3)
A centre point for the design was selected with ingredients at levels expected to yield, at least, satisfactory experimental results. With the centre composition selected, the normal xi ratios were calculated by using the normal weight composi-tion of the formulacomposi-tion given in Table 1. The
de-sign depended upon the symmetrical selection of variation increments about the centre composition. These levels of variation were chosen to be within the range of formulation, and the increments were carefully selected, as interpretation of the result valid only within the experimental limits. The increments of variation for each variable spaced around the centre point ratios, along with the equa-tions relating the actual and coded ratios, are pre-sented in Table 2. By substituting these equations, compositions were coded for solution of the mul-tiple regression equations. The coded level equa-tions are as shown in equaequa-tions (4) – (5).
Table 1. Propellant formulation at the design centre point
Ingredients Centre point A. Sucrose as fuel 32 B. Potassium nitrate as oxidizer 65 C. Carbon as opacifier 3
Total 100
Table 2. Experimental values for the experimental de -sign
Ingredients Xi coded levels
(xi) ±Increment -1 0 1
x1 ±0.2 0.377 0.471 0.565
x2 ±0.2 17.334 21.667 26.000
Where xi and coded Xi ratios are related by the following equations:
Table 1: Propellant Formulation at the Design Centre Point Ingredients Centre Point
A. Sucrose as fuel 32
B. Potassium Nitrate as oxidizer 65 C. Carbon as opacifier
Total 3 100 471 . 0 ) (
1 A BC
x (2)
667 . 21 2 B C
x (3)
A centre point for the design was selected with ingredients at levels expected to yield, at least, satisfactory experimental results. With the centre composition selected, the normal xi ratios were calculated by using the normal weight composition of the formulation given in Table 1. The design depended upon the symmetrical selection of variation increments about the centre composition. These levels of variation were chosen to be within the range of formulation, and the increments were carefully selected, as interpretation of the result valid only within the experimental limits. The increments of variation for each variable spaced around the centre point ratios, along with the equations relating the actual and coded ratios, are presented in Table 2. By substituting these equations, compositions were coded for solution of the multiple regression equations. The coded level equations are as shown in equations (4) – (5).
Table 2: Experimental Values for the Experimental Design Ingredients Xi coded levels
(xi) ±Increment -1 0 1
x1 ±0.2 0.377 0.471 0.565
x2 ±0.2 17.334 21.667 26.000
Where xi and coded Xi ratios are related by the following equations:
2 . 0 ) 471 . 0 ( 1 1 x
X (4)
2 . 0 ) 667 . 21 ( 2 2 x
X (5) (4)
Table 1: Propellant Formulation at the Design Centre Point Ingredients Centre Point
A. Sucrose as fuel 32
B. Potassium Nitrate as oxidizer 65 C. Carbon as opacifier
Total 3 100 471 . 0 ) (
1A BC
x (2)
667 . 21 2 B C
x (3)
A centre point for the design was selected with ingredients at levels expected to yield, at least, satisfactory experimental results. With the centre composition selected, the normal xi ratios were calculated by using the normal weight composition of the formulation given in Table 1. The design depended upon the symmetrical selection of variation increments about the centre composition. These levels of variation were chosen to be within the range of formulation, and the increments were carefully selected, as interpretation of the result valid only within the experimental limits. The increments of variation for each variable spaced around the centre point ratios, along with the equations relating the actual and coded ratios, are presented in Table 2. By substituting these equations, compositions were coded for solution of the multiple regression equations. The coded level equations are as shown in equations (4) – (5).
Table 2: Experimental Values for the Experimental Design Ingredients Xi coded levels
(xi) ±Increment -1 0 1
x1 ±0.2 0.377 0.471 0.565
x2 ±0.2 17.334 21.667 26.000
Where xi and coded Xi ratios are related by the following equations:
2 . 0 ) 471 . 0 ( 1 1 x
X (4)
2 . 0 ) 667 . 21 ( 2 2 x
X (5) (5)
126
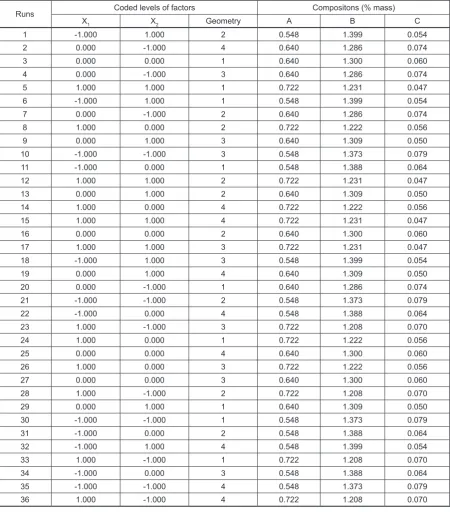
Table 3. Central composite design arrangement for propellant formulation
Runs Coded levels of factors Compositons (% mass)
X1 X2 Geometry A B C
1 -1.000 1.000 2 0.548 1.399 0.054
2 0.000 -1.000 4 0.640 1.286 0.074
3 0.000 0.000 1 0.640 1.300 0.060
4 0.000 -1.000 3 0.640 1.286 0.074
5 1.000 1.000 1 0.722 1.231 0.047
6 -1.000 1.000 1 0.548 1.399 0.054
7 0.000 -1.000 2 0.640 1.286 0.074
8 1.000 0.000 2 0.722 1.222 0.056
9 0.000 1.000 3 0.640 1.309 0.050
10 -1.000 -1.000 3 0.548 1.373 0.079
11 -1.000 0.000 1 0.548 1.388 0.064
12 1.000 1.000 2 0.722 1.231 0.047
13 0.000 1.000 2 0.640 1.309 0.050
14 1.000 0.000 4 0.722 1.222 0.056
15 1.000 1.000 4 0.722 1.231 0.047
16 0.000 0.000 2 0.640 1.300 0.060
17 1.000 1.000 3 0.722 1.231 0.047
18 -1.000 1.000 3 0.548 1.399 0.054
19 0.000 1.000 4 0.640 1.309 0.050
20 0.000 -1.000 1 0.640 1.286 0.074
21 -1.000 -1.000 2 0.548 1.373 0.079
22 -1.000 0.000 4 0.548 1.388 0.064
23 1.000 -1.000 3 0.722 1.208 0.070
24 1.000 0.000 1 0.722 1.222 0.056
25 0.000 0.000 4 0.640 1.300 0.060
26 1.000 0.000 3 0.722 1.222 0.056
27 0.000 0.000 3 0.640 1.300 0.060
28 1.000 -1.000 2 0.722 1.208 0.070
29 0.000 1.000 1 0.640 1.309 0.050
30 -1.000 -1.000 1 0.548 1.373 0.079
31 -1.000 0.000 2 0.548 1.388 0.064
32 -1.000 1.000 4 0.548 1.399 0.054
33 1.000 -1.000 1 0.722 1.208 0.070
34 -1.000 0.000 3 0.548 1.388 0.064
35 -1.000 -1.000 4 0.548 1.373 0.079
36 1.000 -1.000 4 0.722 1.208 0.070
to ordinal categorical variable for ease of math-ematical analysis. The resulting weights for each ingredient in different propellant formulation are as presented in Table 3.
1 1
1
x
x
A
+
=
(6)2 2
1
)
1
(
x
A
x
B
+
−
=
(7)2
1
1
x
A
C
+
−
=
(8)Data analysis and optimization
Multiple regression analysis was used to fit the model represented by equation (9) to the ex -perimental data. In order to analyze the experi-mental design by RSM, it was assumed that there existed a mathematical function, fh (h = 1, 2, ..., n) for each response variable, Yh in term of m inde-pendent ballistic variable Xi (i = 1, 2, ..., n).
127
Advances in Science and Technology Research Journal Vol. 9 (27) 2015
In this experiment, n = 2 and m = 4. In order to approximate this function a second order poly-nomial equation (10) was assumed.
j i m
j
i h
i m
i h
i m
i h
h
h b b X b X b X X
Y o
∑
i∑
ii∑
ij= ≠ =
=
+ +
+ =
1 2
1
1 (10)
Where bho is the value of fitted response at the centre point of the design, i.e. (0, 0) and bhi, bhiiand
ij
b are linear, quadratic and cross product regres-sion term respectively.
Maximization and minimization of the poly-nomial thus fitted was performed by numerical techniques, using the mathematical optimizer procedure of Design Expert 6.8 that deals with constraints. The constraints are set to get the cod-ed value of a variable between the lower and up-per limits for an optimum response (a minimum and a maximum level must be provided for each parameter included). The response surfaces and perturbation plots for these models were plotted as a function of two variables, while keeping the other variables at the optimum level.
RESULTS AND DISCUSSION
Effects of propellant formulation and geom -etry on ballistic properties.
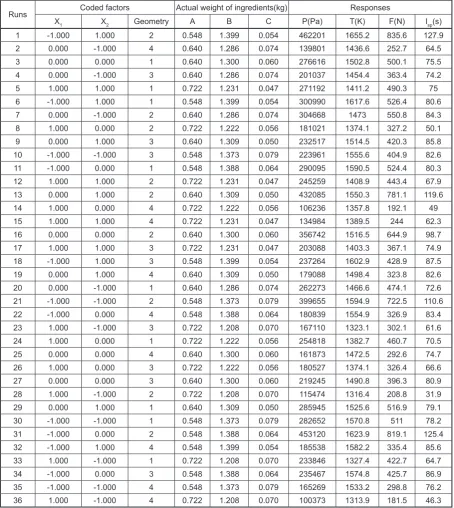
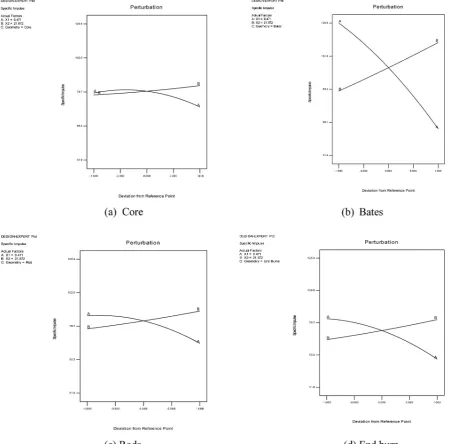
The effects of various propellant formula-tion and geometry on the internal ballistic prop-erties of the SRM as obtained from static firing tests are as presented in Table 4. Considering the four geometries studied, chamber pressure, chamber temperature, thrust and specific impulse decreased with increasing sucrose while they all increased with increasing potassium nitrate. However, as pointed out by Sutton and Biblarz, [8] and Turner [11] and, the fundamental require-ment of a SRM is to develop very high thrust per mass. This then shows the importance of the spe-cific impulse in the discussion of the SRM per -formance and that since the effect of the other three are directly linked to it, its trend can simply be used to explain that of others. The general in-crement of specific impulse with the increase in potassium nitrate is due to the presence of more oxidizer to improve the efficiency of combustion in the chamber thereby increasing the conversion of heat energy to thrust and reducing the weight of the particles that are byproducts of combus-tion. This finding is in line with the result of Wu
et al. [13] and Richards [31]. Bates grains had the highest specific impulse within the range of
solid propellant formulations verified with the fir -ing static test. The bates grains burnt within 3 s with maximum specific impulse of 127.9 s when compared with other grains considered such as Hollow-Cylindrical core grains that also burnt in 3.5 s but with the specific impulse of 80.6s, Rod and Tubular burnt in 4 s with specific impulse of 86.9 s and End Burn grains burnt in 5 s with spe -cific impulse of 85.6 s. The best spe-cific impulse was achieved in bates grains because much more surface area was exposed to burning which actu-ally accounted for its lowest burn time compared with other grains geometry. This is in agreement with some previous works [4, 8, 9, 10, 32]. The perturbation graph of the four geometries show-ing the variation of specific impulse with varyshow-ing propellant compositions are as shown on Figure 1. From this observation, as more surface area is being exposed to burning, there will be cor-responding increase in specific impulse and by implication thrust of a propellant. This will auto-matically reduce the pressure, increase burn rate, reduce erroneous burning and enhanced the com-bustion stability of the SRM.
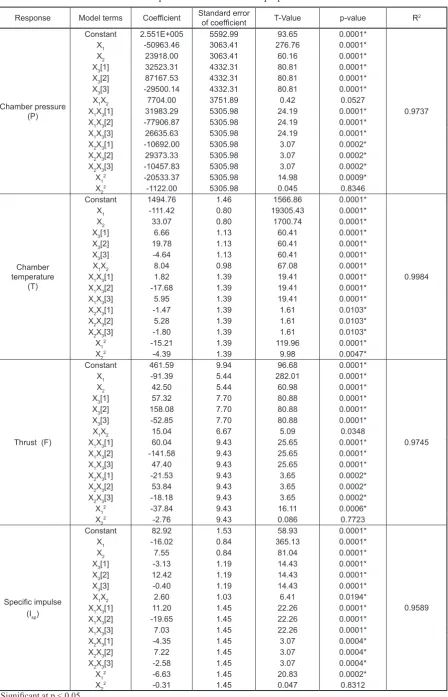
Estimation of the fitted models parameters In developing the mathematical models for ballistic internal properties (chamber pressure, chamber temperature, thrust and specific im -pulse) of the solid propellant, multiple regression analyses were conducted in obtaining the models. All main effects, linear and quadratic, and inter-action were estimated for each model. The coef-ficients of each factor as well as the coefficient of determination obtained for each model are as presented on Table 5. The square of the coeffi -cients of regression (R2) for chamber pressure,
128
Table 4. Effects of the propellant formulation on ballistic properties
Runs Coded factors Actual weight of ingredients(kg) Responses
X1 X2 Geometry A B C P(Pa) T(K) F(N) Isp(s)
1 -1.000 1.000 2 0.548 1.399 0.054 462201 1655.2 835.6 127.9 2 0.000 -1.000 4 0.640 1.286 0.074 139801 1436.6 252.7 64.5 3 0.000 0.000 1 0.640 1.300 0.060 276616 1502.8 500.1 75.5 4 0.000 -1.000 3 0.640 1.286 0.074 201037 1454.4 363.4 74.2 5 1.000 1.000 1 0.722 1.231 0.047 271192 1411.2 490.3 75 6 -1.000 1.000 1 0.548 1.399 0.054 300990 1617.6 526.4 80.6 7 0.000 -1.000 2 0.640 1.286 0.074 304668 1473 550.8 84.3 8 1.000 0.000 2 0.722 1.222 0.056 181021 1374.1 327.2 50.1 9 0.000 1.000 3 0.640 1.309 0.050 232517 1514.5 420.3 85.8 10 -1.000 -1.000 3 0.548 1.373 0.079 223961 1555.6 404.9 82.6 11 -1.000 0.000 1 0.548 1.388 0.064 290095 1590.5 524.4 80.3 12 1.000 1.000 2 0.722 1.231 0.047 245259 1408.9 443.4 67.9 13 0.000 1.000 2 0.640 1.309 0.050 432085 1550.3 781.1 119.6 14 1.000 0.000 4 0.722 1.222 0.056 106236 1357.8 192.1 49 15 1.000 1.000 4 0.722 1.231 0.047 134984 1389.5 244 62.3 16 0.000 0.000 2 0.640 1.300 0.060 356742 1516.5 644.9 98.7 17 1.000 1.000 3 0.722 1.231 0.047 203088 1403.3 367.1 74.9 18 -1.000 1.000 3 0.548 1.399 0.054 237264 1602.9 428.9 87.5 19 0.000 1.000 4 0.640 1.309 0.050 179088 1498.4 323.8 82.6 20 0.000 -1.000 1 0.640 1.286 0.074 262273 1466.6 474.1 72.6 21 -1.000 -1.000 2 0.548 1.373 0.079 399655 1594.9 722.5 110.6 22 -1.000 0.000 4 0.548 1.388 0.064 180839 1554.9 326.9 83.4 23 1.000 -1.000 3 0.722 1.208 0.070 167110 1323.1 302.1 61.6 24 1.000 0.000 1 0.722 1.222 0.056 254818 1382.7 460.7 70.5 25 0.000 0.000 4 0.640 1.300 0.060 161873 1472.5 292.6 74.7 26 1.000 0.000 3 0.722 1.222 0.056 180527 1374.1 326.4 66.6 27 0.000 0.000 3 0.640 1.300 0.060 219245 1490.8 396.3 80.9 28 1.000 -1.000 2 0.722 1.208 0.070 115474 1316.4 208.8 31.9 29 0.000 1.000 1 0.640 1.309 0.050 285945 1525.6 516.9 79.1 30 -1.000 -1.000 1 0.548 1.373 0.079 282652 1570.8 511 78.2 31 -1.000 0.000 2 0.548 1.388 0.064 453120 1623.9 819.1 125.4 32 -1.000 1.000 4 0.548 1.399 0.054 185538 1582.2 335.4 85.6 33 1.000 -1.000 1 0.722 1.208 0.070 233846 1327.4 422.7 64.7 34 -1.000 0.000 3 0.548 1.388 0.064 235467 1574.8 425.7 86.9 35 -1.000 -1.000 4 0.548 1.373 0.079 165269 1533.2 298.8 76.2 36 1.000 -1.000 4 0.722 1.208 0.070 100373 1313.9 181.5 46.3
the regression coefficients that are not significant at 95% were discarded while only those that are significant were selected for the models of cham -ber pressure, cham-ber temperature, thrust and specific impulse as shown in equations (11) – (14)
2 1 3 2 3 2 3 2 3 1 3 1 3 1 3 3 3 2 1 20533.37X -[3] X 10457.83X -[2] X 29373.33X [1] X 10692.00X -[3] X 26635.63X [2] X X 77906.87 -[1] X 31983.29X [3] X 29500.14 -[2] 87167.53X [1] 32523.31X X 23918.00 X 50963.46 -005 2.551E P (11) 2 2 2 1 3 2 3 2 3 2 3 1 3 1 3 1 2 1 3 3 3 2 1 4.39X 15.21X -[3] X 1.80X -[2] X X 28 . 5 [1] X 1.47X -[3] X X 95 . 5 [2] X 17.68X -[1] X X 82 . 1 04 . 8 [3] X 4.64 -[2] X 78 . 19 [1] X 66 . 6 X 07 . 33 111.42X -1494.76 X X T (12) 2 1 3 2 3 2 3 2 3 1 3 1 3 1 3 3 3 2 1 37.84X -[3] X X 18.18 -[2] X X 84 . 53 [1] X 21.53X -[3] X X 40 . 47 [2] X X 141.58 -[1] X X 04 . 60 [3] X 52.85 -[2] X 08 . 158 [1] X 32 . 57 X 50 . 42 X 91.39 - 461.59 F (13) 2 1 3 2 3 2 3 2 3 1 3 1 3 1 2 1 3 3 3 2 1 0.31X -[3] X X 2.58 -[2] X X 22 . 7 [1] X 4.35X -[3] X X 03 . 7 [2] X X 19.65 -[1] X X 20 . 11 60 . 2 [3] 0.40X -[2] X 42 . 12 [1] X 13 . 3 X 55 . 7 X 02 . 16 92 . 82 X X Isp (14)
As shown on the equations (11) –(14), most of the linear, quadratic and interaction terms of the models were significant. This models showed that the composition ratio and by implication the actual composition and the geometries all have effect on the final properties of the SRM internal system. The inclusion of sucrose, potassium nitrates and the geometry had various effects on the final performance of the SRM in terms of the ballistic properties. Increasing the amount of sucrose in the composition reduces all the three properties while any increment in potassium nitrate increases their value. These fitted models were tested for adequacy and consistency using Analysis of Variance (ANOVA) and the values of various computation are as presented on Table 6. The results from the
ANOVA revealed that the F-values for chamber pressure, temperature, thrust and specific impulse are
675.03, 714.48, 694.02 and 592.74, respectively. These are significant at the 95 % level. Also, using
diagnostic plot of residual value against the actual value, there were no outlier in the plot and this confirms the stability of the model.
(11)
(12)
129
Advances in Science and Technology Research Journal Vol. 9 (27) 2015
Table 5. Estimated coefficients of the response models for ballistic properties
Response Model terms Coefficient Standard error of coefficient T-Value p-value R2
Chamber pressure (P)
Constant 2.551E+005 5592.99 93.65 0.0001*
0.9737 X1 -50963.46 3063.41 276.76 0.0001*
X2 23918.00 3063.41 60.16 0.0001*
X3[1] 32523.31 4332.31 80.81 0.0001*
X3[2] 87167.53 4332.31 80.81 0.0001*
X3[3] -29500.14 4332.31 80.81 0.0001*
X1X2 7704.00 3751.89 0.42 0.0527
X1X3[1] 31983.29 5305.98 24.19 0.0001*
X1X3[2] -77906.87 5305.98 24.19 0.0001*
X1X3[3] 26635.63 5305.98 24.19 0.0001*
X2X3[1] -10692.00 5305.98 3.07 0.0002*
X2X3[2] 29373.33 5305.98 3.07 0.0002*
X2X3[3] -10457.83 5305.98 3.07 0.0002*
X12 -20533.37 5305.98 14.98 0.0009*
X22 -1122.00 5305.98 0.045 0.8346
Chamber temperature
(T)
Constant 1494.76 1.46 1566.86 0.0001*
0.9984 X1 -111.42 0.80 19305.43 0.0001*
X2 33.07 0.80 1700.74 0.0001*
X3[1] 6.66 1.13 60.41 0.0001*
X3[2] 19.78 1.13 60.41 0.0001*
X3[3] -4.64 1.13 60.41 0.0001*
X1X2 8.04 0.98 67.08 0.0001*
X1X3[1] 1.82 1.39 19.41 0.0001*
X1X3[2] -17.68 1.39 19.41 0.0001*
X1X3[3] 5.95 1.39 19.41 0.0001*
X2X3[1] -1.47 1.39 1.61 0.0103* X2X3[2] 5.28 1.39 1.61 0.0103*
X2X3[3] -1.80 1.39 1.61 0.0103*
X12 -15.21 1.39 119.96 0.0001*
X22 -4.39 1.39 9.98 0.0047*
Thrust (F)
Constant 461.59 9.94 96.68 0.0001*
0.9745 X1 -91.39 5.44 282.01 0.0001*
X2 42.50 5.44 60.98 0.0001*
X3[1] 57.32 7.70 80.88 0.0001*
X3[2] 158.08 7.70 80.88 0.0001*
X3[3] -52.85 7.70 80.88 0.0001*
X1X2 15.04 6.67 5.09 0.0348
X1X3[1] 60.04 9.43 25.65 0.0001* X1X3[2] -141.58 9.43 25.65 0.0001*
X1X3[3] 47.40 9.43 25.65 0.0001*
X2X3[1] -21.53 9.43 3.65 0.0002*
X2X3[2] 53.84 9.43 3.65 0.0002*
X2X3[3] -18.18 9.43 3.65 0.0002*
X12 -37.84 9.43 16.11 0.0006*
X22 -2.76 9.43 0.086 0.7723
Specific impulse (Isp)
Constant 82.92 1.53 58.93 0.0001*
0.9589 X1 -16.02 0.84 365.13 0.0001*
X2 7.55 0.84 81.04 0.0001*
X3[1] -3.13 1.19 14.43 0.0001*
X3[2] 12.42 1.19 14.43 0.0001* X3[3] -0.40 1.19 14.43 0.0001*
X1X2 2.60 1.03 6.41 0.0194*
X1X3[1] 11.20 1.45 22.26 0.0001*
X1X3[2] -19.65 1.45 22.26 0.0001*
X1X3[3] 7.03 1.45 22.26 0.0001*
X2X3[1] -4.35 1.45 3.07 0.0004*
X2X3[2] 7.22 1.45 3.07 0.0004*
X2X3[3] -2.58 1.45 3.07 0.0004*
X12 -6.63 1.45 20.83 0.0002*
X22 -0.31 1.45 0.047 0.8312
130
2 1 3 2 3 2 3 2 3 1 3 1 3 1 3 3 3 2 1 20533.37X -[3] X 10457.83X -[2] X 29373.33X [1] X 10692.00X -[3] X 26635.63X [2] X X 77906.87 -[1] X 31983.29X [3] X 29500.14 -[2] 87167.53X [1] 32523.31X X 23918.00 X 50963.46 -005 2.551E P (11) 2 2 2 1 3 2 3 2 3 2 3 1 3 1 3 1 2 1 3 3 3 2 1 4.39X 15.21X -[3] X 1.80X -[2] X X 28 . 5 [1] X 1.47X -[3] X X 95 . 5 [2] X 17.68X -[1] X X 82 . 1 04 . 8 [3] X 4.64 -[2] X 78 . 19 [1] X 66 . 6 X 07 . 33 111.42X -1494.76 X X T (12) 2 1 3 2 3 2 3 2 3 1 3 1 3 1 3 3 3 2 1 37.84X -[3] X X 18.18 -[2] X X 84 . 53 [1] X 21.53X -[3] X X 40 . 47 [2] X X 141.58 -[1] X X 04 . 60 [3] X 52.85 -[2] X 08 . 158 [1] X 32 . 57 X 50 . 42 X 91.39 - 461.59 F (13) 2 1 3 2 3 2 3 2 3 1 3 1 3 1 2 1 3 3 3 2 1 0.31X -[3] X X 2.58 -[2] X X 22 . 7 [1] X 4.35X -[3] X X 03 . 7 [2] X X 19.65 -[1] X X 20 . 11 60 . 2 [3] 0.40X -[2] X 42 . 12 [1] X 13 . 3 X 55 . 7 X 02 . 16 92 . 82 X X Isp (14)As shown on the equations (11) –(14), most of the linear, quadratic and interaction terms of the models were significant. This models showed that the composition ratio and by implication the actual composition and the geometries all have effect on the final properties of the SRM internal system. The inclusion of sucrose, potassium nitrates and the geometry had various effects on the final performance of the SRM in terms of the ballistic properties. Increasing the amount of sucrose in the composition reduces all the three properties while any increment in potassium nitrate increases their value. These fitted models were tested for adequacy and consistency using Analysis of Variance (ANOVA) and the values of various computation are as presented on Table 6. The results from the
ANOVA revealed that the F-values for chamber pressure, temperature, thrust and specific impulse are
675.03, 714.48, 694.02 and 592.74, respectively. These are significant at the 95 % level. Also, using
diagnostic plot of residual value against the actual value, there were no outlier in the plot and this confirms the stability of the model.
As shown in the equations (11) – (14), most of the linear, quadratic and interaction terms of the models were significant. These models showed that the composition ratio and by im-plication the actual composition and the ge-ometries all have effect on the final properties of the SRM internal system. The inclusion of sucrose, potassium nitrates and the geometry had various effects on the final performance of the SRM in terms of ballistic properties.
In-creasing the amount of sucrose in the composi-tion reduces all the three properties while any increment in potassium nitrate increases their value. These fitted models were tested for ad-equacy and consistency using Analysis of Vari-ance (ANOVA) and the values of various com -putation are as presented in Table 6.
The results from the ANOVA revealed that the F-values for chamber pressure, tempera-ture, thrust and specific impulse are 675.03, 714.48, 694.02 and 592.74, respectively. These are significant at the 95% level. Also, using di -agnostic plot of residual value against the ac-tual value, there were no outlier in the plot and this confirms the stability of the model.
Fig. 1. The effects of varying propellant compositions on the specific impulse for various grain geometries
131
Advances in Science and Technology Research Journal Vol. 9 (27) 2015
Table 6. Analysis of variance for fitted models for specific impulse
Ballistic properties Source of variation Sum of squares d.f. Mean squares F-values Adjusted R2
Chamber Regression 2.95E+11 14 1.52E+11 675.03* 0.9737
Pressure Residual 4.730E+9 21 2.25E+8
Total 3.000E+11 35
Temperature Regression 338550.5 14 331009.7 714.48* 0.9984 Residual 324.10 21 15.43
Total 3.389E+5 35
Thrust Regression 962025.8 14 493284.7 694.02* 0.9745 Residual 14926.05 21 710.76
Total 9.770E+5 35
Specific Regression 14017.68 14 9994.90 592.74* 0.9589 Impulse Residual 354.10 21 16.86
Total 14371.78 35
* Significant level at p < 0.05.
132
Optimization and validation of solid propellant formulation
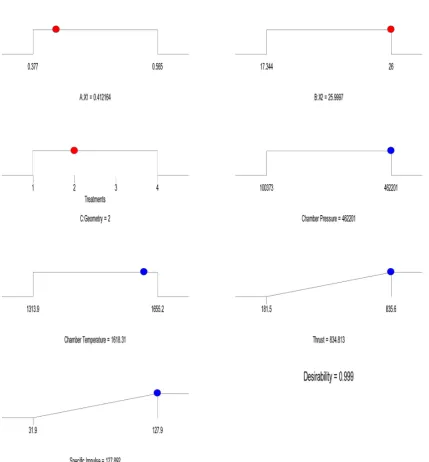
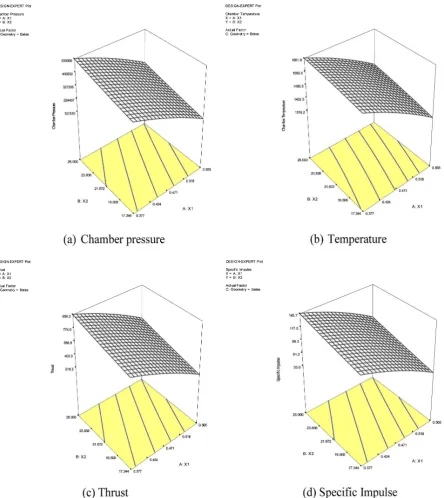
The RSM was used to find the maximum spe -cific impulse and thrust subject to the ranges of the chamber pressure and temperature. The optimum specific impulse obtained was 127.89 s, Cham -ber pressure (462201 Pa), Temperature (1618.31 K), Thrust (834.83 N) at sucrose ratio of 0.4122, potassium nitrate (25.9997) and bate geometry. As shown on the optimization tree Figure 2, the desirability index of the optimization procedure is
Fig. 3. Response surface plots for optimum propellant composition
133
Advances in Science and Technology Research Journal Vol. 9 (27) 2015
Table 7. Optimal propellant formulation
Categories Variables Optimization
Test 1 Test 2
Optimization Criteria for Calculation
Specific Impulse Maximize Maximize
Thrust Maximize Maximize
Pressure Within range Minimize Temperature Within range Minimize
Calculated Optimum Composition and Geometry
X1 0.412 0.539
X2 26.000 26.000
X3 Bate (2) Bate (2)
Calculated Optimum Composition In actual weight
A – Sucrose 0.584 0.700
B – Potassium Nitrate 1.364 1.229
C - Carbon 0.052 0.071
Calculated Optimum Level
Specific Impulse 127.89 82.40
Thrust 834.83 535.78
Pressure 462201 296007
Temperature 1618.31 1452.96
Experimental Optimum Level
Specific Impulse 127.65 ± 0.89 83.10 ± 0.92 Thrust 830.80 ± 1.84 528.90 ± 2.10 Pressure 459897 ± 5.60 295982 ± 3.80 Temperature 1630.2 ± 2.80 1440.60 ± 2.40
t - value 0.996* 2.052*
* Not significant at p < 0.05.
basis of the propellant formulation for the opti-mum mixes and their comparison are as shown on Table 7.
CONCLUSION
The ballistic properties increased with in-crease in potassium nitrate which is the oxidizer and decreased with increase in sucrose. and car-bon. Therefore, potassium nitrate enhanced better specific impulse, which is the measure of propel -lant performance. Response Surface Methodolo-gy was successfully applied to the determination of the optimum formulation of solid propellant grains prepared using potassium nitrate and su-crose as main ingredient. The model predictions were accurate and reliable. Therefore, RSM is a reliable and powerful tool for optimization of solid propellant grains design and bate grain ge-ometry is more efficient for minimizing the oscil -latory pressure in the combustion chamber.
REFERENCES
1. Kamran A. and Guozhu L. An integrated approach for optimization of solid rocket motor. Aerospace Science and Technology, 17, 2012, 50–64.
2. Cai G., Hao Z., Dalin R., Hui T. Optimal design
of hybrid rocket motor powered vehicle for
subor-bital flight. Aerospace Science and Technology, 25,
2013, 114–124.
3. Yumusak M. Analysis and design optimization of solid rocket motors in viscous flows. Computers
and Fluids, 75, 2013, 22–34
4. Marimuthu R. and Rao B.N. Development of
ef-ficient finite elements for structural integrity analy -sis of solid rocket motor propellant grains. Inter-national Journal of Pressure Vessels and Piping, 112-113, 2013, 131–145.
5. DeLuca L., Galfetti L., Colombo G., Maggi F., Bandera A., Babuk V.A., Sinditskii V.P. Micro-structure effects in aluminized solid rocket
pro-pellants. Journal of Propulsion and Power, 26 (4),
2010, 724–733.
6. Maggi F., Dossi S., DeLuca L.T. Combustion of
metal agglomerates in a solid rocket core flow.
Acta Astronautica, 92, 2013, 163–171.
7. Maggi F., Bandera A., Galfetti L., De Luca L.T.,
Jackson T.L. Efficient solid rocket propulsion for access to space. Acta Astronautica, 66 (11–12),
2010, 1563–1573.
8. Sutton G P. and Biblarz O. Rocket propulsion ele -ments. John Wiley and Sons, 8th edition. New Jer-sey, 2010.
9. Yaman H., Celik V., Degirmenci E. Experimental
134
rate of solid rocket propellants. Fuel, 115, 2014, 794–803.
10. Degirmenci E. Effects of grain size and tempera -ture of double base solid propellants on Internal ballistics performance, Fuel, 146, 2015, 95–102 11. Turner M.J.L. Rocket and Spacecraft Propulsion:
Principles, Practice and new Development, Third
Edition. Praxis Publishing Ltd, Chichester, UK, 2009.
12. Kubato N. Propellant and explosives. Germany, 2002. ISBN: 3-527-30210-7.
13. Wu X.G., Yan Q.L., Guo X., Qi X.F., Li X.J., Wang K.Q. Combustion efficiency and pyrochemical
properties of micron-sized metal particles as the
components of modified double-base propellant.
Acta Astronautica, 68, 2011, 1098–1112.
14. Meda L., Marra G., Galfetti L., Severini F., De Luca L. Nano-aluminum as energetic material for
rocket propellants. Material Science and Engineer -ing, 27, 2007, 1393–1396.
15. Song S.J., Kim H.J., Ko S.F., Oh H.T., Kim I.C., Yoo J.C., Jung J.Y. Measurement of solid propel -lant burning rates by analysis of ultrasonic full waveforms. Journal of Mechanical Science and Technology, 23, 2009, 1112–1117.
16. Peterson J., Garfield J. 1976, The automated design
of multi-stage solid rocket vehicles, AIAA 76–744. 17. Walsh T., Wartburg R. Ballistic missile sizing and
optimizing. AIAA 78-1019, 1978.
18. Sforzini R.H. An automated approach to design of solid rockets utilizing a special internal ballistic model. AIAA 80-1135, 1980.
19. Swaminathan V. and Madhavan N.S. A direct ran-dom search technique for the optimization of pro-pellant systems. The Journal of the Aeronautical Society of India, 32, 1980, 23–32.
20. Truchot A. 1989, Overall optimization of solid
rocket motors. AIAA 89-16916.
21. Fang Z. and Guo G. Optimization design of the
solid rocket motor. Journal of Aerospace Power, 5,
1990, 176–178.
22. Guobiao C., Jie F., Xu X., Minghao L. Performance
prediction and optimization for liquid rocket en-gine nozzle. Science and Technology, 11, 2007, 155–162.
23. Khurram N., Guozhu L., Qasim Z. A hybrid opti -mization approach for SMR Finocyl grain design.
Chinese Journal of Aeronautics, 21 (6), 2008,
481–487.
24. Kamran A. and Guozhu L. Design and
optimiza-tion of 3D radial slot grain configuraoptimiza-tion. Chinese
Journal of Aeronautics 23, 2010, 409–414.
25. Kamran A. and Guozhu L. An integrated approach for optimization of solid rocket motor. Aerospace Science and Technology, 17, 2012, 50–64.
26. Yumusak M. and Eyi S. Design optimization of rocket nozzles in chemically reacting flows. In -ternational Journal of Computational Fluids, 65, 2012, 25–34.
27. Badyrka J.M., Hartfield R.J., Jenkins R.M. Aero -space design optimization using a compound re-pulsive particle swarm. Applied Mathematics and Computation, 219, 2013, 8311–8331.
28. Adami A., Mortazavi M., Nosratollahi M. A new approach in multidisciplinary design optimization of upper-stages using combined framework, Acta Astronautica, 114, 2015, 174–183.
29. Montgomery D.C. Design and analysis of experi-ments: Response surface method and designs. John Wiley and Sons, Inc., New Jersey, 2005.
30. Montgomery D.C. Water treatment principles and
de-sign. Wiley Interscience, New York, 2009, 175.
31. Richard A.N. Solid propellant rocket motor design and testing. An M.Sc thesis submitted to Faculty
of Engineering, University of Manitobs, Manitobs,
1984, 133–145.
32. Robert A.B. Basics of space flight, rocket propul
-sion. A Wiley-Interscience Publication, New York