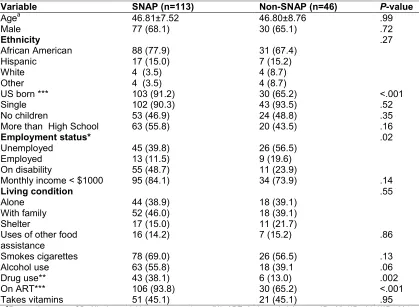
Association of Supplemental Nutrition Assistance Program (SNAP) with Food Security and Nutrition Status among Persons Living with HIV
Full text
Figure

Related documents
The framework for automating dispatcher optimizations [APC + ] is a compiler infrastructure for dynamic compilation that optimizes portions of programs at run-time (called
Therefore, in the evaluation of research proposals, policy makers and managers of programs that fund research may want to take into account not only the scientific level of
But here is another point for all of us to notice. Abram could see the land, but the Canaanite was still in the land, so he did not have possession of it. But – and here is the point
In 2018, there were 664.7 thousand employed, which is even more than at the peak of the last economic-boom (Labour market indicators …). The high number of employed has been
This study documents the marine and terrestrial palynology of the uppermost Lower and Middle Jurassic (uppermost Toarcian to lowermost Bathonian) strata at Cabo Mondego
and Analysis Maintenance of Innovation And Deployment O p er at ion al P roc es se s Issue and Request Management Version Restartand Upgrades Operational Support Service
Once the values of the monitored parameters (i.e., the evaluation.. parameters) are retrieved through the Monitoring Layer, the Modeling and Evaluation Layer caters to providing
The study explores the age and gender patterns of the vehicle occupants, spe- cifically: how many people were inside the vehicle when one or more fatalities occurred; the
