Influence of soil properties on crop yield: a multivariate statistical approach
Katalin Juhos1*, Szilárd Szabó2, and Márta Ladányi31Department of Soil Science and Water Management, 3Department of Biometrics and Agricultural Informatics, Corvinus University of Budapest, 29-43 Villányi St., H-Budapest, Hungary
2Department of Physical Geography and Geoinformatics, University of Debrecen, 1 Egyetem tér, H-4032 Debrecen, Hungary
Received April 15, 2015; accepted September 29, 2015
*Corresponding author e-mail: [email protected] A b s t r a c t. The aim of the study was to reveal the rela-tionship between soil properties and grain yields in an East Hungarian region in regard to weather conditions. Soil pH, EC, carbonate content, soluble and exchangeable Na+, texture, orga- nic carbon, and nutrient contents were analyzed. Yield data (maize, winter wheat, sunflower) from 10 years were standardi- zed using calculated relative yield and yield variability. Weather con- ditions were characterized by the Pálfai Drought Index. Hydrological and topographical conditions were characterized by the mean altitude of plots. The ranged pedological variables were analyzed using principal component analysis with Varimax rotation. The principal component analysis showed that three principal components with eigenvalues greater than one explai- ned more than 84% of the variability of soil properties. The multiple stepwise principal regression analysis showed that the mean relative yield was linearly correlated with all the three prin-cipal component factors (R2 = 0.49, p < 0.01). In droughty years, the sodification, salinization, soil texture, and nutrient contents determined the yields (R2 = 0.30, p < 0.05). In humid years, the lower topographical position, soil organic matter, and nutrient contents were the main limiting factors (R2 = 0.40, p < 0.01). Consequently, the variables can effectively explain the yield varia- bility together with other variables as linear combinations.
K e y w o r d s: principal component regression analysis, soil-plant relationship, weather conditions
INTRODUCTION
The relationship between crop yield and soil is very complex and depends on complex interactions between physical and chemical properties of soil and other exter-nal natural factors (Sys et al., 1991). Understanding the
variability of landscape and soil properties and their effect
on crop yield is a critical component of site-specific and
sustainable management systems and land use planning. Several statistical methods have been developed to predict
the yields. The suitability of these methods depends on the structure and size of the database, but each method has its own limitations.
By applying stepwise multivariate linear regression ana-
lysis (SMLR), several authors have found that pedological indicators have a significant relationship with crop yield
(Andrews and Carrol, 2001; Brubaker et al., 1994; De Araujo
et al., 2009; Rezaei et al., 2006; Smith et al., 1993). Simple
li-near functions, however, are usually inappropriate to de- scribe the effect of soil indicators on the productivity. Fur- thermore, intercorrelation among soil properties can result in multicollinearity problems regarding relationships between soil properties and crop yield. However, removal of some variables could contribute to losing important information.
To solve multicollinearity problems between indepen-dent variables, several authors applied partial least squares
regression (PLS) (Corwin et al., 2003; Ping et al., 2004).
Loadings from linear combinations of variables in PLS allowed identifying soil properties that have the greatest
influence on yields. Another option is combining variables
based on their linear correlation using principal component
analysis (PCA). The PCA can simplify the structure of
a set of variables by replacing those with a few uncorrela- ted linear combinations of original variables. According to
Stenberg (1998), this method may produce new less inter -pretable combined variables. These PCA factors do not explain the total variance of the entire data set. However, several authors determined the relationships between soil attributes and yields by conducting linear multivariate regression processes with derived PCA factors as inde-pendent variables (Ayoubi et al., 2009; Cox et al., 2003; Mallarino et al., 1999; Shukla et al., 2004b).
Classification and regression trees (CARTs) are more
robust techniques for predicting yield variability responses to variations of soil properties and management practices due to their low prediction error (Ahman and Bhatti, 2015; Tittonell et al., 2007; Zheng et al., 2009).
In our region, a research team tried to assess the inter-actions of climatic, topographic, hydrological, edaphic, and management factors to determine a production process in
Hungary (Tóth, 2011). The research was based on process -ing of the national databases relat-ing to soil, meteorology, fertilizing, and crop yields were processed using a general linear model. They have proved that it is worth examining the soil productivity potential at the genetic soil unit level. In addition, the yield variability depends on soil attributes that affect soil moisture regime (eg texture, topographical
position) and the soil nutrient supply. However, the reasons
for the yield variability are still poorly understood. According to our hypothesis, simple pedological indica-tors by themselves are not suitable to reveal the relationship between soil properties and crop yield. Namely, it would
be difficult to find some usable equation that explains pro -ductivity. Multivariate statistical tools are necessary. The aim of this paper was to reveal the relationship between soil parameters and productivity in an East Hungarian region and to prove better performance in predictions of a potential crop yield variation in regard to different weath-er conditions ovweath-er years.
MATERIALS AND METHODS
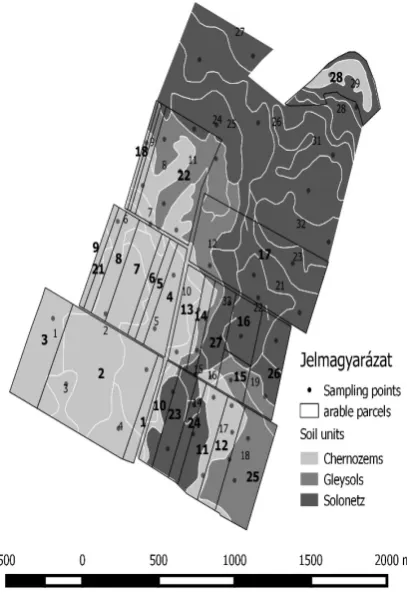
The research site covers approximately 225 ha and is
located in East Hungary (21º13′21.1″-15′15.5″E, 47º17′5.7″ -19′8.7″N) at an altitude of 86-89.5 m. The site was classi
-fied as according to the Köppen climate classification (Cfa)
climatic region due to warm temperate climate (Fábián and
Matyasovszky, 2010) characterized by mean annual
preci-pitation of 580 mm and mean annual temperature of 10.5°C.
During the 10 years studied (2004-2013), there were 4 years of drought (2007; 2009; 2012 and 2013) with less than
200 mm of precipitation from April to August. The years were separated into two groups according to the Pálfai
Drought Index (PDI, Pálfai, 2002) (Table 1).
The depth of groundwater table is approximately 50-300 cm. The soils developed on alluvial deposits with
loam, loamy clay, and clay texture. They can be classified as Chernozems, Solonetz, and Gleysols (FAO, 2014). The
agricultural management practice and crop rotation were the same on every plot. The management was characterized by conventional tillage in a nonirrigated system and nitro-gen fertilization was only applied. The plot areas ranged
from 1.04 to 31.90 ha (Fig. 1).
The soil survey was conducted in 2010 for analysis of physical and chemical properties that were previously con-sidered important in land-use management in our region. Soil samples were collected at 0-100 at 20 cm depth
incre-ments (Fig. 1). Soil pH was measured in a 1:2.5 soil/ KCl
T a b l e 1. Weather conditions of years 2004-2013 including mean temperature of April-August (TIV-VIII), weighted precipitation of October-August (PX-VIII) and Pálfai drought index (PDI) (Pálfai, 2002)
Year TIV-VIII (°C) Weighted PX-VIII (mm) P 100
T PDI
VIII -X
VIII -IV
=
2004 17.40 605.94 2.87
2005 17.52 578.06 3.03
2006 17.84 460.53 3.87
2007 19.66 361.63 5.44
2008 18.32 506.85 3.61
2009 19.24 326.87 5.89
2010 18.26 755.36 2.42
2011 18.56 552.99 3.36
2012 19.48 243.66 7.99
2013 18.84 309.19 6.09
Mean 18.51 470.12 4.46
mixture, and electrical conductivity (EC) in a 1:5 soil/water
mixture potentiometrically. Determination of the total carbo- nate content (CaCO3) was conducted according to the volu-metric method (MSZ, 1978). Determination of soluble and exchangeable sodium (AL-Na) was based on extraction with
acid ammonium lactate (Egnér et al., 1960). Particles small
-er than 0.002 mm (clay) and 0.02 mm (clay + silt) w-ere determined by the pipette method (MSZ, 1978). Organic carbon content (OC) was measured by the Turin method (Kononova, 1966). Homogeneous soil units were delimited based on the soil survey (Fig. 1). Mean soil properties (at
0-100 cm depth) and surface elevation were calculated for
each plot. Soil samples composed of 20 subsamples were collected for analysis of potentially available nutrients at 0-30 cm depth from the 28 plots every year (2004-2013). The
hydrolysable nitrogen content (ammonium- and nitrate-N
and some easily available amino-N forms) was determined by oxidative hydrolysis according to Hargitai (1970) (Hargitai-N). Available phosphorous (AL-P2O5) and potas
sium (AL-K2O) contents were determined with acidic
ammonium lactate extraction (Egnér et al., 1960). These
annual nutrient contents were averaged. Furthermore, an average altitude of the plots was calculated since the
topographical position (microrelief) determines and char -acterizes well the soil moisture regime and average depth of groundwater table. The spatial analysis and soil unit map-ping were carried out by the software application QGIS 2.2.
Winter wheat (Triticum aestivum L.), maize (Zea maysL.), and sunflower (Helianthus annuus L.) yield data were col -lected at each plot from 2004 to 2013. Since the potential
productivity of soil does not equal current (and actual)
yields and they are also determined by other external fac-tors, we calculated relative mean yield and yield variability indices for ten years instead of analysing the raw yield data.
The data were first standardized using the relative yield of
each crop calculated as follows:
, max
Y Y Y R p
p = (1)
where: RYp is the relative yield of plot p (a value between 0
and 1), Yp – yield of plot p (t ha-1), Y
max – maximum yield on
the total research site over all plots (t ha-1). Then, the mean
relative yields of all years, droughty years, and humid years
( )
RYp were calculated for each plot p. Yield variability wasexpressed as follows:
100,
)
( =
)
( p
p
p RY
Y R D S Y R V C
(2)
where: CV(RYp) is the yield variability of plot p (%),
SD(RYp) is the standard deviation of the relative yield of
plot p (2004-2013),
( )
RYp is the mean relative yield of plotp (2004-2013).
A principal component analysis (PCA) of the total data
set of pedological variables were conducted with Varimax
(orthogonal) rotation (Ayoubi et al., 2009; Cox et al., 2003; Shukla et al., 2004b). In order to obtain well interpretable PCs, the indicator values were first ranked in ascending or
descending order using a linear function depending on whether
a higher value was considered ‘beneficial’ or ‘detrimen-tal’ in terms of soil function (Table 2). To mitigate the
lepto-kurtic character of variable AL-P2O5 and CaCO3, logarith-
mic (ln) transformation was conducted. The PCA was based
on the linear correlation between input indicators.
With dependent variables ‘mean relative yield’ (RYp)
and ‘yield variability’ (CV(RYp)), multiple linear regres -sions were conducted with a stepwise method using the derived PC factors with eigenvalues greater than 1 (Kaiser,
1960). All variables were examined as to whether there is any indication for nonlinear analysis but we did not find
any reason. All data were statistically processed using IBM SPSS Statistics 20.
RESULTS AND DISCUSSION
The plots show striking differences in the yields. The mean yield of maize was 6.71 t ha-1 on the total arable land
area, while the maximum yield was 10 t ha-1 on plots 17 and
21. The mean yield of winter wheat was 4.63 t ha-1 on the
total area while the maximum yield was 7.1 t ha-1 on plots
3 and 5. The sunflower produced between 1.4 and 4.5 t ha-1
(maximum yield was found on plot 23). The mean yield of sunflower was 2.77 t ha-1. The plots were clearly separated
into three productivity classes along the mean relative yield
and yield variability (Fig. 2). It seems that the highest yield
and lowest variance were found on the Chernozems, the medium yield and medium variance on the Solonetz soils, and the lowest yield and highest variance on the Gleysols.
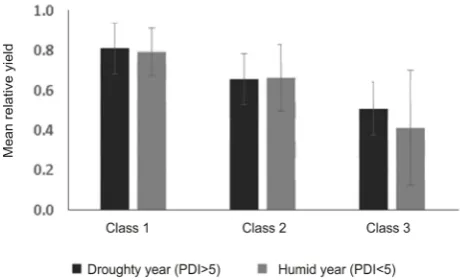
Drought did not influence the yields substantially because of the high water capacity of soils (Fig. 3). However, plots
with productivity class 3 had the lowest mean yield and greatest yield variability because of groundwater recharge or returning to the surface in humid years.
Therefore, it seems that any of the sodification, sali -nization, high clay content, and the lower topographical position might determine the yields in our study. Under the meteorological/hydrological conditions of the Hungarian Plain, arable lands are sensitive and vulnerable to saliniza-tion and extreme moisture regime stresses (Douaik et al., 2007; Tóth et al., 2001). Soil salinity and sodicity are often
related to the presence of a shallow groundwater table. The low agricultural utility of salt-affected and heavy-textured
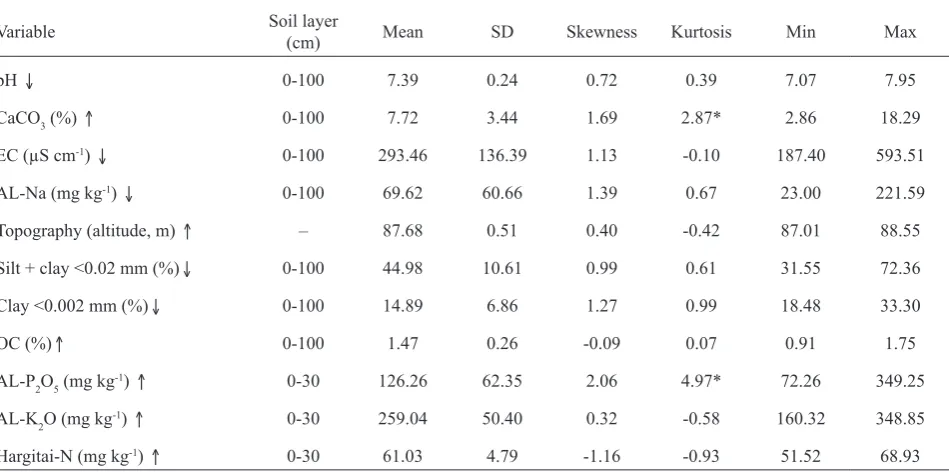
T a b l e 2. Descriptive statistics including mean, standard deviation (SD), kurtosis, skewness, and minimum and maximum values for soil physical and chemical properties of the plots (n = 28)
Variable Soil layer (cm) Mean SD Skewness Kurtosis Min Max
pH 0-100 7.39 0.24 0.72 0.39 7.07 7.95
CaCO3 (%) 0-100 7.72 3.44 1.69 2.87* 2.86 18.29
EC (µS cm-1) 0-100 293.46 136.39 1.13 -0.10 187.40 593.51
AL-Na (mg kg-1) 0-100 69.62 60.66 1.39 0.67 23.00 221.59
Topography (altitude, m) – 87.68 0.51 0.40 -0.42 87.01 88.55
Silt + clay <0.02 mm (%) 0-100 44.98 10.61 0.99 0.61 31.55 72.36
Clay <0.002 mm (%) 0-100 14.89 6.86 1.27 0.99 18.48 33.30
OC (%) 0-100 1.47 0.26 -0.09 0.07 0.91 1.75
AL-P2O5 (mg kg-1) 0-30 126.26 62.35 2.06 4.97* 72.26 349.25
AL-K2O (mg kg-1) 0-30 259.04 50.40 0.32 -0.58 160.32 348.85
Hargitai-N (mg kg-1) 0-30 61.03 4.79 -1.16 -0.93 51.52 68.93
Ranked in: ↓ descending order (less is more beneficial), ↑ ascending order (more is more beneficial), *leptokurtic character, logarith-mic transformation was conducted.
Fig. 2. Mean relative yield and variability of the yield of the plots (class 1 − low risk, class 2 − moderate risk, class 3 − high risk). Reference yield: relative yield of 1.0 = maximum yield of 10 years (maize, winter wheat, and sunflower: 10, 7.1 and 4.5 t ha-1, respectively).
Variability of yield (%)
alkali soils are closely related to their unfavourable physi-cal and hydrophysiphysi-cal properties, as well as their extreme
moisture regime (Várallyay, 2008). The organic carbon,
available nitrogen, phosphorus, and potassium contents
were very different (Table 3) but considered relatively high (Csathó, 2005; Németh, 2006). The soil nutrient content
also depends on how long the low or high intensity farming has been in existence but the past agricultural practice were not examined in our research.
Some indicators had a significant influence on the mean
relative yield of plots. Simple linear regressions led to
sig-nificant models with pH, OC, and topography indicators
(R2 = 0.42, 0.25, 0.37). We did not find any reason for non
-linear analysis. Therefore, the organic carbon content might be an important soil parameter to predict yields. The rela-tionship between soil organic matter indicators and yields was well known but described by non-linear regression
using the modified Mitscherlich equation (Csathó, 2003a, b).
Separate examinations of the indicators can result in false conclusions. However, having all of the simple indicators as well as the selected non-correlated indicators, multi-variate stepwise regressions for mean relative yield and yield variability were all unsuccessful, namely the multi-ple regression models could not be reasonably interpreted. A dimension reduction by principal component analysis was necessary.
According to the eigenvalues greater than 1, the PCA yielded three principal components explaining a total of 84.926% of the variance for the entire set of variables
(Table 3). Principal component 1 (PC1) was identified as salinisation, sodification, and sodium-enhanced clay trans
-location at a specific altitude due to the high loadings of
the following items: AL-Na, EC, clay, clay + silt, pH, and
topography. The first factor accounted for 52.502% of the
total variance and discriminated well the plots on Solonetz soils from the ones on Chernozems. PC2 was labelled as
pH, accumulation of calcium carbonates, and humification
due to the high loadings of the following variables: pH, CaCO3, and OC. Namely, this factor expressed the
remain-ing basic capacity caused by the CaCO3 content and could discriminate the Calcic Gleysols with low soil organic mat-ter from the Calcic Chernozems. The variance explained
by the second factor was 19.253%. PC3 was identified
as available nutrient content due to the high loadings of AL-P2O5 and AL-K2O. This factor accounted for 13.169%
of the total variance. The communalities of the variables
included were high (> 0.82) with the exception of one variable (Hargitai-N) having a small amount of variance (40.2%) in common with the other variables in the analy
-sis. Therefore, we identified three artificial variables which
are independent of one another (ie they are uncorrelated)
and characterize the soil capacities on an ascending scale because of the linear scoring of indicators.
Factor analyses, especially PCA, are widely considered as suitable methods to process even highly correlated edap- hic variables (Shukla et al., 2004a; Govaerts et al., 2006;
Yao et al., 2013). A Varimax rotation enhances the inter
-pretability of the uncorrelated components. The derived factors are designated as soil quality indices or complex indicators. Although these PCA factors do not explain the
Fig. 3. The mean relative yield and standard deviation of produc-tivity classes (PDI: Pálfai drought index).
T a b l e 3. Results of principal component analysis
Principal components PC1 PC2 PC3
Eigenvalues 5.776 2.118 1.449
% of variance 52.502 19.253 13.169
Cumulated % of total
variance 52.502 71.758 84.926
Factor loadings
pH 0.733 0.591 0.275
EC 0.971 -0.074 -0.021
AL-Na 0.970 0.014 -0.062
CaCO3 0.036 -0.907 -0.146
Silt + clay (<0.02 mm) 0.850 0.323 0.187
Clay (<0.002 mm) 0.949 0.122 0.184
AL-P2O5 -0.119 0.121 -0.926
AL-K2O -0.043 0.001 -0.927
Hargitai-N 0.428 -0.345 0.315
OC 0.533 0.759 -0.017
Topography 0.726 0.370 0.395
total variance of the entire set of variables, PCA is consi- dered as a reasonable dimension reduction method and the PC factors can be well interpreted.
The linear multiple PCR for the mean relative yield of all years
( )
RYp selected all the three PC factors into thelinear model, so the explained variance was as R2 = 0.49
(p < 0.01) (Table 4). The F test resulted in a significant model and the coefficients of the PC1, PC2, and PC3 factors together with the constant were all significant. The PCR
for the mean relative yield of droughty years
( )
RYpselect-ed the PC1 and PC3 factors into the linear model, which
presented a significant model. The explained variance was
as R2 = 0.30 (p < 0.05). The PCR for the mean relative
yield of humid years
( )
RYp selected the PC2 and PC3 intothe linear model, so the explained variance was R2 = 0.40
(p < 0.01). The PCR for yield variability (CV(RYp)) selected
the PC1 and PC2 factors into the linear model. The ex- plained variance was as R2 = 0.41 (p < 0.01). In droughty
years, the sodification, salinization, soil texture, and nutrient
contents determined the yields in our study. In humid years, the lower topographical position, the soil organic matter, and nutrient contents were the main limiting factors.
This multivariate approach is considered new in Hungary. In comparison with similar research in other regions, Shukla et al. (2004b) applied the same framework
and reported that the grain yield (R2 = 0.19, p < 0.02) and
biomass yield (R2 = 0.36, p < 0.003) were linearly correlated
with four PCs derived. Mallarino et al. (1999) derived three
common factors using factors analysis based on the cova- riance matrix of indicators. Their importance in
explain-ing the yield variability differed greatly among cornfields,
R2 were between 0.01 (p < 0.254) and 0.67 (p < 0.001).
CONCLUSIONS
1. The study demonstrated that the impact of soil pro- perties on variability of grain yields depended on the weath-er ovweath-er the years and the topographical position as well.
In droughty years, the sodification, salinization, soil
tex-ture, and nutrient contents determined the yields, whereas
T a b l e 4. The results of the nonlinear principal component regression models: the estimated parameter and the regression diagnostics (F value of the model, Student t values of the parameters, and the explained variance R2)
Dependent variable Estimated parameters t (df = 26) F R2
p
Y
R droughty years
constant 0.66 0.02***
5.36* 0.30
PC1 0.40 2.38*
PC2 excluded from the model
PC3 0.38 2.25*
p
Y
R humid years
constant 0.64 0.02***
8.47** 0.40
PC1 excluded from the model
PC2 0.52 3.34**
PC3 0.37 2.40*
RYp all years
constant 0.64 34.30***
7.61** 0.49
PC1 0.36 2.45*
PC2 0.45 3.04**
PC3 0.40 2.75*
CV(RYp) all years
constant 24.88 10.46***
8.74** 0.41
PC1 -0.45 -2.94**
PC2 -0.46 -2.98**
PC3 excluded from the model
in humid years the lower topographical position, the soil organic matter, and nutrient contents were the main limit-ing factors in our study.
2. Multivariate statistical methods are necessary to reveal the relationship between pedological parameters and crop yield in regard to weather conditions and topographi-cal position. All pedologitopographi-cal indicators that characterize the soil productivity function and major soil forming processes need to be included into the multivariate statistical analysis.
3. The advantages of using principal component
regres-sion analysis were as follows: (I) principal component
analysis operates well with highly correlated variables and
performs a reasonable dimension reduction; (II) principal
components are uncorrelated and can express the interac-tions of soil properties. Although the principal components do not explain the total variance of the entire set of varia-
bles (which may be a disadvantage), they can explain the
yields better than the simple indicators. Consequently, the variables can effectively explain the yield and the variabi- lity together with other variables as linear combinations.
REFERENCES
Ahman M.N. and Bhatti A.U., 2015. Comparison of regression models to predict potential yield of wheat from some measu- red soil properties. Pakistan J. Agric. Sci., 52(1), 239-257. Andrews S.S. and Carrol C.R., 2001. Designing a soil quality
assessment tool for sustainable agroecosystem manage-ment. Ecol. Appl., 11(6), 1573-1585.
Ayoubi S., Khormali F., and Sahrawat K.L., 2009. Relationship of barly biomass and grain yields to soil properties within a field in the arid region: Use of factor analysis. Acta. Agric. Scand. Section B-Soil Plant. Sci., 59(2), 107-117.
Brubaker S.C., Jones A.J., Frank K., and Lewis D.T., 1994. Regression models for estimating soil properties by land-scape position. Soil Sci. Soc. Am. J., 58, 1763-1767. Corwin D.L., Lesch S.M., Shouse P.J., Soppe R., and Ayars J.E.,
2003. Identifying soil properties that influence cotton yield using soil sampling directed by apparent soilelectrical con-ductivity. Agron. J., 95(2), 352-364.
Cox M.S., Gerard D.P., Wardlaw M.C., and Abshire M.J., 2003. Variability of selected soil properties and their relationships with soybean yield. Soil Sci. Soc. Am. J., 67, 1296-1302. Csathó P., 2003a. Nitrogen effects on yields of winter wheat
(Triticum aestivum L.) in long-term experiments in Hungary (1960-2000) (in Hungarian). Növénytermelés, 52(1), 41-59. Csathó P., 2003b. Nitrogen effects on yields of maize (Zea mays L.)
in long-term experiments in Hungary (1960-2000) (in Hungarian). Agrokémia és Talajtan, 52(1-2), 169-184. Csathó P., 2005. Potassium effects on yields of winter wheat
(Triticum aestivum L.) in long-term experiments in Hungary (1960-2000) (in Hungarian). Növénytermelés, 54(3). 197-213.
de Araujo J.L., dos Anjos L.H.C., and Pereira M.G., 2009. Soil attributes and distinction of pedoenvironments for agricul-ture in the Mbya Indian Reserve in Ubatuba (in Spain). Brazilian J. Soil Sci., 33(6), 1765-1776.
Douaik A., Van Meirvenne M., and Toth T., 2007. Statistical methods for evaluating soil salinity spatial and temporal variability. Soil Sci. Soc. Am. J., 71(5), 1629-1635. Egnér H., Riehm H., and Domingo W.R., 1960. Untersuchungen
über die chemische Bodenanalyse als Grundlage für die Beurteilung des Nährstoffzustandes der Böden (in German). Ann. Royal Agricult. Coll. 26, Sweden, 199-215.
Fábián Á.P. and Matyasovszky I., 2010. Analysis of climate change in Hungary according to an extended Köppen clas-sification system, 1971-2060. Quarterly J. Hungarian Meteorological Service, 114(4), 251-261.
FAO, 2014. World reference base for soil resources 2014. World Soil Resources Reports No. 106, FAO, Rome.
Govaerts B., Sayre K.D., and Deckers J., 2006. A minimum data set for soil quality assessment of wheat and maize cropping in the highlands of Mexico. Soil Till. Res., 87, 163-174.
Hargitai L., 1970. Determination of hydrolizable nitrogen con-tent of several horticultural substrates (in Hungarian). Kertészeti Egyetem Közleményei, 34, 179-193.
Kaiser H.F., 1960. The application of electronic computers to factor analysis. Educ. Psychol. Meas., 29, 141-151. Kononova M.M., 1966. Soil Organic Matter: its nature, its role
in soil fonnation and in soil fertility. Pergamon Press, Oxford, UK.
Mallarino A.P., Oyarzabal E.S., and Hinz P.N., 1999. Interpreting within-field realtionships between crop yields and soil and plant variables using factor analysis. Precis. Agric., 1, 15-25.
MSZ-08-0205/06, 1978. The analyses of physical and chemical soil properties. Hungarian Standard.
Németh T., 2006. Application of the Bray-Mitscherlich equation approach for economically and environmentally sound fer-tilization of field crops in Hungary. Comm. Soil Sci. Plant Anal., 37, 2227-2247.
Pálfai I., 2002. Probability of drought occurrence in Hungary. Quarterly J. Hungarian Meteorological Service, 106(3-4), 265-275.
Ping J.L., Green C.J., Bronson K.F., Zartman R.E., and Dober- mann A., 2004. Identification of relationships between cot-ton yield, quality, and soil properties. Agron. J., 96(6), 1588-1597.
Rezaei S.A., Gilkes R.J., and Andrews S.S., 2006. A minimum data set for assessing soil quality in rangelands. Geoderma, 136, 229-234.
Shukla M.K., Lal R., and Ebinger M., 2004a. Soil quality indi-cators for reclaimed minesoils in southeastern Ohio. Soil Sci., 169(2), 133-142.
Shukla M.K., Lal R., and Ebinger M., 2004b. Principal compo-nent analysis for predicting corn biomass and grain yields. Soil Sci., 169(3), 215-224.
Smith J.L., Halvorson J.J., and Papendick R.I., 1993. Using muliple-variable indicator kriging for evaluating soil qua- lity. Soil Sci. Soc. Am. J., 57, 743-749.
Stenberg B., 1998. Soil attributes as predictors of crop production under standardized conditions. Biol. Fert. Soils, 27, 104-112.
Tittonell P., Sheperd K.D., Vanlauwe B., and Giller K.E., 2007. Unravelling the effects of soil and crop management on maize productivity in smallholder agricultural systems of western Kenya - An application of classification and regres-sion tree analysis. Agric. Ecosys. Environ., 123, 137-150. Tóth T., 2011. Evaluation of cropland productivity in Hungary
with the D-e-Meter land evaluation system. Agrokémia és Talajtan, 60, 161-174.
Tóth T., Kuti L., Kabos L., and Pásztor L., 2001. Use of digita- lized hydrogeological maps for evaluation of salt-affected soils of large areas. Arid Land Res. Manag., 15(4), 329-346.
Várallyay G., 2008. Extreme soil moisture regime as limiting factor of the plant’s water uptake. Cereal Res. Comm., 36, 3-6.
Yao R., Yang J., Gao P., Zhang J., and Jin W., 2013. Determining minimum data set for soil quality assessment of typical salt-affected farmland in the coastal reclamation area. Soil Till. Res., 128, 137-148.