A b s t r a c t. The paper presents a comparison of particle size distributions of 23 mineral soils from SE Poland obtained by the laser diffraction and aerometric methods. There is good, statistical-ly significant correlation between particle size distribution measu-red by aerometric and laser diffraction methods. The correlation is better when the results are compared for the same type of soil and for coarser fraction (sand).
K e y w o r d s: mineral soils, particle size distribution, laser diffraction, areometric method
INTRODUCTION
Particle size distribution (PSD) is one of the most im-portant soil characteristics. Particle size distribution influen-ces many soil propertiesiapore distribution, gas exchange and water retention (Walczaket al., 2004; Witkowska-Walczak et al., 2002), water conductivity (S³awiñskiet al., 2006), thermal and sorption properties (Usowiczet al., 2008), and indi-rectly soil nutrification (W³odarczyket al., 2008).
Particle size distribution is the proportional share of soil particles of a given size. There are a lot of methods for the de-termination of soil PSD. Most of the commonly used ones are based on Stoke law and they are called sedimentation methods (Allen, 2003). The most popular in the world is the pipette method, but in Poland for routine measurements the areometric method is used (otherwise known as the Casa-grande method) (Lovelland and Whalley, 2001; Moceket al., 2000).
The sedimentation methods are laborious and time-consuming. This is why the soil scientists are looking for new methods, reliable but fast and simple in execution. The laser diffraction method (LDM) for particle size distribution determination has aroused hope.
There are a number of papers describing comparisons of the laser diffraction method with the pipette method (Arriga et al., 2006; Beuselincket al., 1998; Buurmanet al., 2001; Eshelet al., 2004; Konert and Vandenberghe, 1997; Loizeau et al., 1994; Xu and Di Guida, 2003) but apart from a preli-minary study (Ry¿aket al., 2004) there is a lack of compari-sons of the LDM with the areometric one. The aim of this pa-per is to fill this gap.
MATERIAL AND METHODS
Twenty three samples from soils representative for the south-east part of Poland were investigated. The soils were selected on the basis of the bank of representative mineral soils of Poland (Gliñskiet al., 1991). The soil samples were taken from the arable layer. Among those 23 soils, 8 samples represented brown soils (Eutric Cambisols), 6 – chernozems (Haplic Phaeozems), 5 – rendzinas (Calcaric Cambisols), 2 – grey- brown podzolic soils (Orthic Luvisols) and 1 black earth (Mollic Gleysol). Air-dry soil samples were sieved on 2 mm sieves and were chemically dispersed using a solution of sodium hexametaphosphate prior to the PSD measu-rements (ISO 11277, 1998).
The Mastersizer 2000 apparatus with Hydro MU attach-ment from the Malvern Company was used for the LDM. Mastersizer 2000 is designed for standard determination of grain size distribution of particles within the size range of 0.02mm – 2 mm. It makes use of laser light scattered on mea-sured particles and converts it into particle size distribution.
Water suspension of approx. 800 cm3 was prepared using distilled water as the liquid phase. To improve the credibility of results, the measurement procedure realized
Determination of particle size distrubution of soil using laser diffraction
- comparison with areometric method
M. Ry¿ak* and A. Bieganowski
Institute of Agrophysics, Polish Academy of Sciences, Doœwiadczalna 4, 20-290 Lublin, Poland
Received September 15, 2009; accepted January 18, 2010
© 2010 Institute of Agrophysics, Polish Academy of Sciences
*Corresponding author’s e-mail: [email protected]
A A
Agggrrroooppphhyhyysssiiicccsss
by the Mastersizer 2000 apparatus permits to eliminate the so-called background particles contained in the liquid phase. Measurements were made in three replications (a new portion of air-dry soil poured into the measuring system being treated as a replication). Calculations of PSD were carried out using the Fraunhofer and Mie theories (in the case of Mie theory the refractive index of 1.57 and ab-sorption index of zero were used). The laser light wave-length in the apparatus was 466 nm for blue and 633 nm for red light. Measurements (understood as averaging of 30 000 images of laser light diffraction recorded by the detectors) lasted 60 s (30 s for blue and 30 s for red light) and were carried out directly one by one.
The next algorithms were selected for measurements: – general purpose analysis– calculation procedure
recom-mended by the apparatus producer for objects with un-known properties or containing a large number of various fractions;
– irregular shape ratio– although one of the assumptions of the method is sphericity of particles, the producer has pro-vided a module permitting greater accuracy of results when the particles under study are not perfect spheres.
The speed of the stirrer and the pump integrated with it was determined experimentally and fixed at 2 500 r.p.m. On the one hand, this speed should protect the mixture against the gravitation segregation of particles (speed not to slow) and on the other hand against the formation of air bubbles in the stirred mixture (speed not to fast).
Because the Mastersizer 2000 records the measured data as raw results, there is a possibility to calculate the PSD according to any given classification.
The amount of soil taken for measurement was dosed so that the obscurance (taken as the degree of light obscuring by the suspension analyzed) measured by the Mastersizer 2000 at the beginning of the measurement cycle was ca. 10%. Measurements of particle size distribution with the Master-sizer 2000 apparatus can be realized when the degree of ob-scurance falls within the range of 10-20% (Malvern Opera-tors Guide, 1999). At lower obscurance the quality of images reproduced on the detectors is too weak, which causes a high level of measurement uncertainty. At obscurance levels above 20%, in turn, the laser light beam may be subject to multiple reflections from successive soil particles, intro-ducing errors in the results. In practice the mass of soil samples was included in the range of 0.5 to a few grams.
There are a lot of classifications of the PSD of soils. They have different sizes of individual fractions. The most popular is the classification according to FAO. This classifi-cation for fractions < 2 mm was recognized by the Polish Soil Science Society in 2008. The old Polish classification (1989) date had been different. Both classifications are presen-ted in Table 1. It was decided to present the results with refe-rence to both classifications. The particle size distribution obtai-ned by the areometric method was taken from the bank of representative mineral soils of Poland (Gliñskiet al., 1991).
RESULTS AND DISCUSSION
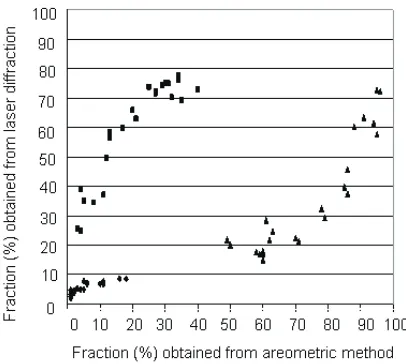
Comparison of results obtained with the two investi-gated methods for all soil samples is presented in Fig. 1. Three distinct groups of data related to the soil fractions (sand, silt and clay according to FAO classification) can be seen in the graph. It can be concluded that these three granulometric fractions should be considered separately.
Fraction/ subfraction
Grain diameter (mm)
PSSS (1989) FAO
Sand very coarse
coarse medium fine very fine
0.10-1.00 – 0.50-1.00 0.25-0.50 0.10-0.25
–
0.05-2.00 1.00-2.00 0.50-1.00 0.25-0.50 0.10-0.25 0.05-0.10
Silt
coarse fine
0.02-0.10 0.05-0.10 0.02-0.05
0.002-0.05
0.020-0.05 0.002-0.02
Clay coarse silty
fine silty colloidal
< 0.02 0.020-0.006
0.002-0.006
< 0.002
£0.002 – – – T a b l e 1.Granulometric fraction ranges
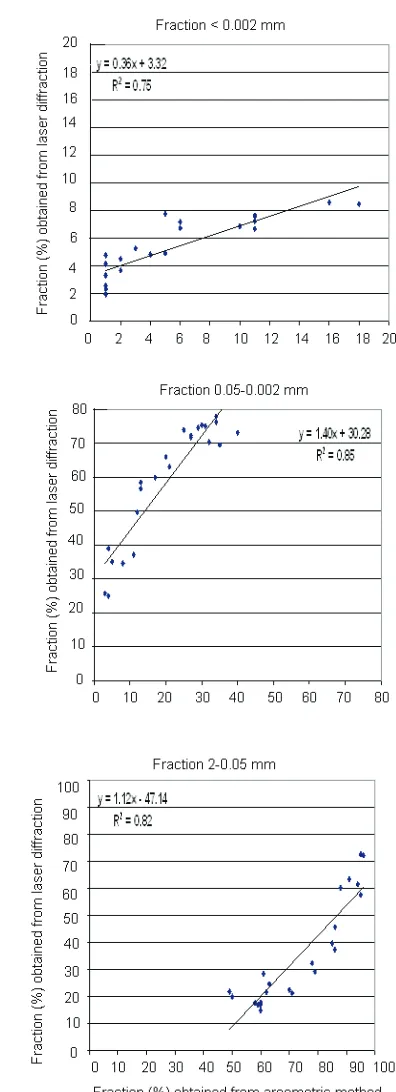
A comparison for three fraction participations (accord-ing to FAO classification) for all soil samples, as an example, is presented in Fig. 2. The results presented in Fig. 2 were calculated according to the Fraunhofer theory. Similar com-parisons were carried out for the PSSS (1989) classifi-cation and for the Mie theory. A summary of the compari-sons is presented in Table 2.
The basic parameter which allows to compare results obtained with the two methods (areometric and LDM) is the coefficient of determination, R2. For the comparison of the two investigated methods for the Fraunhofer theory the values of R2were in the range:
– 0.75-0.85 (FAO classification), – 0.77-0.96 (PSSS (1989) classification).
For the Mie theory R2was nearly in the same ranges: – 0.80-0.84 (FAO classification),
– 0.76-0.96 (PSSS (1989) classification). These data can be summarised as follows:
– the selection of theory has practically no influence on the coefficient of determination,
– the higher coefficients of determination were obtained for the PSSS (1989) classification,
– generally, better correlation was found for the sand fraction and poorer for silt (with the exception of coefficient of determination obtained for the Mie theory and for FAO classification).
The coefficient of determination value of the order of 80-90 is sufficient for most practical applications, for in-stance for the determination of soil category or for fertilizer recommendations. It can be expected, however, that for in-dividual types of soils the correlation can be higher. Because among the investigated soils there were 8 brown soils the comparison was carried out for them. A listing of the obtai-ned equations and coefficients of determination is presented in Table 3.
It can be stated that the coefficient of determination for brown soils increased. In the case of using the Fraunhofer theory, its values were in the range of0.86-0.89 for FAO classification and 0.90-0.99 for PSSS (1989) classification. When the Mie theory was used the corresponding values were nearly the same: 0.86-0.88 for FAO and 0.88 - 0.99 for PSSS (1989) classification.
The poorer coefficients of determination for finer fractions are in agreement with reports in literature (Taubner et al., 2009).
Regardless of this observation, the correlation can be improved when results for one type of soil are compared. Thus, if someone wants to use such kind of equations in practice the calibration for different types of soils should be carried out and suitable equations worked out.
Fig. 2.Comparison of for three fraction participations (according to FAO classification) for all soil samples. The results were obtained by LDM and areometric method and calculated according to the Fraunhofer theory.
a
b
CONCLUSIONS
1. There is good, statistically significant correlation bet-ween particle size distribution measured by aerometric and laser diffraction methods (the coefficient of determination is of the order of 0.8-0.9).
2. The correlation is better for the coarser fraction (sand) and poorer for the finer fraction (clay).
REFERENCES
Allen T., 2003.Powder Sampling and Particle Size Determination. Elsevier Press, Amsterdam, the Netherland.
Arriga F.J., Lowery B., and Mays M.D., 2006.A fast method for determining soil particle size distribution using a laser instrument. Soil Sci., 171(9), 663-674.
Beuselinck L., Govers G., Poesen J., Degraer G., and Froyen L., 1998.Grain-size analysis by laser diffractometry: compari-son with sieve-pipette method. Catena, 32, 193-208. Buurman P., Pape Th., Reijneveld J.A., de Jong F., and van
Gelder E., 2001.Laser-diffraction and pipette-method grain sizing of Dutch sediments: correlations for fine fractions of
marine, fluvial, and loess samples. Netherlands J. Geosci., 80(2), 49-57.
Eshel G., Levy G.J., Milgelgrin U., and Singer M.J., 2004. Critical evaluation of the use of laser diffraction for particle-size distribution analysis. Soil Sci. Soc. Am. J., 68, 736-743.
Gliñski J., Ostrowski J., Stêpniewska Z., and Stêpniewski W., 1991.The bank of representative mineral soils of Poland (in Polish). Problemy Agrofizyki, 66, 5-63.
ISO 11277, 1998. Soil Quality. Determination of particle size distribution in mineral soil material. Method by sieving and sedimentation.
Konert M. and Vandenberghe J., 1997.Comparison of laser grain size analysis with pipette and sieve analysis: a solution for the underestimation of the clay fraction. Sedimentology, 44, 523-535.
Loizeau J.-L., Arbouille D., Santiago S., and Vernet J.-P., 1994.
Evaluation of wide range laser diffraction grain size analyser for use with sediments. Sedimentology 41, 353-361. Lovelland P.J. and Whalley W.R., 2001.Particle size analysis.
In: Soil and Environmental Analysis Physical Method (Eds K.A. Smith, Ch.E. Mullins). Dekker Press, New York, USA.
Theory
Fraction (mm)
PSSS (1989) classification FAOclassification
Sand 1.0-0.1 Silt 0.1-0.02 Clay <0.02 Sand 2-0.05 Silt 0.05-0.002 Clay <0.002 Fraunhofer y=0.72x-2.20
R2=0.96
y=0.67x+11.25 R2=0.87
y=0.72x+21.03
R2=0.77
y=1.12x-47.14
R2=0.82
y=1.40x+30.28
R2=0.85
y=0.36x-3.32
R2=0.75
Mie y=0.76x-2.71R2=0.96 y=0.76x+10.72
R2=0.88
y=0.67x+18.15
R2=0.76
y=1.15x-47.03
R2=0.80
y=1.55x+28.99
R2=0.84
y=0.13x+0.49
R2=0.83
T a b l e 2.Specification of equations and coefficients of determination (R2) for three main fractions according to PSSS (1989) and FAO classifications. The data were calculated based on the Mie and Fraunhofer theory. Equations were derived on the basis of measurements carried out for all 23 soils. For the Mie theory the following coefficients were used: refractive – 1.57 and absorption – 0
Theory
Fraction (mm)
PSSS (1989) classification FAOclassification
Sand 1.0-0.1 Silt 0.1-0.02 Clay <0.02 Sand 2-0.05 Silt 0.05-0.002 Clay <0.002 Fraunhofer y=0.76x-0.59
R2=0.99
y=0.72x+10.62 R2=0.90
y=0.64x+18.41
R2=0.90
y=1.30x-57.96
R2=0.88
y=1.55x+25.14
R2=0.89
y=0.42x-2.62
R2=0.86
Mie y=0.82x-1.35R2=0.99 y=0.85x+8.62
R2=0.90
y=0.59x+15.20
R2=0.88
y=1.36x-60.03
R2=0.86
y=1.73x+23.00
R2=0.88
y=0.11x+0.44
R2=0.88
Explanations as on Table 2.
Malvern Operators Guide,1999.Malvern Press, Malvern, UK. Mocek A., Drzyma³a S., and Maszner P., 2000.Genesis, analysis
and classification of soils (in Polish). Agric.Univ. Press, Poznañ, Poland.
Polish Society of Soil Science,1989.Systematics of Polish Soils (in Polish). Roczniki Gleboznawcze, 40, 3/4, 7-150. Ry¿ak M., Walczak R.T., and Niewczas J., 2004.Comparison of
particle size distribution in soils from laser diffraction and sedimentation methods (in Polish). Acta Agrophysica, 4(2), 509-518.
S³awiñski C., Walczak R.T., and Skierucha W., 2006. Error analysis of water conductivity coefficient measurement by instantaneous profiles method. Int. Agrophysics, 20, 55-61. Taubner H., Roth B., and Tippkotter R., 2009.Determination of
soil texture: comparison of the sedimentation method and laser-diffraction analysis. J. Plant Nutr. Soil Sci., 172, 161-171.
Usowicz B., Lipiec J., and Usowicz J.B., 2008. Thermal conduc-tivity in relation to porosity and hardness to terrestrial porous media. Planet. Space Sci., 56, 438-447.
Walczak R.T., Witkowska-Walczak B., and S³awiñski C., 2004. Development of Pedotrasfer Functions in Soil Hydrology. (Eds Y. Pachepsky, W.J. Rawls). Elsevier Press, Amsterdam-Boston-Sydney-Tokio.
Witkowska-Walczak B., Walczak R.T., and S³awiñski C., 2002. Correlation model for water retention prediction with soil structure parameters.Polish J. Soil Sci., 35(1), 11-18. W³odarczyk T., Stêpniewski W., Brzeziñska M., and Przywara
G., 2008. Impact of different aeration conditions on the content of extractable nutrients in soil. Int. Agrophysics, 22, 371-375.