4422 DEVELOPMENT AND VALIDATION OF NEW RP-HPLC METHOD WITH UV DETECTION FOR THE DETERMINATION OF PYRAZINAMIDE IN PLASMA
P. Sabitha1*, J.vijaya Ratna 2 and K. Ravindra Reddy1.
1Department of Pharmaceutics, P. Rami Reddy Memorial College of Pharmacy, Kadapa,
Andhra Pradesh, India.
2.Professor, University College of Pharmaceutical sciences, Andhra University, Visakhapatnam,
India.
*Corresponding Author E-mail: [email protected]
ARTICLE INFO ABSTRACT
Key Words
Pyrazinamide, HPLC, Reversed phase chromatography.
A simple, specific and sensitive HPLC method was developed for the determination of Pyrazinamide in plasma. Separation was achieved by reverse phase chromatography on a C18 column with a mobile phase composition of phosphate buffer pH 7.4: methanol (98:2) at 268 nm. The retention time of Pyrazinamide was 8.14 minutes. The assay was linear from 0.05 to 20.0 μgm /mL for plasma. Both intra-day and inter-day accuracy and precision data showed good reproducibility. Recoveries (extraction efficiency) for drug were greater than 96.78% in plasma. The plasma method was precise (coefficient of variation in amounts estimated was less than 2.15%) for the analytes.
INTRODUCTION:
Tuberculosis is one of the major communicable diseases in the developing countries. The therapeutic potential of Pyrazinamide (PYZ) in tuberculosis is well recognized due to its unique ability to kill semi dormant tubercule bacilli
(Mycobacterium tuberculosis), when they
undergo sporadic bursts of metabolism and growth1-3. Pyrazinamide is, chemically Pyrazine-2-Carboxamide (PYZ) (Fig.1). Pyrazinamide is a synthetic pyrazinoic acid amide derivative with bactericidal property. Pyrazinamide is particularly active against slowly multiplying intracellular bacilli (unaffected by other drugs) by an unknown mechanism of action. Its bactericidal action is dependent upon the presence of bacterial pyrazinamidase, which removes the amide
group to produce active pyrazinoic acid. Pyrazinamide is an important component of multidrug therapy for tuberculosis. It is still regarded as a primary and an important component of treatment of tuberculosis. It is a bactericidal drug, effective against M.tuberculosis but most atypical mycobacteria are not inhibited. Pyrazinamide is one of the most powerful drugs against TB. It can be used alone or in combination with other drugs, such as rifampicin (RIF) and isoniazid (INH), in treatment of tuberculosis, leprosy and other infectious diseases specially those resulting from AIDS. Pyrazinamide is an important first line drug prescribed throughout TB therapy4, often as part of
fixed dose combination (FDC) tablets, which may also contain rifampicin and An Elsevier Indexed Journal ISSN-2230-7346
4423 isoniazid. Although FDCs simplify the
prescribing process and encourage compliance5, the absorption of PYZ from
these formulations may vary, especially in tablets containing rifampicin6, and contribute to treatment failure. Treatment failure and the development of drug resistance may be attributed to noncompliance with the treatment regime, poor bioavailability of PYZ due to the presence of isoniazid and rifampicin in some preparations, including some FDCs as described; counterfeit preparations, or malabsorption of drugs. While directly observed therapy (DOT) may address the first issue, it can-not address treatment failure due to the latter two causes. Currently, plasma levels of PYZ are not monitored routinely in TB patients but it is clear that this would be advantageous if a simple and effective quantitative test were available. A number of methods for the determination of PYZ in plasma have been reported7-12. These methods are characterized by lengthy sample preparation procedures11, lower recovery 8;
plasma levels were found to be sub therapeutic 7, determination in 0.1M Hcl dissolution medium and in simulated gastric fluid 9, determination in urine10 and
biological fluids12. The high occurrence of tuberculosis in HIV infected subjects makes the management of HIV treatment complex. Due to the increasing necessity to monitor plasma concentrations in HIV patients with tuberculosis, different methods such as spectrophotometry13,14,
colorimetry15,16,17, multivariate spectrophotmetry18, first derivative UV spectrophotometry16,19, HPTLC20 and high
performance liquid chromatography7-12
have been developed to measure PYZ alone or in the presence of INH. These methods are expensive and need more expertise in experimentation. Earlier, PYZ in plasma/serum was quantified by microbiological methods 21 but these
methods lacked precision and selectivity22, and does not permit separate determination of Pyrazinamide in biological fluids23. In
the recent past, several HPLC procedures have been reported in the literature for quantitative estimation of PYZ and its metabolite, in serum/plasma or urine. But many of these methods suffer from limitations such as lengthy and tedious procedures, high plasma/serum sample volumes required, large quantities of solvents involved etc. The present study was undertaken with the objective to develop and validate a simple, sensitive HPLC assay procedure for the determination of Pyrazinamide in plasma by modifying certain experimental conditions of the existing methods to enable good resolution of Pyrazinamide peak with shorter run time. After a number of trials using different combinations, we arrived at the present mobile phase and wavelength.
MATERIAL AND METHODS
Pure Pyrazinamide standard was obtained from Lupin laboratories, India. Methanol used was of HPLC grade obtained from Merck (Mumbai, India). The chemicals, potassium dihydrogen orthophosphate, disodium hydrogen phosphate, and ascorbic acid were of analytical grade. Triple distilled water filtered through 0.45 mm membrane filter was used in all the experiments.
Instrumentation
A gradient HPLC (Waters HPLC
system, Millipore, Billerica, USA) with
two 515 and 717 pumps, a rheodyne manual injector (Rheodyne, Cotati, CA, USA) attached with a 20 μL sample loop was used for loading the sample. a variable wavelength programmable UV/VIS Detector (Waters, Milford Massachusetts, USA)., an SCL-10A VP system controller (waters) , and a reversed phase C -18 column (250m×4.0mm ID; particle size 4 μm)(waters associates) were used. The HPLC system was equipped with the MILLENNIUM32 software
4424
acquisition and processing. The mobile
phase was prepared with methanol and phosphate buffer pH 7.4 (with 18.7 ml of 0.02 M KH2PO4 and 80.3 ml of 0.02 M
Na2HPO4.2H2O.) in the ratio of 2:98. The
components of the mobile phase were filtered before use through 0.45 μm membrane filter and degassed for 15 minutes and the respective solvent reservoir were pumped to the column at the flow rate of 1.5 mL/min. The column temperature was maintained at 300 C and the volume of the injection loop was 20μl. The column was equilibrated for atleast 30 minutes with the mobile phase. The eluent was detected by UV detector at 268nm for Pyrazinamide. The chromatogram was run for 8.50 mins. Unknown concentrations were derived from the linear regression analysis of the peak height vs
concentration curve. Linearity was verified using estimates of correlation coefficient (r).
Preparation of standard solution
Primary stock solution of 1mg/mL of Pyrazinamide was prepared in distilled water. Appropriate dilutions of Pyrazinamide from stock solution were made in mobile phase to produce working stock solutions of 0.05, 0.1, 0.5, 1, 2 , 5, 10, 20 μgm/mL. These dilutions were used to spike plasma in the preparation of a calibration curve. Pyrazinamide spiked plasma samples were prepared by mixing 1 mL blank plasma with appropriate volumes of the standard Pyrazinamide solutions (100μL) on the day of analysis. A blank was also prepared containing 1 mL blank plasma. The samples were estimated for Pyrazinamide by HPLC on the same day to avoid any degradation. Samples for the determination of recovery, precision and accuracy were prepared by spiking blank plasma with blanks of appropriate concentrations (2, 5 and 10 μgm/mL) of Pyrazinamide. After preparation, the samples were stored at -20
oC till the time of analysis.
Extraction procedure
Plasma was spiked with varying quantities of Pyrazinamide stock solution prepared as above, so as to give a series of drug concentrations ranging from 0.05-60 μgm/ml. 100μl of plasma was deproteinated by adding 0.2ml of 0.7M perchloric acid24. The mixture was vortexed for 10 minutes and centrifuged at 4000 rpm in a microcentrifuge (Spinwin, India) for 5 minutes. The supernatant (40 μl) was neutralized with 1M NaOH and 20 μl was directly injected into the HPLC.
Linearity, Limit of detection and Limit of quantification
The calibration samples were prepared by spiking 1 mL of blank plasma with appropriate amount of Pyrazinamide on the day of analysis. The limit of detection (LOD) is the lowest level of the drug that can be detected in sample. The limit of quantification (LOQ) was defined as the lowest concentration at which the coefficient of variation (CV) and deviation from the nominal concentration were less than 20%.
Assay validation
The intra- and inter- run precision and accuracy of the assay (n= 6) were determined by percent coefficient of variation based on reported guidelines25 like FDA guidelines. Samples containing 2.5, 5 and 10 μgm/mL concentration were prepared for the determination of precision and accuracy.
Extraction efficiency
4425 found in plasma sample with the peak area
obtained by direct injection of pure standard with equivalent amounts of Pyrazinamide.
RESULTS AND DISCUSSION
Chromatography
The chromatograms of blank plasma and plasma samples containing Pyrazinamide are shown in figures 2 and 3. In this analytical process, Pyrazinamide was resolved with good symmetry and retention time of Pyrazinamide was 8.148 mins (as shown in figure 3). No endogenenous interfering peaks were observed in the individual blank plasma at the retention time of Pyrazinamide, thereby conforming the specificity of the analytical method.
Limit of quantification
The peak area of Pyrazinamide was
used for the quantification of Pyrazinamide in plasma samples. The calibration curves were linear in the concentration range 0.05-20 μg/mL. The type of regression equation is y=mx+c, where y represents the peak area of Pyrazinamide, x represents the concentration of Pyrazinamide, m is the slope of the curve and c is the intercept. The equation of the calibration curve obtained from 8 points ranging from 0.05-20 μg/mL is Y=241605.9914X-114043.193. The correlation coefficient (R2) between Pyrazinamide concentration
and peak area of Pyrazinamide in plasma is 0.9999. The LOQ, established by determining the concentrations of Pyrazinamide in three spiked calibration standards having reproducibility with a coefficient of variation less than 20% ( in case of LOD it should be <25%) and an accuracy of 80-120%, was found to be 0.05 μg/ml . The LOD was 0.01 μgm/mL with coefficient of variation (%CV) less
than 25%. The intra day precision of the assay was determined by analyzing plasma samples at each concentration on the same day. For the determination of inter day precision, the samples were analyzed on five different days. The intra day and inter day coefficient of variation (%CV) values are shown in Table 1. These values are within the limits specified for inter and intra day precision26. The recovery of Pyrazinamide from plasma was estimated at 5, 10 and 20 μgm/mL concentrations. Plasma samples (in triplicate) containing Pyrazinamide were extracted and were analyzed. Triplicate samples containing similar concentrations of Pyrazinamide in mobile phase were directly injected, and peak areas were measured. Recovery was calculated by comparing the peak areas of pure samples spiked with the same amount of Pyrazinamide and proceeded similarly. The recoveries ranged from 5.11-20.68 μgm/mL and are shown in Table 2. The accuracy of the method was verified by comparing the concentrations of Pyrazinamide measured in extracted plasma with the actual concentration added. Accuracy ranged from 96.78-102.26 %
CONCLUSION
4426
Table 1: Intraday and interday accuracy and precision of the assay.
Pyrazinamide concentration (μgm/ml)
Amount of Pyrazinamide (μgm/ml) found on Intra-day (% CV) , n=6 Inter-day (%CV), n=6
7.5 15.0 30.0
7.67(2.08) 14.73(2.15) 29.53(1.43)
7.54 (1.32) 14.87(2.03) 29.71 (1.32)
Table 2: Recovery and accuracy of the proposed method.
Amount of drug added
(μgm) (μgm) recovered (n=6) Mean (± S.D) amount Mean (± S.D) % of recovery (n=6)
5 10 20
5.11± 0.09 10.33 ± 0.26
20.68± 0.03
102.26 ± 1.97 101.95 ± 2.57 96.78 ± 0.15
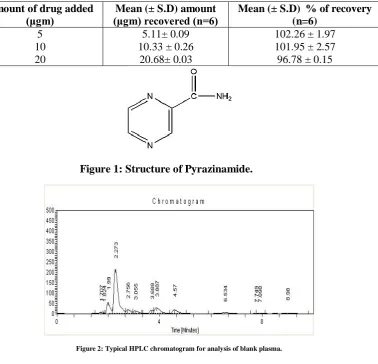
Figure 1: Structure of Pyrazinamide.
Figure 2: Typical HPLC chromatogram for analysis of blank plasma.
4427
Y=241605.9914X-114043.193 r=0.9999
0 2000000 4000000 6000000 8000000 10000000 12000000 14000000 16000000
0 10 20 30 40 50 60 70
Concentration(μg/ml)
M
e
a
n
p
e
a
k
a
re
a
Figure 4: Calibration curve for Pyrazinamide in plasma (n=6)
ACKNOWLEDGEMENT
The authors are thankful to Lupin labs for providing authentic Pyrazinamide.
REFRENCES
1. Mitchison D.A. Chest. 1979; 76: 771–781.
2. Dutt A.K., Stead W.W, Clin. Chest Med. 1980; 1:243– 252.
3. Girling D.J. Biology of the Mycobacteria, Academic Press, 1989, 285–323.
4. Mandell G.L. Bennett J.E,. Dolin R, Principles and Practice of Infectious Diseases, 4th ed., Churchill Livingston, London, 1995; 2226–2228.
5. WHO for TB/HIV:
http://www.who.int/tb/hiv/faq/en/in dex.html (15/09/05).
6. Shishoo C.J, Shah S.A., Rathod I.S, Savale S.S., Kotecha J.S., Shah P.B. Int. J. Pharm. 1999; 190:109– 123.
7. Unsalan s. LC ; Sancar. M. ; Bekce B. ; Clark P. M.Karagoz T. ; Izzettin F. V. ; Rollas S. Therapeutic montoring of
isoniazid, Pyrazinamide and rifampicin in tuberculosis patient using LC Chromatographia . 2005; 61:595-598.
8. Smith P.J., van Dyk J, Fredericks A. Determination of rifampicin, isoniazid and Pyrazinamide by high performace liquid chromatography after their simultaneous extraction from plasma. Int. J. Tuberc. Lung Dis. 2005; 3(11),:S325–S328.
9. Mariappan T T, Singh S, Pandey R and Sharma A. Isonicontinyl hydrazone of rifampicin and isoniazid: should it be controlled as a related substance ( or impurity) in USP monographs on anti-tuberculosis combination products, Pharmacopeial Forum (USP). 2005; 31:646-52.
10.Panchagnula R., Sood A., Sharda N., Kaur K, Kaul C.L. Determination of rifampicin and its main metabolite in plasma and urine in presence of Pyrazinamide and isoniazid by HPLC, method. J. Pharm. Biomed. Anal. 1999; 18:1013–1020.
4428 Dumontet, Rapid, specific and
sensitive method for isoniazide determination in serium, Journal of Chromatography. 1996; 675:113-117.
12.Csiba A. Colorimetric determination of isoniazid in aqueous solutions and biological fluids. Acta Pharm Hung. 1989; 59:205-12.
13.Devani M B, Shishoo C J, Patel M A and Bhalara D D. Spectrophotometric determination of isoniazide in presence of its hydrazones. J Pharm Sci. 1978; 67: 661-3.
14.Barsoun N, Barsoum, Manal S, Kamel and Mohamed M A. Spectrophotometric determination of isoniazid anf rifampicin from pharmaceutical preparations and biological fluids. Res J Agr and Bio Sci. 2008; 4: 471-484
15.Ellard G A. The colorimetric analysis of anti-tuberculosis fixed-dose combination tablets and capsules. Int J Tuber Lung Dis. 1999; 13: 34-76.
16.Benetton, Spectrophotometric anf first-derviative UV spectrophotometric determination of rifampicin and isoniazid in pharmaceutical preparations. Talanta. 1998; 47: 639-643.
17.Stewart and Settle. Colorimetric determination of Pyrazinamide. J Pharm Sci. 1975, 64: 1403-05.
18.Hector C. Goicoechea and Alejandro C Olivieri. Simultaneous determination of rifampicin, isoniazid and Pyrazinamide in tablet preparation by multivariate spectrophotometric calibration. J. Pharm. Biomed. Anal. 1999; 20: 681-686.
19.Rote and Sharma, Simultaneous spectrophotometric determination of rifampicin, isoniazid and Pyrazinamide by first derivative UV spoectrophotometry in combined pharmaceutical dosage forms. Ind J Pharm Sci. 1997; 59: 119-23.
20.Ma A, Simultaneous densitometric determination of rifampicin, isoniazide and Pyrazinamide by high-performnance thin-layer chromatography. Journal of Planar Chromatography-Modern TLC. 2005; 8: 207-211.
21.Scott, Fluorimetric determination of isonicotinic acid hydrazide in Plasma. Journal of Laboratory and Clinical Madicine. 1967; 70: 355-60.
22.Ain, Q. Aliginate based oral drug delivery system for tuberculosis: pharmacokinetics and therapeutic effects. Journal of Antimicroibia Chemotherapy. 2003; 51: 931-8.
23.Rajesh Pandey and G. K. Khuller. Chemotherapeutic potential of alginate-chitosan microspheres as anti-tubercular drug carrier. Journal of Antimicroibial Chemotherapy. 2004; 53: 635-640.
24.Revankar, Bhatt and Anjaneyulu B. Determination of Pyrazinamide in human by high performance liquid chromatography. Journal of Postgraduate Medicine. 1994; 40: 7-9.
25.Shah, V. P, Midha K K, Findlay, J. W, Hill, H. M. Pharm Res. 2000; 17:551.
26.Bressolle, F, Bromet, M, Audran M. J Chromatogr. B. 1996; 686.