Estimation Approach to Ratio of Two Inventory
Population Means in Stratified Random Sampling
Subhash Kumar Yadav1, S. S. Mishra1,*, Alok Kumar Shukla2
1Department of Mathematics and Statistics (A Centre of Excellence), Dr. RML Avadh University, Faizabad, U.P., India 2Department of Statistics, D.A-V, College, Kanpur, U.P., India
Abstract
The present paper proposes a new approach of estimation to the inventory system which undergoes the process of stratification by using the technique of stratified random sampling. This seeks to develop the estimation of ratio of two population means using auxiliary variable under stratified random sampling through generalized ratio type estimator. The statistical analyses of existing estimators and proposed estimator have been discussed and condition of efficient estimator has been attained. With the help of computing algorithm, a numerical illustration of the problem has been also presented to meet the scientific footings of theory of estimation.Keywords
Stratified Inventory, Ratio Estimator, Auxiliary Variable and Computing Algorithm1. Introduction
Usable and idle resources referring to man, material, machine and money are called inventory items; vide Ackoff and Sasieni (1993). Heterogeneous inventory items are stratified for optimal control of inventory system. Stratification of inventory system attempts to provide the mechanism to optimize the inventory control for each stratum which is believed to be very efficient and easily minimizes the costs. This also makes handling of inventory easy for each stratum and accordingly the stratum domain experts are supposed to supervise the field works of the inventory handling and management, vide for example Alex and Benny (2009). In this situation, stratified random sampling is used to develop the efficient estimator to estimate the population parameters of stratified inventory items for characteristics under study is not homogeneous, vide for example Cochran (1940, 1977). A few researches are available in this field and therefore demands deep exploration in this area of interdisciplinary research. Under this sampling scheme, the whole population of inventory items is divided into relatively homogeneous groups. Then the required sample is drawn by taking appropriate subsamples from these stratums using simple random sampling technique.
The fresh objective of this paper is to develop estimation approach to the ratio of two population means in stratified inventory system by evolving the efficient estimator using
* Corresponding author:
[email protected] (S. S. Mishra) Published online at http://journal.sapub.org/ajor
Copyright © 2015 Scientific & Academic Publishing. All Rights Reserved
stratified random sampling technique for inventory populations under consideration. This proposes estimation of ratio of two population means using auxiliary variable under stratified random sampling through generalized ratio type estimator. The expressions for the bias and mean square error (MSE) have been obtained up to the first order of approximation. The minimum MSE of proposed estimator is also obtained. An empirical study is also carried out to meet the theoretical findings.
2. Statistical Analysis
The estimation of the ratio of two population means has been studied by many authors in the literature including Murthy and Singh (1965), Rao and Pareira (1968), Shah and Shah (1978), Ray and Singh (1985), Upadhyaya and Singh (1985), Upadhyaya et.al (1985), Singh and Rani (2005, 2006) and Sindhu et. al (2009) etc.
Let us consider the population of inventory items under study consisting of N units and this population of size N is divided into L stratums each of size
N
h (h
=
1,2,...,
L
) and the required sample of size n is drawn by takingn
h (h
=
1,2,...,
L
) units from corresponding strata. Thus1
L h h
N
N
=
=
∑
and1
L h h
n
n
=
=
∑
. Lety
0andy
1 be the twomain variables under study and
x
be the auxiliary variable. 0hiNow we have the following notations which have been used throughout this paper.
0 0
1
1
Nhh hi
h i
Y
y
N
==
∑
, the hth strata mean for the mainvariable under study
y
0.1 1
1
1
Nhh hi
h i
Y
y
N
==
∑
, the hth strata mean for the mainvariable under study
y
1.1
1
Nhh hi
h i
X
x
N
==
∑
, the hth strata mean for the auxiliary variable under studyx
.0 0 0
1 1
1
L Lh h h h
h h
Y
N Y
W Y
N
= ==
∑
=
∑
, the inventorypopulation mean for the main variable under study
y
0.1 1 1
1 1
1
L Lh h h h
h h
Y
N Y
W Y
N
= ==
∑
=
∑
, the inventorypopulation mean for the main variable under study
y
1.1 1
1
L Lh h h h
h h
X
N X
W X
N
= ==
∑
=
∑
, the inventorypopulation mean for the auxiliary variable under study
x
.0 0
1
1
nhh hi
h i
y
y
n
==
∑
, the sample mean ofy
0 for hth strata.1 1
1
1
nhh hi
h i
y
y
n
==
∑
, the sample mean ofy
1 for hth strata.1
1
nhh hi
h i
x
x
n
==
∑
, the sample mean ofx
for hth strata.h
h
N
W
N
=
, the weight of hth strata.0 1
Y
R
Y
=
, the ratio of two population means of studyvariables.
It is well known that the appropriate estimators for the estimation of inventory population parameters are the corresponding statistics. Thus appropriate estimators for population means
Y
0,Y
1 andX
are the usual unbiased estimators, the sample means in stratified random sampling0 0
1
L
st h h
h
y
W y
=
=
∑
, 1 11
L
st h h
h
y
W y
=
=
∑
and1
L
st h h
h
x
W x
=
=
∑
respectively.The conventional estimator for the ratio of two population means R in stratified random sampling is defined as,
0 1
ˆ
st st sty
R
y
=
(2.1)As it is well known that the use of auxiliary information supplied by the auxiliary variable enhances the efficiency of the estimator of any parameter, so Singh (1965) proposed the traditional ratio type estimator of ratio of two population means using auxiliary information in stratified random sampling as, 0 1 1 st st st st
y
X
G
y
x
=
(2.2)The bias and mean square error of
G
1st, up to the first order of approximations respectively are,2 2
1 01
2 2
2 1 0 1
1
1 0 1
0 1
(
)
h xh h
L
st h h
h xh xh
S
S
S
Y Y
Y
X
B G
R W
S
S
Y X Y X
γ
=
+
−
=
+
+
∑
(2.3)2 2 2
0 1
2 2 2
0 1
2 2
1
1 01 0 1
0 1 0 1
(
)
2
h h xh
L
st h h
h h xh xh
S
S
S
Y
Y
X
MSE G
R
W
S
S
S
Y Y Y X Y X
γ
=
+
+
=
−
+
−
∑
(2.4) Jan et.al (2014) proposed the following modified estimator using median (Md) of the auxiliary information as,0 2 1 st d st st st
y
X M
G
y
x
+
=
(2.5)The bias and mean square error of
G
2st, up to the first order of approximation is,2 2
1
2 2
1
2 01 0
2
0 1 0
1 1 1
(
)
(
)
(
)
(
)
h xh d L h xhst h h
d h
xh d
S
S
Y
X M
S
S
B G
R W
Y Y Y X M
S
Y X M
γ
=
+
+
=
−
+
+
+
+
2 2 2
0 1
2 2 2
0 1
2 2
2
1 01 0 1
0 1 0 1
(
)
2
h h xh
L
st h h
h h xh xh
S
S
S
Y
Y
MSE G
R
W
S
S
S
Y Y
Y
Y
θ
γ
θ
θ
=
+
+
=
−
+
−
∑
(2.7) where,(
X M
d)
θ =
+
,(
)
22
0 0 0
1
1
1
h
N
h hi h
h i
S
y
y
N
==
−
−
∑
,(
)
22
1 1 1
1
1
1
h
N
h hi h
h i
S
y
y
N
==
−
−
∑
,(
)
22 1
1
1
h Nxh hi h
h i
S
x
x
N
==
−
−
∑
,(
)(
)
01 0 0 1 1
1
1
1
h
N
h hi h hi h
h i
S
y
y
y
y
N
==
−
−
−
∑
,(
)(
)
0 0 0
1
1
1
h
N
xh hi h hi h
h i
S
y
y
x
x
N
==
−
−
−
∑
,(
)(
)
1 1 1
1
1
1
h
N
xh hi h hi h
h i
S
y
y
x
x
N
==
−
−
−
∑
3. Statistical Analysis of Proposed
Estimator
Motivated by Jan et.al (2014), we propose the following generalized estimator for the ratio of two inventory population means as,
0 1
st d
st
st st d
y
X M
y
x
M
α
τ
=
+
+
(3.1)Where
α
is a suitable constant be determined such that the mean square error ofτ
st is minimum.In order to study the large sample properties of the proposed estimator we have assumed that,
0h 0h
(1
0h)
y
=
Y
+
e
,y
1h=
Y
1h(1
+
e
1h)
and 2(1
)
h h
x
=
X
+
e
such thatE e
( )
0h=
E e
( )
1h=
E e
( )
2h And2
2 2 0
0 2
1 0
( )
L hh h h
h
S
E e
W
Y
γ
=
=
∑
,2
2 2 1
1 2
1 1
( )
L hh h h
h
S
E e
W
Y
γ
==
∑
, 2 2 2 2 2 1( )
L xhh h h
h
S
E e
W
X
γ
==
∑
, 2 01 0 1 0 1 1(
)
L hh h h h
h
S
E e e
W
Y Y
γ
==
∑
, 2 0 0 2 0 1(
)
L xhh h h h
h
S
E e e
W
Y X
γ
==
∑
, 2 1 1 2 1 1(
)
L xhh h h h
h
S
E e e
W
Y X
γ
==
∑
.Using above expressions, the bias and the mean square error of the proposed estimator, up to the first order of approximation respectively are,
2 2 2
1 1
2 2
1 2
1 01 1 0 1 1
0 1 0 1
(1
)
2
2
( )
h xh
L
st h h
h h xh xh
S
S
Y
X
B
R W
S
S
S
Y Y
Y X
Y X
α
α θ
τ
γ
αθ
αθ
=
+
+
=
−
+
−
∑
(3.2)2 2 2 2 2
0 1 1
2 2 2
0 1
2 2 01 0
1
1 0 1 0
1 1
1
( )
2
h h xh
L
h xh
st h h
h
xh
S
S
S
Y
Y
X
S
S
MSE
R
W
Y Y
Y X
S
Y X
α θ
τ
γ
αθ
αθ
=
+
+
=
+
−
−
∑
(3.3)where, 1
d
X
X M
θ
=
+
.This mean square error is minimum for,
2 0 1
0 1 1 2 2 1 2 1 L xh xh h h h L xh h h h
S
S
W
Y X Y X
S
W
X
γ
α
θ
γ
= =
−
=
∑
∑
(3.4)And the minimum mean square error is,
2 2
2 0 1 01
2 2
0 1
1 0 1
2
2 2 0 1
min 0 1 1 2 2 2 1 2 ( ) L
h h h
h h h
L
xh xh
st h h
h L
xh h h h
S S S
W
Y Y
Y Y
S S
MSE R W
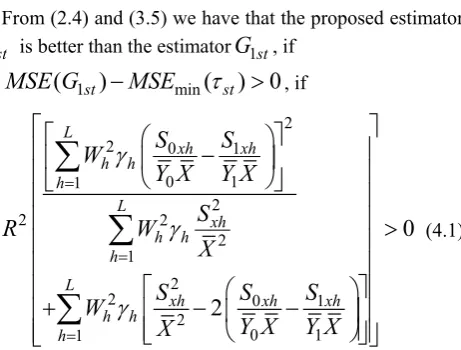
4. Efficiency Comparison
From (2.4) and (3.5) we have that the proposed estimator
st
τ
is better than the estimatorG
1st, if1 min
(
st)
( ) 0
stMSE G
−
MSE
τ
>
, if2
2 0 1
0 1
1
2
2 2
2 1
2
2 0 1
2
0 1
1
0
2
L
xh xh h h
h L
xh h h h
L
xh xh xh
h h h
S
S
W
Y X Y X
S
R
W
X
S
S
S
W
Y X Y X
X
γ
γ
γ
=
=
=
−
>
+
−
−
∑
∑
∑
(4.1)
Under the above laid down condition, the proposed estimator is believed to perform more efficiently than the estimator
G
1st considered in (2.2) of ratio of two population means for it will have lesser mean squared error as compared toG
1st.From (2.7) and (3.5) we have that the proposed estimator
st
τ
is better than the estimatorG
2st, if2 min
(
st)
( ) 0
stMSE G
−
MSE
τ
>
, if2
2 0 1
0 1
1
2
2 2
2 1
2
2 0 1
2
0 1
1
0
2
L
xh xh h h
h L
xh h h h
L
xh xh xh
h h h
S
S
W
Y X Y X
S
R
W
X
S
S
S
W
Y
Y
γ
γ
γ
θ
θ
θ
=
=
=
−
>
+
−
−
∑
∑
∑
(4.2)
The proposed estimator
τ
st given in (3.1) is supposed to provide to lesser mean squared error as compared toG
2st under the laid down condition in (4.2).In brief, the physical significance of expressions given in (4.1) and (4.2) attempts to seek exceedingly better estimator having least mean square error as compared to previously existing ones.
5. Computing Algorithm and Numerical
Illustration
The following algorithm has been developed to compute the estimator and its efficiency.
i. Begin
ii. Data input
iii. Compute sample mean of first inventory population iv. Compute sample mean of second inventory
population
v. Compute sample and population means of auxiliary inventory population
vi. Compute estimator for ratio of two inventory populations
vii. Compute biases for all estimators viii. Compute MSE
ix. Compute efficiency (Percentage Relative Efficiency-PRE)
x. If PRE is greater than previous ones xi. Find efficient estimator
xii. Data output xiii. End
Figure 5.1. Tabular form of the algorithm (Computing flow chart)
Start
End Is diff greater than zero
Input for PRE
Output PRE Define Means
Compute MSE
Compute Diff
No
Find Estimator
Compute PRE Yes
Condition Attained
Table 5.1. Computed Data Statistics
01 91.40
Y = Y02 =109.20 Y11=577.80 Y12 =609.60
1 3757
X = X2 =4049.60 S y01( ) 4.0373= S y02( ) 6.1400=
11( ) 38.78402
S y = S y12( ) 43.0848= Sx1=40.5401 Sx2 =126.7292
011 84.60
S = S012 =245.10 S0 1x =139.50 S0 2x =761.35
1 1x 860.50
S = S1 2x =4597.55 M xd( ) 3853.50=
Table 5.2. Computed Bias, MSE and PRE of different estimators w.r.t.
G
1stEstimators BIAS M S E PRE
1st
G
1.24E-04 1.09141E-05 1002st
G
8.41E-05 8.94115E-06 122.06st
τ
-9.94E-06 8.18904E-06 133.27To meet out the theoretical findings, we have considered the data in Murthy (1967) where the main variables
y
0and1
y
are the number of workers and the fixed capital respectively along with the output as the auxiliary variable. The size of the population is 10 and is divided into two stratums each of size 5. The sample size is 4 by taking 2 from each stratum. Following are the parameters computed.6. Observations and Conclusions
When inventory items are heterogeneous and huge, the estimation approach is only panacea for estimating the characteristics of inventory populations under consideration which otherwise seems difficult to control and manage for any organization. So for the estimation of ratio of two inventory population means have been discussed in paper, one is man-inventory population and another is money-inventory population as defined by Ackoff and Sasieni (1993).
Under the section numerical illustration, two heterogeneous inventory populations are given whose estimators are given thereafter final estimator as ratio has been developed whose bias and mean square errors are lesser than all previous estimators and percentage relative efficiency is given which is higher than previous ones, vide table 5.2, row 3.
Thus proposed estimator is most efficient estimator of ratio of two inventory population means using auxiliary information among such estimators as it has lesser mean square error. Thus the proposed estimator should be preferred for the estimation of ratio of two inventory population means.
REFERENCES
[1] Ackoff R L and Sasieni M W (1993), Fundamentals of Operations Research, Wiley Eastern Ltd.
[2] Cochran W G (1940), the estimation of yields of cereal experiments by sampling for the ratio of grain to total produce, Jour. Agri. Sci., 59, 1225-1226.
[3] Cochran W G (1977), Sampling Techniques, Wiley Eastern Ltd, third edition.
[4] Gershkov Alex and Moldovanu Benny (2009), Dynamic Revenue Maximization with Heterogeneous Objects: A Mechanism Design Approach, American Economic Journal: Microeconomics, Volume 1, Number 2, pp. 168-198(31). [5] Jan, R Maqbool, S Ahmad, A and Nazir, A (2014), Modified
Ratio Type Estimator of Two Population Means in Stratified Sampling, Indian Streams Research Journal, 4,5, 1-6. [6] Murti M N and Singh M P (1965), On the estimation of ratio
and product of the population parameters, Sankhya, B, 27, 321-328.
[7] Rao J.N.K. & Pereira N.P. (1968), On double ratio estimators,
Sankhya, A, 30, 83-90.
[8] Ray S.K. & Singh R.K. (1985), Some estimators for the ratio and product of population parameters. Journal of the Indian Society of Agricultural Statistics, 37 (1), 1-10.
[9] Shah S.M. & Shah D.N. (1978), Ratio-cum-product estimator for estimating ratio (product) of two population parameters,
Sankhya, C, 40 (2), 156-166.
[11] Singh G.N. and Rani R. (2005, 2006), Some linear transformations on auxiliary variable for estimating the ratio of two population means in sample surveys, Model Assisted Statistics and Applications, 1(1), IOS Press, 1-5.
[12] Upadhyaya L.N. & Singh H.P. (1985), A class of estimators
using auxiliary information for estimating ratio of two finite means. Gujarat Statistical Review, 12(2), 7-16.
![1 [(4S) 4 Benzyl 2 thioxo 1,3 thiazolidin 3 yl]propan 1 one†](data:image/gif;base64,R0lGODlhAQABAIAAAP///wAAACH5BAEAAAAALAAAAAABAAEAAAICRAEAOw==)