Research Article ISSN 2250-0480 VOL 4/ISSUE 1/JAN-MAR 2014
SPECTROSCOPIC PROPERTIES AND ESTIMATION OF GROUND
AND EXCITED STATE DIPOLE MOMENTS OF
BIOLOGICALLY ACTIVE FLUORESCENT MOLECULE
FROM ABSORPTION AND EMISSION SPECTRA
SHIVARAM N. PATIL1, F.M. SANNINGANNAVAR2*, B.S NAVATI2, N.R. PATIL3,
R.A. KUSANUR4 AND R.M. MELAVANKI5*
1
Department of Physics, NAVKIS PU Academy, Mysore 570010, Karnataka, India
2
Department of Physics, Karnataka Science College, Dharwad 580003, Karnataka, India
3
Department of Physics, B V B College of Engineering and Technology, Hubli 580031, Karnataka, India
4
Department of Chemistry, R V College of Engineering, Bangalore 560059, Karnataka, India
5
Department of Physics, M S Ramaiah Institute of Technology, Bangalore 560054, Karnataka, India
ABSTARCT
The absorption and emission spectra of fluorescent molecule namely 6-Methyl-3-[1-(4, 5-dicarbomethoxy-1, 2, 3-triazoloacetyl)] coumarin (6MDTC) has been recorded at room temperature in solvents of different polarities. The exited state (µe) dipole moment was estimated from Lippert’s, Bakhshiev’s and Kawski-Chamma-Viallet’s equations using the variation of Stoke’s shift with the solvents of different polarities using dielectric constant and refractive index. The geometry of the molecule was fully optimized and the ground state dipole moment (µg) was also calculated theoretically by Gaussian 03 software using B3LYP/6-31g* level of theory. The µg and µe were calculated by solvatochromic shift method and µe was also determined in combination with µg. It was observed that µe was greater than that of the µg, indicating a substantial redistribution of the π-electron densities in a more polar excited state for this coumarin. Further, the changes in dipole moment (∆µ) was calculated both from solvatochromic shift method and on the basis of microscopic empirical solvent polarity ( ) and the values are compared.
Keywords: Solvatochromic shift method, ground state and excited state dipole moments, 6MDTC and DFT.
1. INTRODUCTION
Solvatocromism is subject of interesting investigation for organic compounds [1-5]. If a molecule is excited by photon, it causes
redistribution of charges leading to
conformational changes in the excited state. Due to this there may be change in dipole moments of ground and excited state. Of which excited state dipole moment is important parameter in short lived state. There are several methods to determine excited state dipole moment experimentally. Spectral shift may be caused by
either electrochromism (External) or
solvatochromism (Internal). In the present study
solvatochromism is used which is based on the shift of absorption and fluorescence maxima in different solvents of varying polarity.
Several workers have made extensive
experimental and theoretical studies on ground state (µg) and excited-state (µe) dipole moments using different techniques in variety of organic fluorescent compounds like coumarins, indoles, purines, and fluorescein and in some laser dyes [6-19] etc.
Research Article ISSN 2250-0480 VOL 4/ISSUE 1/JAN-MAR 2014 fluorescence in the UV - VISIBLE region which
makes them suitable for used as colorants, dye laser media and as nonlinear optical chromospheres. In this paper, we report the effects of solvent on absorption and emission spectra, and estimation of ground and excited-state dipole
moments of
6-Methyl-3[1-(4,5 dicarbomethoxy 1,2,3-triazoloace tyl)] coumarin (6MDTC) by solvatochromic shift method and theoretical studies on ground state (µg) dipole moments using DFT(B3LYP/6-31g* method)[20]. However, there are no reports available in the literature on determination of µg and µe values of this molecule investigated.
2. EXPERIMENTAL 2.1. Chemicals used
The solutes of fluorescent molecule namely 6-Methyl-3-[1-(4, 5-dicarbomethoxy-1, 2,
3-triazoloacetyl)] coumarin (6MDTC) was
synthesized in our laboratory using standard methods [21-24]. The molecular structure of this molecule is given in Fig.1. The solvents used in the present study namely tetrahydrofuran, acetonitrile, dichloromethane, 1,4 dioxane, dimethyl sulphoxide, toluene and diethyl ether are used for (6MDTC). All the solvents were obtained from S-D-Fine Chemicals Ltd., India, and they were of spectroscopic grade. The required solutions were prepared at a fixed concentration of solutes 1X 10⁻⁴ M in each solvent.
O O
O
N N N
COOCH3 COOCH3
Figure 1
The molecular structures of (6MDTC)
2.2. Spectroscopic measurements
The absorption spectra were recorded using Hitachi
50–20 UV–VISIBLE spectrophotometer and
fluorescence intensities of the solutions were measured on Hitachi F-2700 Spectrofluorimeter Dept. of Physics MSRIT Bangalore-54 at room temperature with perpendicular geometry.
3. Theory
3.1 Theoretical calculations of ground-state dipole moments
The ground-state dipole moment (µg) of this molecule was calculated by quantum chemical calculations. All the computations were carried out using the Gaussian 03 program [20] on a Pentium-4 PC. The basis sets at the levels of theory B3LYP/ 6-31 g* were used for calculations and corresponding optimized molecular geometry is shown in Fig.2. The value of ground-state dipole moment obtained from ab initio calculations using DFT. Ground state optimized molecular geometry of (6MDTC) is shown in Fig. 3. The arrow indicates the direction of the dipole moment.
Figure 2
Research Article ISSN 2250-0480 VOL 4/ISSUE 1/JAN-MAR 2014
Figure 3
Ground state optimized molecular geometries of (6MDTC).
The arrow indicates the direction of the dipole moment.
3.2 Experimental calculations of excited state dipole moments
The independent equations used for the estimation of excited state dipole moment of dye are as follows Lippert’s equation [26]
Bakshiev’s equation [27]
Kawski-Chamma-Viallet’s equation [28]
The expressions for F1(ε,n) [Lippert’s polarity function], F2(ε,n) [Bakshiev’s polarity equation] and
n) , (
F3 ε [Kawski-Chamma-Viallet’s polarity equation] are given as
Where a −
ν and
−
f
ν are absorption and fluorescence maximum wavelength in cm-1 respectively. The other symbols ε and n are dielectric constant and refractive index respectively. From Eqs.6-8 it follows that
− −
− )
(νa νf versus F1(ε, n),
− −
− )
(νa νf versus F2(ε, n) and
2
− −
+ f
a ν
ν
versus F3(ε, n) should give linear graphs
Research Article ISSN 2250-0480 VOL 4/ISSUE 1/JAN-MAR 2014 Where µg and µe are the ground and excited state dipole moments of the solute molecule. The symbols 'h' and 'c' are Planck’s constant and velocity of light in vacuum respectively; 'a' is the Onsager radius of the solute molecule. If the ground state and excited states are parallel, the following expressions are obtained on the basis of Eq.10-11.
and
3.3 MOLECULAR-MICROSCOPIC SOLVENT POLARITY PARAMETER ( )
The empirical polarity parameter proposed by Richards [3] gave towering results with solvatochromic shift of dipolar molecules. The results correlate better with microscopic solvent polarity rather than the traditionally used bulk solvent polarity functions involving dielectric constant (ε) and refractive index (n) as in the later error estimation of Onsager cavity radius ‘a’ has been minimized. In the error estimation of the Onsager cavity radius has been minimized, it also includes intermolecular solute/solvent hydrogen bond donor/acceptor interactions along with solvent polarity. The theoretical basis for the correlation of the spectral band shift with was proposed by Richards and developed by Ravi et al. [29], according to Eq. (2.15)
where = 9D and are the change in dipole moment on excitation and Onsager cavity radius respectively of molecule and and are the corresponding quantities for the solute molecule of interest. A dimensionless normalized scale was introduced in order to avoid the use of non SI unit kal/mol in ET(30) solvent polarity scale and is defined by Eq. (2.16), using water ( =1) and tetramethylsilane (TMS =
= 0) as extreme reference solvents [3].
The change in dipole moment can be evaluated from the slope of the stokes shift versus plot and is given by Eq. (2.17)
Where ‘m’ is the slope obtained from the plot of Stokes shift versus microscopic solvent polarity ( ) using Eq. (2.17). The Onsager radius of the molecule can be calculated by the method suggested by Edward [30].
4. RESULTS AND DISCUSSION
4.1 Solvent effect on Absorption and Fluorescence Spectra
Research Article ISSN 2250-0480 VOL 4/ISSUE 1/JAN-MAR 2014 and 5 respectively. The observed absorption and
emission spectrum of coumarin are broad which shifts depending on the solvents. The large spectral shift is observed in the emission spectra as compared to the absorption spectra. The less pronounced shift in the absorption spectra observed in all the solvents studied implies that the ground state energy distribution is not affected to a greater
extent possibly due to the less polar nature of the coumarin in the ground state. The pronounced shift in the emission clearly indicates that the dipole moment of the excited state is higher compared to the ground state. In such cases, the relaxed exited state S1 will be energetically stabilized relative to the ground state S0 and a significant red shift of the fluorescence will be observed.
C :\Users\Shiv aram\Desk top\New Folder RMM\6MDTC TL A BS.jpg
Figure 4
Absorption Graph (6MDTC) in Toluene
C :\Users\Shiv aram\Desk top\New Folder RMM\6MDTC TL EM.jpg
Figure 5
Emission Graph (6MDTC) in Toluene
4. 2 Estimation of Ground state and Excited state Dipole moments
In order to estimate the ground state and excited state dipole moments of the solute molecule, the calculated values of spectral shifts and of fluorescent molecule along with
solvent polarity function
valuesF1(ε,n),F2(ε,n),F3(ε,n) and for various
solvents are presented in Table 1. We have used seven solvents for (6MDTC) with dielectric constants varying from 2.300 to 47.240. Fig. 6-8 show the graph of (νa -νf) versus, F1 (ε, n), (νa
-νf) versus F2 (ε, n) and (νa
+
νf)/2 versus F3 (ε, n)Research Article ISSN 2250-0480 VOL 4/ISSUE 1/JAN-MAR 2014 -νf) versus F1 (ε, n), (νa -νf) versus F2 (ε, n) and
(νa
+
νf)/2 versus F3 (ε, n) correlation is established for all the solvents used for this study. In most cases the correlation coefficients are larger than 0.9715 which indicate a good linearity for m1, m2 and m3 with all Stokes shift data points. Generally, the deviation from linearity may be due to specific solute solvent interactions. For polar solute molecule like (6MDTC) the interaction with non polar depends on the dipole –induced-dipole forces, the solute solvent interaction depends on the stronger dipole-dipole forces. It is therefore useful as pointed out by others also [31, 32] to use function which is the empirical measure of the solvent polarity [33] for understanding the polarization dependence of spectral characteristics. Unfortunately ( ) values have by dimension of kcal/mol, a unit which should be abandoned in the framework of SI units [34]. Therefore the use of the so-called normalized values have beenrecommended, which are defined in Eq. 14. The linear dependence of Stoke’s shift indicates the existence of general type of solute-solvent interaction in which the Stoke’s shift depends on the dielectric constant and refractive index of solvent polarity. Figure 9 shows that the plot of Stoke’s shift as a function of in all solvents for (6MDTC). With increasing in the solvent polarity, both absorption and emission bands undergoes a bathochromic shift. This indicates that ICT (intermolecular charge transfer) absorption of the less dipolar ground state molecule with dominant mesomeric structure leading to highly dipolar excited state and with the prominent structure of molecule. Ground state (µg) dipole moment values obtained from Eq.10 are presented in Table 3. The value of Onsager cavity radii of (6MDTC)molecule was calculated by molecular volumes and the Parachor and is listed in Table 3.
C :\Users\Shiv aram\Desk top\New Folder RMM\6MDTC F1.jpg
Figure 6
The variation of Stoke’s shift with F1 (ε, n) using Lippert equation for (6MDTC)
C :\Users\Shiv aram\Desk top\New Folder RMM\6MDTC F2.jpg
Figure 7
Research Article ISSN 2250-0480 VOL 4/ISSUE 1/JAN-MAR 2014
C :\Users\Shiv aram\Desk top\New Folder RMM\6MDTC F3.jpg
Figure 8
The variation of arithmetic means of Stoke’s shift with F3(ε, n)
using Kawski-Chamma-Viallet’s equation for (6MDTC)
C :\Users\Shiv aram\Desk top\New Folder RMM\6MDTC ETN.jpg
Figure 9
The variation of Stoke’s shift with for (6MDTC)
Table 1
Calculated values of polarity functions Solvatochromic data of (6MDTC) in different solvents
Solvents F1 (ε,n) F2 (ε,n) F3 (ε,n) λa (nm) λf (nm)
(cm-1) (cm-1) (cm-1) (cm-1)
Tetrahydrofuran 0.2097 0.5472 0.5481 0.207 360.46 441.97 27742.70 22625.86 5116.84 25184.28 Acetonitrile 0.3047 0.8625 0.6669 0.460 361.57 449.57 27657.02 22243.25 5413.77 24950.13 Dichloromethane 0.2186 0.5957 0.5856 0.321 361.47 443.83 27664.46 22531.37 5133.09 25097.91
1,4-Dioxan 0.0299 0.0611 0.3163 0.164 358.76 430.17 27873.45 23246.79 4626.66 25560.12
Dimethyl Sulphoxide 0.2637 0.8417 0.7440 0.444 363.29 451.76 27526.09 22135.58 5390.51 24830.83
Toluene 0.0135 0.0297 0.3496 0.099 359.69 430.90 27801.67 23207.23 4594.44 25504.45
Research Article ISSN 2250-0480 VOL 4/ISSUE 1/JAN-MAR 2014 Table 2
Statistical treatment of the correlations of solvents spectral shifts of (6MDTC)
Parameter1 Parameter2 Parameter3
Slope
A 2919.44
Correlation coefficient ‘r’
A 0.9715
Number of data A 7
B 910.43 B 0.9993 B 7
C 2273.38 C 0.9977 C 7
D 2201.27 D 0.8395 D 7
A-Lippert Correlation; B- Bakshiev Correlation; C- Chamma Viallet Correlation; D-
Table 3
Ground and excited state dipole moments of (6MDTC)
Compound Radius ‘a’ (Ao) µga
(D)
µgb
(D) µec
(D) µed
(D)
µee
(D)
µef
(D)
∆µg (D)
∆µh
(D) (µe/ µg)i
(6MDTC) 4.302 10.6351 1.1914 5.9975 3.8753 10.9150 3.9267 2.7354 2.2952 3.2528
Debye (D) = 3.33564X10⁻³⁰cm = 10-18 esu cm.
a
Calculated by Gaussian Software.
b
The ground states dipole moments calculated using Eq.10.
c
The experimental excited state dipole moments calculated from Lippert’s equation.
d
The experimental excited state dipole moments calculated from Bakhshiev’s equation.
e
The experimental excited state dipole moments calculated from Chamma-Viallet’s equation.
f
The excited states dipole moments calculated using Eq.11.
g
The change in dipole moments for µe f
and µg b h
The change in dipole moments calculated from Eq.15
i The ratio of excited state and ground state dipole moments values calculated using Eq.13.
The excited state (µe) dipole moments of the fluorescent molecule, estimated by computing the values of ground state (µg) dipole moment obtained from Eq. 10 is presented in Table 3. Also the excited state dipole moment (µe) value is obtained from Eq. 11. The ratio of (µe) and (µg) obtained from Eq.12 is presented in Table 3. Theoretically calculated ab initio calculations using DFT value is presented in Table 3. The calculated and theoretical ground state (µg) dipole moment result is good in agreement for our used chemical systems as shown in Table 3. Numerically higher theoretical values may be resulting from constrained use of basis set and quantum chemical methods due to limited computational facility [4, 12, 25 and 26]. It may be noted that the measured value of (µg) and (µe) for (6MDTC) differ from each other. It may be noted that the discrepancies occur between the estimated values of (µe) for the coumarin from different methods. These differences between the values of (µe) may be in part, due to the various assumptions and simplifications made in the use of Lippert’s,
Bakshiev’s and Kawski-Chamma-Viallet’s
correlations [26-28]. The large magnitude of Stoke’s shift indicates that the excited state geometry could be different from that of the ground state. The general observation is that there is an increase in Stoke’s shift with increase in solvent polarity which shows that there is an increase in the dipole moment on excitation. The Solvatochromic data can be used to identify the spectra, namely π-
Research Article ISSN 2250-0480 VOL 4/ISSUE 1/JAN-MAR 2014 O O O N N N O O O O O O O N N N O O
O O O O
O N N N O O O O O O O N N N O O O O
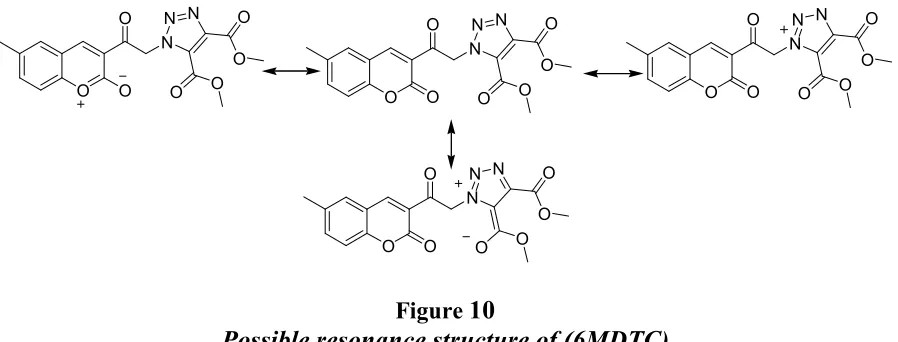
Figure 10
Possible resonance structure of (6MDTC)
5. CONCLUSION
We have estimated and compared dipole moment of the molecule (6MDTC) in electronic ground state by theoretical method and calculated ground state dipole moment by using equation 10. We have also estimated excited state dipole moment by experimental method. We found the coumarin possesses higher dipole moment value in excited state than in ground state by 2.7354 D. The considerable increase in dipole moment upon excitation suggests that excited state is ICT in
nature which is expected to increase the planarity of Coumarin upon excitation and make the molecule more polar than ground state. Numerically higher theoretical value may be resulting from constrained use of basis set and quantum chemical methods due to limited computational facility. Also Eq. 11 can be used to estimate the value of excited state dipole moment by pre-knowledge of the value of ground state dipole moment, without the necessity of knowing the Onsager radius of the solutes.
6. REFERENCES
1. K. K. Rohatgi-Mukherjee, Fundamental of Photochemistry, Wiley Eastern Ltd., N Delhi, India (1986).
2. J.R. Lackowicz, Principles of Fluorescence Spectroscopy. Plenum Press New. R. Principles of Fluorescence Spectroscopy. Plenum Press, New York, (1983).
3. C Richards, Solvents and Solvent Effects in Organic Chemistry, VCH, New York, 1991. 4. B Koutek, Collect. Czech. Chem. Commun.
1978 43, 2368.
5. N R Patil, R M Melavanki, S B Kapatkar, N H Ayachit, J Saravanan. Journal of fluorescence (2011)21:1213-1222
6. Raveendra M Melavanki, N R Patil, S B Kapatkar, N H Ayachit, Siva Umapathy, J Thipperudrappa, A R Nataraju J Mol liquids 158(2011)105-110
7. Raveendra M Melavanki, H D Patil, Siva Umapathy, J S Kadadevaramath J Fluoresc (2012)22:137-144
8. J.J Aaron, M.D Gaye, C Parkanyi, N.S. Cho, L Von Szentpaly, J. Mol. Struct. 156, (1987) 119.
9. C Parkanyi, M.R Stem-Beren, O.R Martinez, J.J Aaron. M.B MacNair; A.F Arietta, Spectrochim. Acta Part A. 60, (2004)1805. 10. A. Kawski; B. Kuklinski ; P. Bojarski; Z.
Naturforsch. 57A, (2002), 716.
11. K. Fukui, T. Yonezawa, H. Shingu, J. Chem. Phys. 20 (1952) 722
12. L. Bilot, A. Kawski, Z. Naturforsch 17A, (1962) 621-627.
13. L. Bilot, A. Kawski, Z. Naturforsch 18A, (1963) 961-966.
14. N.R. Patil, R.M. Melavanki, B. M. Chougala, L.A. Shastri, and F.M. Sanningannavar Int. J. Life Science & Pharma Research, Vol 2, Issue 2 (2012) L-139-149
15. M.S. Zakerhamidi, S. Ahmadi-Kandjani, M.
Moghadam, E. Ortyl, S. Kucharski,
Research Article ISSN 2250-0480 VOL 4/ISSUE 1/JAN-MAR 2014 16. Mohd Muassir Husain, Rajeev Sindhu and
Harmesh Chander Tandon, EurJchem 3 (1) (2012) 87-93
17. A. Kawaski. Acta Phys. Polon 29 (1966)507 18. A. Kawski, L. Bilot, Acta Phys. Polon 26
(1964) 41,
19. A. Kawski, Acta Phys. Polon 29 (1966) 507, 20. Frisch MJ, Trucks GW, Schlegel HB et
al(2003) Gaussian, revision B. Gaussian Inc., Pittsburg
21. Raviraj, A. Kusanur and Manohar.V. Kulakarni, Indian Journal of Chemistry Vol. 44B March 2005, pp 591-594
22. B. B. Dey and Y. Shankaranaraayan, J. Ind. Chem. Soc. 11(1934) 687
23. S. Rangaswamy, T. R. Sheshadri and V. Venkateshwaralu, Proc. Ind. Acad. Sci.13A (1941) 316
24. L. A. Shastri a; M. V. Kulkarni a; V. Gupta b;
N. Sharma b, Synthetic Commun,
38(2008) 1407–1415
25. Sunita Joshi, Rituparna Bhattacharjee, Tej Varma Y, Debi D. Pant Journal of Molecular Liquids 179 (2013) 88-93
26. E. Lippert, Z. Naturforsch. 10 A (1955) 541. 27. N.G Bakshiev,Opt,Spectroscopic.16 (1964)
821.
28. A Chamma, P. Viallet, C.R.Acad. Sci. Paris, Ser. C270 (1970) 1901
29. Ravi M, Soujanya T, Samanta A,
Radhakrishnan TPJ Chem Soc Faraday Trans 91:2739(1995)
30. J.T Edward Molecular volumes and Parachor. Chem, Ind. London 774(1956)
31. Nagaraj V, Brearley AN, Taj JK, Barbara PF J Chem Phys 86:3183(1987)
32. Kahlow M A, Kang TJ, Berbara PF J Chem Phys 86:2372(1988)
33. C Richards Molecular Interactions. (Edition) Wiley, New York (1982)