ANALYSIS OF TWO FLUORESCENT MOLECULES PROPERTIES
USING SOLVATOCHROMIC SHIFT METHOD
N.R. PATILA, R. M. MELAVANKIB*, B. M. CHOUGALAC, L.A. SHASTRIC AND
F M SANNINGANNAVARD
A Department of Physics, B.V.B. College of Engg. & Tech., Hubli-580031, Karnataka, India,. B Department of Physics, M. S. Ramaiah Institute of Technology, Bangalore-560054, Karnataka,India.
CDepartment of Chemistry, Karnatak University Dharwad-580003, Karnataka, India. DDepartment of Physics, Karnataka Science College Dharwad-580003, Karnataka, India.
ABSTARCT
The absorption and emission spectra of two fluorescent coumarins molecules coumarins namely 5BAMC and 4DHMC have been recorded at room temperature in solvents of different polarities. The ground state dipole moments (g) of two coumarins were determined experimentally by Guggenheim method. The exited state (e) dipole moments were estimated from Lippert’s, Bakhshiev’s and Kawski-Chamma-Viallet’s equations using the variation of Stoke’s shift with the solvent dielectric constant and refractive index. The geometry of the molecule was fully optimized and the g were also calculated theoretically by Gaussian 03 software using B3LYP/6-31g* level of theory. Further, Δµ were calculated both from solvatochromic shift method on the basis of microscopic solvent polarity parameter ( ) and the values are compared. The g and e were calculated by means of solvatochromic shift method and e was determined in combination with g. It was observed that e were higher than those of the g, indicating a substantial redistribution of the π-electron densities in a more polar excited state for two coumarins.
Keywords: Solvatochromic shift method, ground state and excited state dipole moments, coumarins and DFT.
1.
INTRODUCTION
The effect of solvent on the absorption and fluorescence characteristics of organic compounds has been a subject of interesting investigation [1-5]. Excitation of a molecule by photon causes a redistribution of charges leading to conformational changes in the excited state. This can result in an increase or decrease of dipole moment of the excited sate as compared to ground state. The dipole moment of an electronically excited state of a molecule is an important property that provides information on the electronic and geometrical structure of the molecule in the short-lived state. All the methods available so far for the determination of singlet excited-state dipole moment are based on the spectral shift caused either externally by
electrochromism or internally by solvatochromism. The solvatochromic method is based on the shift of absorption and fluorescence maxima in different solvents of varying polarity. Several workers have made extensive experimental and theoretical studies on ground state (μg) and excited-state (μe) dipole moments using different techniques in variety of organic fluorescent compounds like coumarins, indoles, purines, and fluorescein and in some laser dyes [6-19] etc.
L - 140 dye laser media and as nonlinear optical chromospheres. In this paper, we report the effects of solvent on absorption and emission spectra, and estimation of ground and excited-state dipole moments of two coumarins namely 5BAMC and 4DHMC by solvatochromic shift method and theoretical studies on ground state (μg) dipole moments using DFT(B3LYP/6-31g* method)[20]. However, there are no reports available in literature on the determination of μg and μe values of these molecules investigated.
2.
EXPERIMENTAL
2.1. Chemicals used
The solutes of two fluorescent coumarins m olecules namely 5BAMC and 4DHMC were
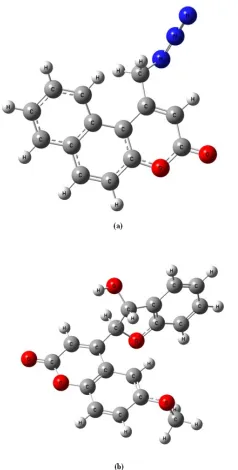
synthesized in our laboratory using standard methods [21-24]. The molecular structures of these molecules are given in Fig.1. The solvents used in the present study namely methanol, propanol, dmso, trichloroethane, ethyl acetate, dieth yl ether, dichloromethane, tetrahydrofuran, dimethy lformamide, ethanol,benzene, toluene, acetonitrile, acetone, carbon tetrachloride,1,4 dioxane, ether and butanol are used for 5BAMC whereas,
acetonitrile, butanol, diethylether (dee), dichloroethane (dce), dimethylformamide (dmf), dimethylsulphoxide (dmso), n-heptane, isopropanol and toluene solvents are used for 4DHMC. All the solvents were obtained from S-D-Fine Chemicals Ltd., India, and they were of spectroscopic grade. The required solutions were prepared at fixed concentration of solutes 1104M in each solvent.
Figure 1: The molecular structures of [5BAMC] & [4DHMC]
2.2. Spectroscopic measurements
The absorption spectra were recorded using Hitachi 50–20 UV–Vis spectrophotometer. Fluorescence intensities of the solutions were measured on Hitachi F-2000 Spectrofluorimeter at room temperature with perpendicular geometr y. The dielectric constants of the dilute solutions were measured in a suitably fabricated cell of usually small capacitance where the accurate
determination of small changes in the capacitance would be possible. The small capacitance can be measured with the help of Forbes Tinsley (FT) 6421 LCR Data Bridge at 10 KHz frequency. The refractive indices of various dilute solutions of the solute for sodium D line were determined by using Abbe’s refractometer. All these measurements were carried out at room temperature (300 K).
2.3 Determination of the dielectric constant and refractive index.
L - 141
X 1
X 2
12 C C
C C
(1) where C2, CX and C1, represent the capacitances due to leads, solution, and air respectively. The values of dielectric constants thus determined for 5BAMC and 4DHMC using toluene. The values of refractive indices (n12) of solutions were determined for 5BAMC and 4DHMC using toluene respectively.
3. Theory
3.1 Theoretical calculations of ground-state dipole moments
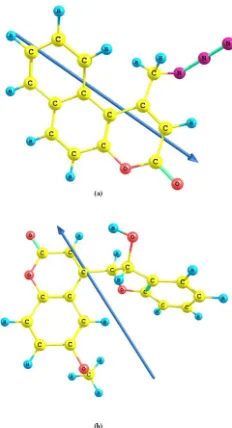
The ground-state dipole moments (g) of these two molecules were calculated by quantum chemical calculations. All the computations were carried out using the Gaussian 03 program [20] on a Pentium-4 PC. The basis sets at the levels of theory B3LYP/ 6-31 g* were used for calculations and corresponding optimized molecular geometries are shown in Fig.2. The values of ground-state dipole moments obtained from ab initio calculations using DFT.
Figure 2 : Optimized geometries of (a) 5BAMC and (b) 4DHMC
L - 142
Figure 3 : Ground state optimized molecular geometries of (a) 5BAMC and (b) 4DHMC. The arrow indicates the direction of the dipole moment.
3.2 Experimental calculations of ground-state dipole moments
The ground-state dipole moments (g) of these two dyes were estimated experimentally using Guggenheim’s method [25]. According to this the expression for ground-state dipole moment is given by
2
2
24
27
2 1 1 2
C X n
N
KT
g
where
2
1 1 2 12
12n n
where K the Boltzmann constant, T the absolute temperature in Kelvin, 'N' the Avogadro’s number, 12 the dielectric constant and n12 refractive index of the solution,1and n1 are the dielectric constant and refractive
index of the pure solvent and C the concentration of the solute in given solvent. The estimated values of the ground-state dipole moments (g) using Eq.2 for 5BAMC and 4DHMC respectively.
3.3 Experimental calculations of excited state dipole moments
The three independent equations used for the estimation of excited state dipole moments of two dyes are as follows
Lippert’s equation [26]
) 3 ( Constant
n) , ( F
m1 1
a f
Bakshiev’s equation [27]
) 4 ( Constant
n) , ( F m
vf 2 2
a
Kawski-Chamma-Viallet’s equation [28]
2 m3F3( ,n) Constant (5)
a f
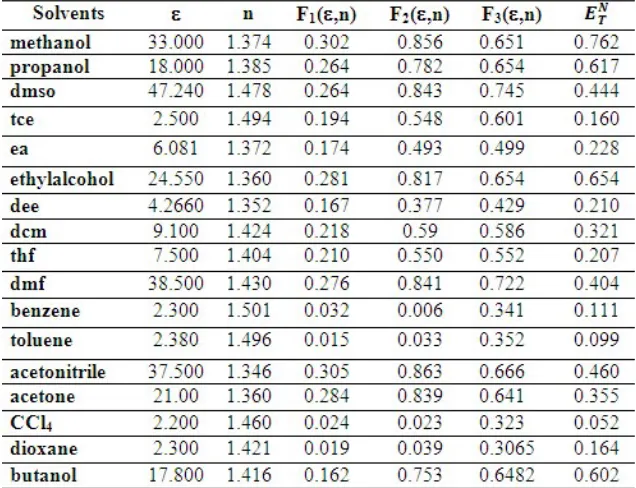
The expressions for F1(,n) [Lippert’s polarity function], F2(,n) [Bakshiev’s polarity equation] and n)
, (
L - 143
61 2 1 1 2 1 , F 2 2 1 n n n
72 1 2 2 1 2 1 , F 2 2 2 2 2 n n n n n
82 2 1 3 2 1 2 1 2 2 1 2 , F 2 2 4 2 2 2 2 3 n n n n n n n
Where a
and
f are absorption and fluorescence maxima wavelength in cm-1 respectively. The othersymbols and n are dielectric constant and refractive index respectively. From Eqs.6-8 it follows that
)
(
a
f versus F1(, n),
)
(
a
f versus F2(, n) and 2 f a versus F3(, n) should give linear graphs with slopes m1, m2 and m3 respectively and are given as
) 9 ( 2 m 3 2 1 hca g e
) 10 ( 2 m 3 2 2 hca g e
(11)2 m 3 2 2 3 hca g e
Where µg and µe are the ground and excited state dipole moments of the solute molecules. The symbols 'h' and 'c' are Planck’s constant and velocity of light in vacuum respectively; 'a' is the Onsager radius of the solute molecule. If the ground state and excited states are parallel, the following expressions are obtained on the basis of Eq.10-11.
) 12 ( 2 2 2 1 2 3 2 3 g m hca m m
) 13 ( 2 2 2 1 2 3 2 3 m hca m m e
And for (m3>m2) (14)
2 3
3 2
e m m g
m m
3.4 MOLECULAR-MICROSCOPIC SOLVENT POLARITY PARAMETER ( )
L - 144
where = 9D and are the change in dipole moment on excitation and Onsager cavity radius respectively of moleculeand and are the corresponding quantities for the solute molecule of interest. A dimensionless normalized scale was introduced in order to avoid the use of non SI unit kal/mol in ET(30) solvent polarity scale and is defined by Eq. (2.16), using water ( =1) and tetramethylsilane (TMS =
= 0) as extreme reference solvents [3].
The change in dipole moment can be evaluated from the slope of the stokes shift versus plot and is given by Eq. (2.17)
Where ‘m’ is the slope obtained from the plot of Stokes shift versus microscopic solvent polarity ( ) using Eq. (2.17). The Onsager radius of the molecule can be calculated by the method suggested by Edward [30].
3.
RESULTS AND DISCUSSION
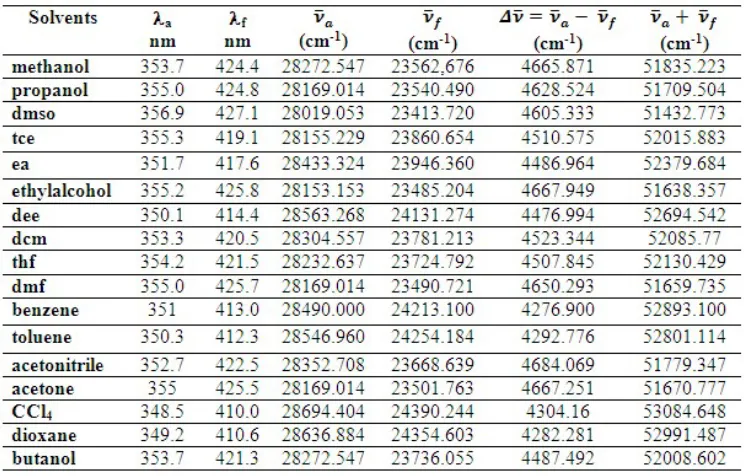
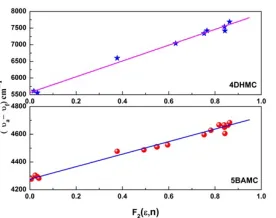
The spectral shifts and of two fluorescent molecules and solvent polarity function valuesF1(,n), F2(,n) and F3(
,n)for various solvents are presented in Table 1& 2 and Table 3 &4 respectively. We have used seventeen solvents for 5BAMC and nine solvents for 4DHMC with dielectric constants varying from 2.200 to 47.240 for 5BAMC and 2.380 TO 47.240 for 4DHMC. Figs. 4-6 show the graph of (a -f) versus F1 (, n), (a -f) versus F2 (, n) and (a+
f) versus F3 (, n)respectively. A linear progression was done and the data was fit to a straight line, corresponding values of the slopes aregiven in Table 5. In most cases (a -f) versus F1 (, n), (a -f) versus F2 (, n) and (a
+
f)versus F3 (, n) correlation is established for a larger number of solvents. In most cases the correlation coefficients are larger than 0.984 which indicate a good linearity for m1, m2 and m3 with selected number of Stokes shift data points. Generally, the deviation from linearity may be due to specific solute solvent interactions.
L - 145
Table 2: Solvatochromic data of 4DHMC in different solvents
Table 3: Calculated values of polarity functions 5BAMC
L - 146
Table 5: Statistical treatment of the correlations of solvents spectral shifts of 5BAMC and 4DHMC
A-Lippert Correlation; B- Bakshiev Correlation
C- Chamma Viallet Correlation; D- dependence of Stoke’s shift
Figure 4 : The variation of Stoke’s shift with F1 (, n) using Lippert equation for 5BAMC and 4DHMC
Figure 5: The variation of Stoke’s shift with F2 (, n) using Bakshiev’s equation for 5BAMC and
4DHMC
Figure 6: The variation of arithmetic means of Stoke’s shift with F3(, n) using
L - 147
The ground state dipole moments of two coumarins were estimated by using Guggenheim method [25]. The values obtained from this method are 6.450D and 4.492D for 5BAMC and 4DHMC respectively and also ground state (µg) dipole moment values obtained from Eq.12 are presented in Table 6. The values of Onsager cavity radii of 5BAMC and 4DHMC molecules were calculated by molecular volumes and the Parachor [30] and are listed in Table 6.
Table 6: Ground and excited state dipole moments of 5BAMC and 4DHMC
Debye (D) = 3.33564X10⁻³⁰cm = 10-18 esu cm.
a Calculated by Gaussian Software.
b The experimental ground states dipole moments calculated from Guggenheim method. c The ground states dipole moments calculated using Eq. 12.
d The experimental excited state dipole moments calculated from Lippert’s equation. e The experimental excited state dipole moments calculated from Bakhshiev’s equation.
f The experimental excited state dipole moments calculated from Chamma-Viallet’s equation. g The excited states dipole moments calculated using Eq. 13.
h The change in dipole moments for µeg and µgc i The change in dipole moments calculated from Eq. 17
j The ratio of excited state and ground state dipole moments values calculated using Eq.14.
The excited state (µe) dipole moments of the two fluorescent molecules, estimated by computing the values of ground state (µg) dipole moments obtained from Guggenheim method, in Eq. 9-11 are presented in Table 6. Also the (µg) and (µe) values were obtained from Eq. 12 and 13. The ratio of (µg) and (µe) obtained from Eq.14 are presented in Table 6. The experimental (from Eq. 2) and theoretically calculated (ab initio calculations using DFT) values are presented in Table 6. The experimental and theoretical ground state (µg) dipole moment results are good in agreement for our used chemical systems as shown in Table 6 [4, 12 and 26]. The difference in the ground state dipole moment is due to the necessity of knowing the radius of the solute molecule in Eq. 12 as compared to experimental and theoretical values obtained from Eq. 2 and ab initio calculations using DFT. It may be noted that the measured values of (µg) and (µe) for C1and C2 differ from each other. The higher values of (µe) in the case of C2 may be attributed to the structural difference between the molecules. It may be noted that the discrepancies occur between the estimated values of (µe) for the two coumarins. These differences
between the values of (µe) may be in part, due to the various assumptions and simplifications made in the use of Lippert’s, Bakshiev’s and Kawski-Chamma-Viallet’s correlations [26-28]. The large magnitude of Stoke’s shift indicates that the excited state geometry could be different from that of the ground state. The general observation is that there is an increase in Stoke’s shift with increase in solvent polarity which shows that there is an increase in the dipole moment on excitation.
L - 148
Figure 7 : The variation of Stoke’s shift with for 5BAMC and 4DHMC
The Solvatochromic data can be used to identify the spectra, namely - *, n-*, etc. It can be noticed from Table1 that, with increase in the solvent polarity, the fluorescence emission peak undergoes a bathochromic shift, confirming a - * transition. The shift of the fluorescence wavelengths towards longer wavelengths could be caused, if the
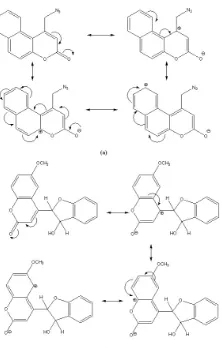
excited state charge distribution in the solute is markedly different from the ground state charge distribution, and is such as to give a stronger interaction with polar solvents in the excited state. . The observed variations in the dipole moment values can also be understood in terms of their possible resonance structures as shown in Fig 8.
Figure. 8: Possible resonance structure of (a) 5BAMC and (b) 4DHMC
4.
CONCLUSION
We have studied the photophysical properties of C1and C2. It has been found that excited state dipole moment (
e) is greater thanground state dipole moment (g) for both the coumarins. The increase in dipole moment in the excited singlet states range between about 2.5 to 3 D. This demonstrates these two coumarins are more polar in excited states than in ground states for all the solvents studied. The ground state dipole moments results are correlated (experimental and theoretical) in our used chemical systems. It may be noted that there is a difference in the ground
state and excited state dipole moments. It is worthwhile to stress that the discrepancies observed may due to approximations made in both methods to estimate ground state and excited singlet state dipole moments for two coumarins. Also Eq. 14 can be used to estimate the value of excited state dipole moment by pre-knowledge of the value of ground state dipole moment, without the necessity of knowing the Onsager radius of the solutes.
ACKNOWLEDGEMENTS
L - 149 H O D, Department of Physics, M.S.R.I.T and The Management of M.S.R.I.T, Bangalore. The Author (NRP) is grateful to Dr. A.S. Shettar, Principal, B. V. B. College of Engg. & Tech., Hubli-31 and Dr. S.B. Kapatkar H O D, Department of Physics, B.V.B. College of Engg. & Tech., Hubli-31. All
the authors are grateful to Indian Academy of Science and SERC, I.I.Sc, Bangalore, India for providing theoretical calculation using DFT facility. Authors are thankful to Prof. E. Arunan Dept. of IPC, I.I.Sc, Bangalore, India for useful discussions.
REFERENCES
[1] K. K. Rothatgi-Mukherjee, Fundamental of Photochemistry, Wiley Eastern Ltd., New Delhi, India (1986).
[2] J.R. Lackowicz, Principles of Fluorescence Spectroscopy. Plenum Press New. R.Principles of Fluorescence Spectroscopy. Plenum Press, New York, (1983).
[3] C Richards, Solvents and Solvent Effects in Organic Chemistry, VCH, New York, 1991. [4] B Koutek, Collect. Czech. Chem. Commun.
1978 43, 2368.
[5] N R Patil, R M Melavanki, S B Kapatkar, N H Ayachit, J Saravanan. Journal of fluorescence (2011)21:1213-1222
[6] Raveendra M Melavanki, N R Patil, S B Kapatkar, N H Ayachit, Siva Umapathy, J Thipperudrappa, A R Nataraju J Mol liquids 158(2011)105-110
[7] Raveendra M Melavanki, H D Patil, Siva Umapathy, J S Kadadevaramath J Fluoresc(2012)22:137-144
[8] J.J Aaron, M.D Gaye, C Parkanyi, N.S. Cho, L Von Szentpaly, J. Mol. Struct. 156, (1987) 119.
[9] C Parkanyi, M.R Stem-Beren, O.R Martinez, J.J Aaron. M.B MacNair; A.F Arietta, Spectrochim. Acta Part A. 60, (2004)1805. [10] A. Kawski; B. Kuklinski ; P. Bojarski; Z.
Naturforsch. 57A, (2002), 716.
[11] K. Fukui, T. Yonezawa, H. Shingu, J. Chem. Phys. 20 (1952) 722
[12] L. Bilot, A. Kawski, Z. Naturforsch 17A, (1962) 621-627.
[13] L. Bilot, A. Kawski, Z. Naturforsch 18A, (1963) 961-966.
[14] B. Acemioglu, M. Arık, H. Efeoglu, Y. Onganer. J. Mol. Struct. (Theochem.), 548(2001) 165
[15] J. Thipperudrappa, D. S. Biradar, S. R. Manohara, S. M. Hanagodimath, S. R. Inamadar and J.R. Manekutla, Spectrochimica Acta, Part A 69 (2008) 991. [16] B. R. Gayathri, J. R. Mannekutla, S. R.
Inamadar. J. Mol. Struct. 889 (2008) 383-393.
[17] A. Kawaski. Acta Phys. Polon 29 (1966)507 [18] A. Kawski, L. Bilot, Acta Phys. Polon 26
(1964) 41,
[19] A. Kawski, Acta Phys. Polon 29 (1966) 507, [20] Frisch MJ, Trucks GW, Schlegel HB et
al(2003) Gaussian, revision B. Gaussian Inc., Pittsburg
[21] Raviraj, A. Kusanur and Manohar.V. Kulakarni, 00-29 Indian Council of Chemists, 22nd Conference (2003) Roorkee. (Uttaranchal)
[22] B. B. Dey and Y. Shankaranaraayan, J. Ind. Chem. Soc. 11(1934) 687
[23] S. Rangaswamy, T. R. Sheshadri and V. Venkateshwaralu, Proc. Ind. Acad. Sci.13A (1941) 316
[24] L. A. Shastri a; M. V. Kulkarni a; V. Gupta b; N. Sharma b, Synthetic Commun, 38(2008) 1407–1415
[25] E. A. Guggenheim Trans. Far. Soc. 47 (1951) 57
[26] E. Lippert, Z. Naturforsch. 10 A (1955) 541. [27] N.GBakshiev,Opt,Spectroscopic.16 (1964)
821.
[28] A Chamma, P. Viallet, C.R.Acad. Sci. Paris, Ser. C270 (1970) 1901
[29] Ravi M, Soujanya T, Samanta A, Radhakrishnan TP(1995) J Chem Soc Faraday Trans 91:2739
![Figure 1: The molecular structures of [5BAMC] & [4DHMC]](https://thumb-us.123doks.com/thumbv2/123dok_us/8706041.1739650/2.612.265.371.300.479/figure-molecular-structures-bamc-dhmc.webp)